
 Significant latent value?
Aberdeen Frontier Markets (AFMC)’s manager has been re-positioning the portfolio by reducing exposure to Sub-Saharan Africa, adding companies in new markets and re-introducing the momentum factor. There is a now a greater tilt to the Asia Pacific region, where Vietnam accounts for over a quarter of the portfolio. AFMC holds a concentrated selection of companies that offer the prospect of double-digit earnings growth paired with inexpensive valuations (the weighted average current year P/E ratio of portfolio companies is 10.0x).
AFMC exhibits a low correlation with its benchmark as well as to emerging (68%) and developed (61%) equity markets. A slowdown in the global economy could increase flows into frontier markets (where growth is largely driven by domestic factors) as investors search elsewhere for returns.
Direct investment in frontier markets
AFMC aims to generate long-term capital growth, primarily from investment in equity and equity-related securities of companies listed in, or operating in, frontier markets. Frontier market countries may include countries within the MSCI Frontier Markets Index or additional countries that the investment manager deems to be such.
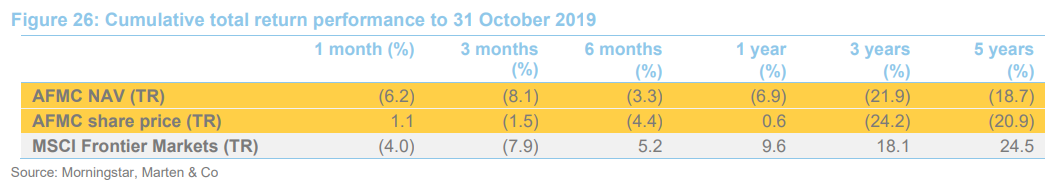
| wdt_ID | Year ended | Share price TR (%) | NAV TR (%) | MSCI Frontier Markets TR (%) | MSCI Emerging Markets TR (%) | MSCI World TR (%) |
|---|---|---|---|---|---|---|
| 1 | 31 Oct 2015 | -19.20 | -15.70 | -14.40 | -11.10 | 6.00 |
| 2 | 31 Oct 2016 | 29.10 | 23.40 | 23.20 | 38.70 | 28.80 |
| 3 | 31 Oct 2017 | -0.80 | 0.00 | 17.70 | 16.70 | 13.50 |
| 4 | 31 Oct 2018 | -24.00 | -16.10 | -8.40 | -8.70 | 5.70 |
| 5 | 31 Oct 2019 | 0.60 | -6.90 | 9.60 | 10.90 | 11.90 |
Fund profile
The investment objective of the company is to generate long-term capital growth, primarily from investment in equity and equity-related securities of companies listed in, or operating in, frontier markets. Frontier market countries may include countries within the MSCI Frontier Markets Index or additional countries that the managers deem to be such due to their characteristics, including many constituents of the MSCI Emerging Markets Index.
AFMC is managed by Aberdeen Standard Investment’s Global Emerging Markets team, which is headed by Devan Kaloo. He joined the team in 2017 following a vote by shareholders to shift the trust’s strategy from a fund of funds mandate to direct investing. Devan’s team includes Mark Gordon-James, who is a senior investment director and AFMC’s lead manager. Mark has been with Aberdeen since 2004, joining from Merrill Lynch’s emerging markets team. Aberdeen Standard Investments is well-known for its emerging markets expertise. The global emerging markets team, which is distributed across offices in seven countries, had assets under management of $33.2bn at the end of June 2019. AAM has been running a dedicated frontier markets strategy since 2009 and has been investing in the area since the 1980s. The frontier markets strategy had assets of $272m at the end of June 2019.
Why have frontier markets underperformed?
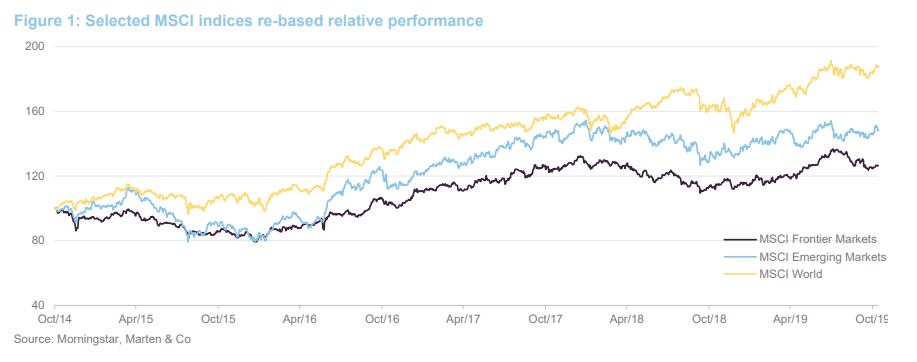
Notwithstanding improved performance so far this year, led by Kuwait and Vietnam, frontier markets have delivered poor relative returns over recent years, when compared to the MSCI Emerging Markets index and the US-dominated MSCI World indices.
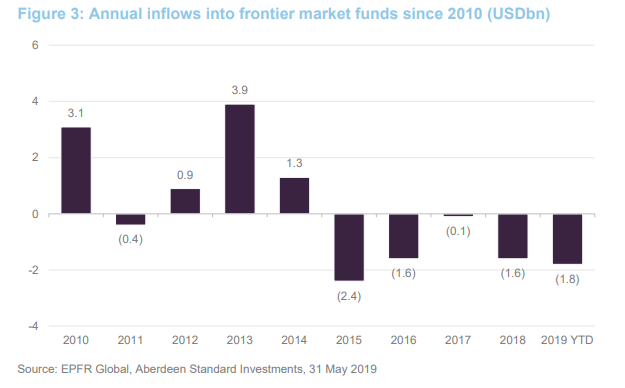
Several countries (including Argentina, Ghana, Egypt, Pakistan and Sri Lanka) have had to request large financial assistance packages from the IMF. Foreign capital flows have been predominantly outward since 2015 (see Figure 3), as concerns over fundamentals in many markets have been compounded by the strength of the US equity market, which continues to deliver strong returns off a much lower risk base.
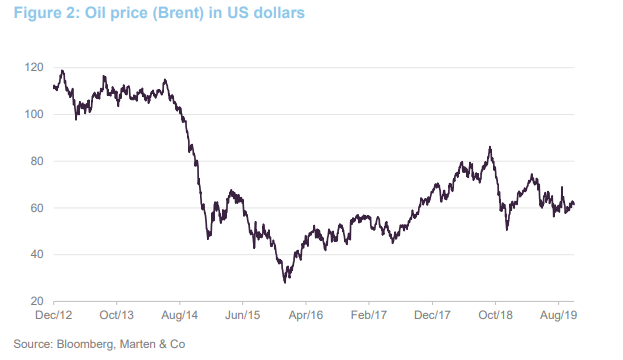
The collapse of the oil price over the second half of 2014, denoted by Figure 2, together with a broader softening in commodity prices, hurt several major frontier markets, while the strength of the US dollar from July 2014 onwards also weighed heavily.
Active funds have been relentlessly withdrawing capital from frontier markets, precipitating steep declines in average daily trading volumes across many markets.
AFMC says that over the past five years, only two markets classified as frontier – Kuwait and Vietnam – have displayed a truly positive narrative. Kuwait has benefitted from its stable oil-based economy, a USD-pegged exchange rate and investors pricing-in an expected upgrade in status from ‘Frontier’ to ‘Emerging’ by MSCI (see page 6 in the enclosed pdf version). Vietnam’s thriving export sector has been propelling the economy higher, making it one of the best performing emerging/frontier economies over recent years (see page 8 in the enclosed pdf version).
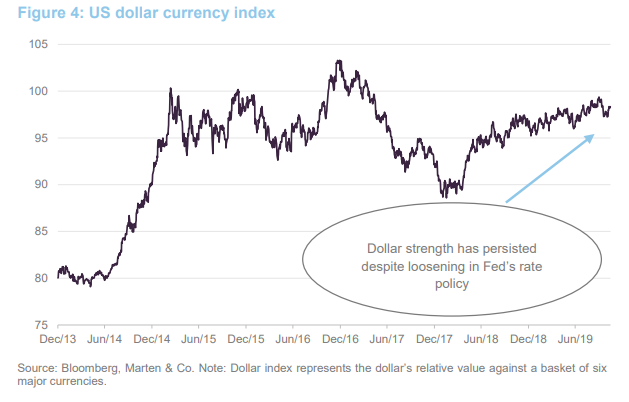
The Fed reversed course at the beginning of the year, moving from promising to toughen restrictions on growth to reducing interest rates, as concerns about a slowing economy mounted. Yet dollar strength has persisted over most of this period, with slowing global growth, geopolitical tensions and trade concerns, re-enforcing its safe-haven appeal.
Returns from investing in emerging and frontier markets tend to correlate negatively with the dollar. In late October 2019, the Fed reduced interest rates for a third time this year, finally weakening the dollar index, shown in Figure 4. If the recent weakening were to persist for a period of time, this would likely serve to attract flows from developed markets into emerging and frontier markets.
Benchmark problems
The performance of the MSCI Frontier Markets Index is heavily skewed by countries being promoted or demoted to and from the MSCI Emerging Markets Index. Mark has strong feelings towards some of the major constituent stocks within the MSCI Frontier Market Index. He believes that focusing on quality and value when selecting investments is a better strategy, long-term, than trying to ride the roller coaster and game the index moves. AFMC say that they are ‘benchmark aware’, without being ‘benchmark driven.’ The benchmark is used mainly as a reference index for performance comparison.
Mark makes the point that Bahrain and Kuwait, two of the highest-weighted index constituents, have a combined population of just 4m – a fraction of the 2bn or so size of the frontier universe. He also says that with less than 100 securities making up the index, it is a narrow pool compared to the many thousands of listed companies.
Country reclassification sensitivities – Kuwait case study
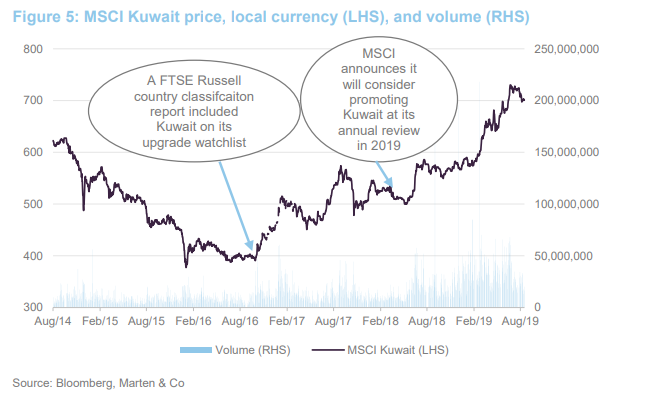
Announcements made by MSCI with respect to upgrades and downgrades between its Emerging and Frontier indices typically exert significant influence on price and volume activity in a country. Using Kuwait as a case study, at the end of September 2019, the Gulf market accounted for 30.2% of the benchmark (the capitalisation of the Kuwaiti market is close to $100bn). Earlier in June 2019, MSCI announced that Kuwait would be promoted to the Emerging Market Index in 2020. This move was widely priced in, notably after MSCI announced in the summer of 2018 that Kuwait’s promotion candidacy would be reviewed in 2018. Since mid-2018, trading volumes in Kuwaiti stocks have climbed considerably, shown in Figure 5 below.
This rollercoaster ride has been repeated many times and sometimes speculators get caught out. Argentina’s (it was 13.9% of the Frontiers index at end-April 2019) upgrade to ‘Emerging’ earlier this year was shortly followed in August by one of the most severe corrections ever experienced by a stock market, as it entered yet another sovereign debt crisis.
With such rapid change in the country representation of the index, the manager believes the best approach is to focus on selecting quality companies and disregard the gyrations caused by index rebalancing exercises.
Manager’s view – frontiers are cyclically attractive
Foreign investors have withdrawn significant capital from frontier markets in recent years. This situation could reverse as investors reassess the prospects of frontier markets in response to falling interest rates and weaker equity returns across developed markets. This forms part of the manager’s cyclical argument supporting the investment case for frontier markets, at this time.
Many frontier market economies have relatively weak trade linkages with developed markets, with growth driven by domestic and idiosyncratic factors. Counter-cyclical defensiveness in the wake of slowing global growth could support capital flows into many of the countries AFMC invests in, particularly if the US dollar starts to weaken.
The manager also believes the fact that several of the portfolio’s main country exposures are currently in IMF programmes means they are following their own idiosyncratic economic paths to an extent, making them less aligned to the global cycle.
The majority of frontier markets are attractively valued, with many trading on steep discounts compared to seven years ago. Mark mentioned Nigeria and Pakistan as examples where valuations are down sharply (two standard deviations below long-term price/earnings ratios). Mark noted that the weighted average current year price/earnings ratio of AFMC’s portfolio companies is 10.0x against expected forward earnings growth of approximately 15%.
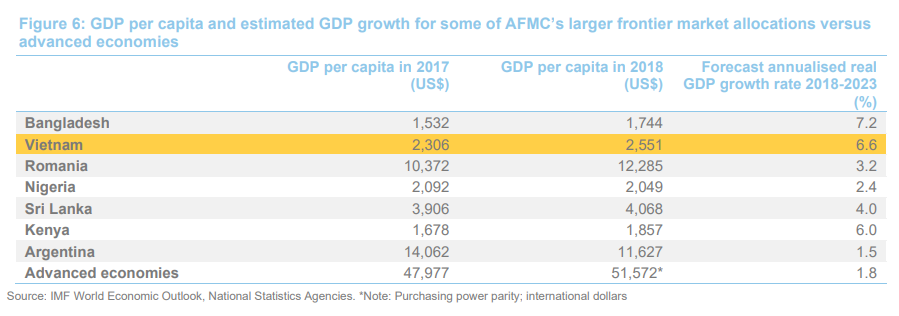
The asset class offers a way to capture the long-term growth of pre-emerging countries; many of these economies grow at more than 5% per annum. Figure 6 shows the GDP per capita and forecast real GDP growth for some of AFMC’s largest allocations, including a comparison with an IMF grouping of advanced economies. By leveraging newer technologies, such as mobile telecoms and digital money, some of the better-placed frontier markets will aim to accelerate through their development stages.
Rationale behind low allocation to Gulf economies
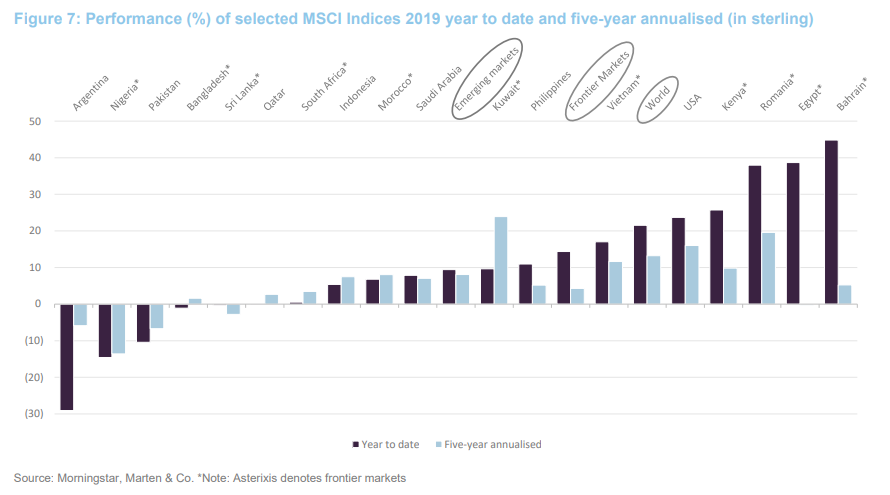
Kuwait and Bahrain have been among the best performing ‘frontier’ classified markets this year. Kuwait’s equity market has been performing very well for some time now (see Figure 7).
AFMC say that their underweight allocation to Bahrain and Kuwait reflects the fact that three banks (National Bank of Kuwait, Kuwait Finance House and Ahli United Bank) account for about two thirds of the combined capitalisation of the markets. Momentum from M&A activity, and index upgrade speculation, has increased the market value of the stocks to about 2-3x book value.
AFMC does not believe the banks offer value at these prices, based on their fundamentals. The manager says that similar growth prospects, at more attractive prices, can be found elsewhere.
Vietnam – now over a quarter of the portfolio
Vietnam is AFMC’s largest market by a distance, at more than one quarter of total asset value (see the ‘asset allocation’ section). The country, which is still classified as a frontier market by MSCI, has positively stood out over recent years, a period that has been very challenging for emerging and frontier markets. Mark believes that an MSCI upgrade review to ‘Emerging’ is likely to take place by 2021.
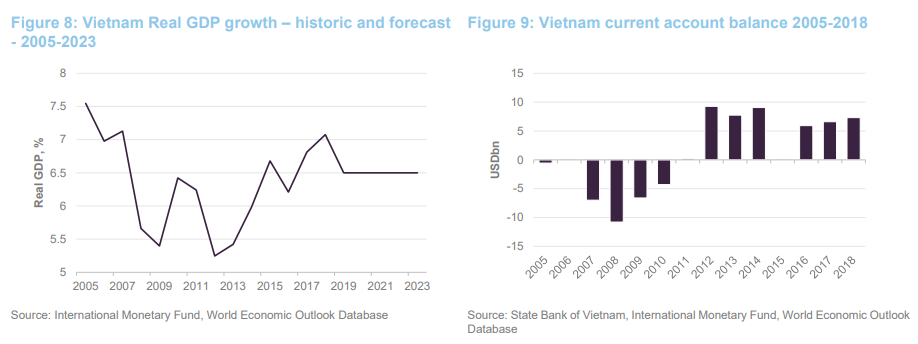
At close to $200bn, the market capitalisation of Vietnam’s stock market is higher than a lot of markets classified as ‘emerging market’ by MSCI. It’s 95m population economy is growing quickly, with real GDP annual growth averaging 6.6% over 2014–2018, according to the IMF’s World Economic Outlook database. The forecast is for a rate of 6.5% to be maintained over the period to 2023.
As a major global exporter, Vietnam is vulnerable to a slowdown in the global economy, though the trade wars taking place present a huge opportunity to bring manufacturing into the country. This is already happening and is a long-term process. China has been actively ‘moving in’. A report by the Asian Development Bank, released in September 2019, noted that exports from emerging Asia to the US increased by 10% year-on-year over the first half of 2019. This was in spite of Chinese exports declining by 12%. Vietnamese exports increased by 33%, and Vietnam took market share in electronics.
Investment philosophy and process
The manager aims to invest in good quality companies at a sensible price. All potential investments are subject to detailed scrutiny. The manager does not try to second-guess short-term macroeconomic movements, play the MSCI upgrade cycle or invest with the herd. The focus is on stock selection and getting to know the companies it invests in.
Mark selects stocks based on fundamental analysis of companies, looking for long-term appreciation from mispriced value or growth. Some ideas are sourced from brokers but most are identified by the management team. The focus is on identifying winning companies participating in themes such as digital payments, generic pharmaceuticals, software outsourcing, and consumer banking. AFMC avoids state-owned companies.
The manager places great importance on governance when assessing a company’s quality and worth, and continuous ESG analysis is done once AFMC becomes a shareholder in a company, via a process of proactive engagement. Holdings are subject to ongoing due diligence. The team visits existing holdings at least every six months and includes a Responsible Investing analyst in an integral role. The team will always vote its stock and will explain its voting decisions to companies.
A range of valuation measures is used to assess whether a stock is cheap or expensive. Market volatility is used as an opportunity to trim or add to positions. The portfolio’s turnover, historically fairly low, has increased over the past year or so (see page 11 in the enclosed pdf version). The average holding period is close to eight years. Holdings may be sold if they fail ESG criteria or, alternatively, the manager may engage with management to encourage compliance.
Risk control is about ensuring the portfolio is adequately diversified, avoiding low-quality companies and ensuring that AFMC does not overpay for its investments. There
is a maximum 10% exposure to any one stock at the time of purchase and 15% in any one country. Index benchmark weights are not considered when constructing the portfolio and there are no sectoral restrictions. Typically, the manager expects that the fund will have between 40 and 70 holdings.
Net cash balances will not generally exceed 10% of NAV and, likewise, net gearing will be limited to 10% of NAV. The manager is permitted to use derivatives and CFDs in the management of the portfolio, but currently does not, preferring direct equity ownership.
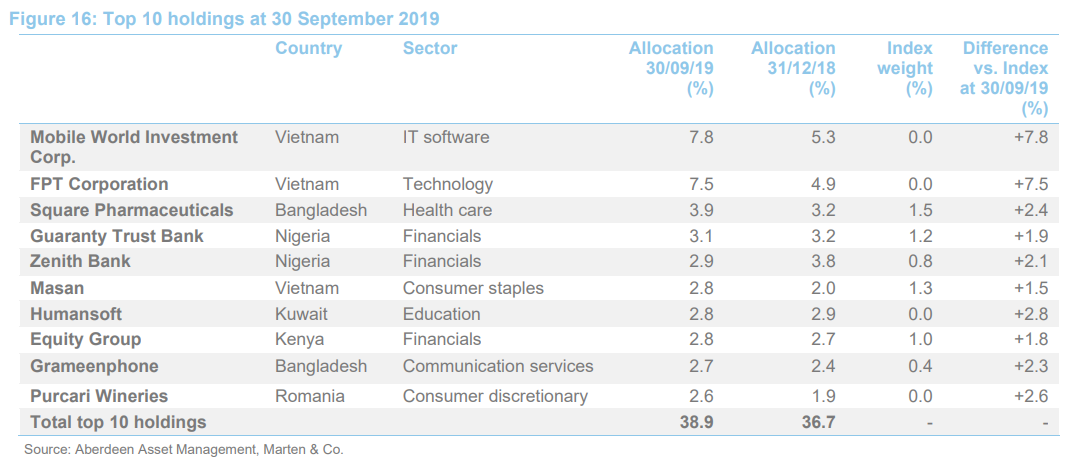
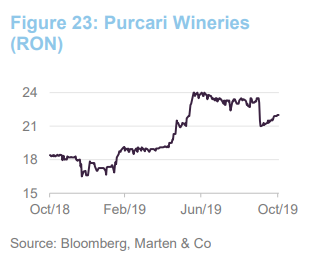
The manager likes the flexibility that AFMC’s closed-end structure brings. Relative to the open-ended funds that the manager runs, AFMC may have slightly more exposure to smaller companies. It cites the example of Purcari Wineries, a Romanian wine producer with vineyards mainly in Moldova. It has a strong domestic franchise but is expanding internationally. As of 30 September 2019, Purcari was AFMC’s 10th largest holding, at 2.6%.
The manager has the discretion to invest in markets that he deems to have similar characteristics to frontier markets, such as Egypt and Pakistan, which now come under MSCI’s ‘Emerging’ classification.
Asset allocation
As of the end of September 2019, AFMC was invested in 52 companies.
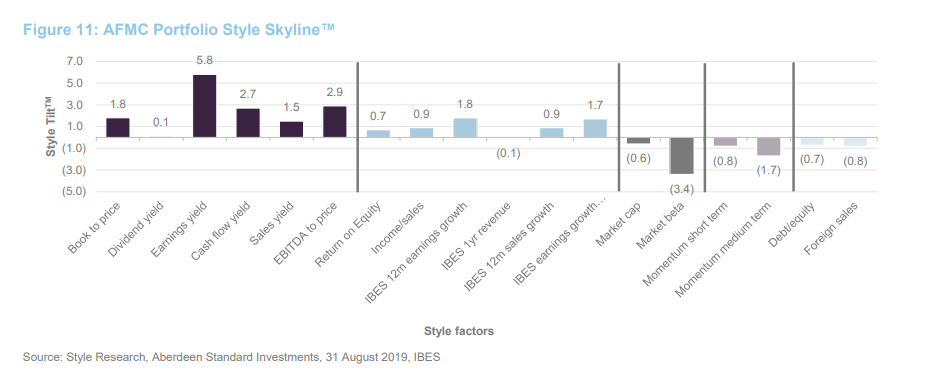
Style tilts – re-introduction of momentum
While the manager retains an underweight overall exposure to the ‘momentum’ factor, this has been loosened of late, with short and medium-term momentum increasing.
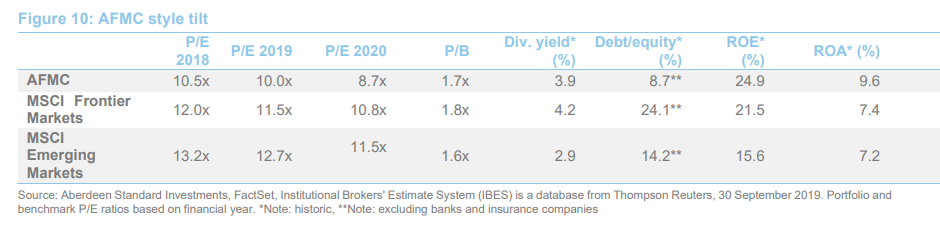
AFMC’s quality-focused style tilts are shown in Figure 10 below. An analysis of the portfolio by Style Research, as of 31 August 2019, demonstrates the portfolio’s style tilt biases relative to the benchmark. AFMC’s companies have, on average, higher returns on equity, higher cash flow yields, higher sales to price yields, less debt and a lower market beta.
Compared to the index, portfolio holdings tend to be cheaper based on trailing and forward price/earnings ratios, similarly valued in price/book terms and much less geared on a debt to equity basis. There is also a preference for companies with relatively higher return on asset profiles.
Portfolio turnover elevated as manager re-calibrates
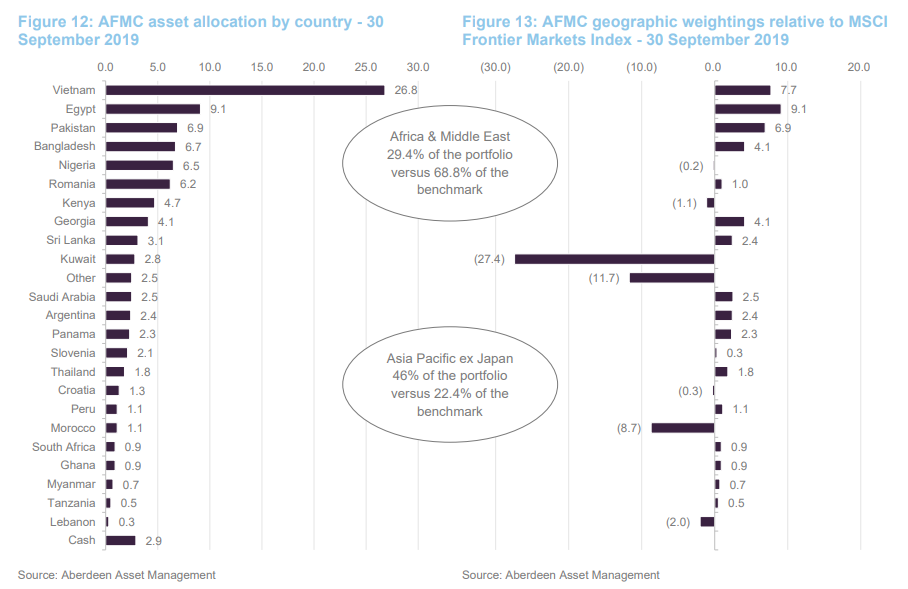
Portfolio turnover was 34% over AFMC’s financial year to 30 June 2019 – a high level for the fund. It reflected activity by the manager to shift the portfolio’s focus away from several underperforming markets, principally in Sub-Saharan Africa (SSA). At 30 September 2018, Nigeria and Kenya were in the top-five and SSA markets cumulatively accounted for 23.6% of country exposure.
As of 30 September 2019, SSA’s contribution is down to 13.5% while Asia Pacific ex Japan accounts for 46% (Vietnam represents more than half of this). Mark has reduced exposure to Kenya and Nigeria, as well as Argentina and Sri Lanka. Argentina has undergone a severe de-rating while Sri Lanka was hit by a major terrorist attack in April and its growth outlook is sluggish.
Though the portfolio’s geographic makeup predominantly reflects bottom-up stock selection, observable through its significantly different country-makeup relative to the benchmark (illustrated by Figures 12 and 13), Mark says he does have to be pragmatic in finding a balance between the top and bottom-down. Over recent years, weak sentiment has pushed down the value of what were perceived to be fundamentally sound portfolio companies. SSA’s risk-reward trade-off was disappointing in over years. Mark has introduced holdings in countries that are perceived to provide a more attractive risk outlook.
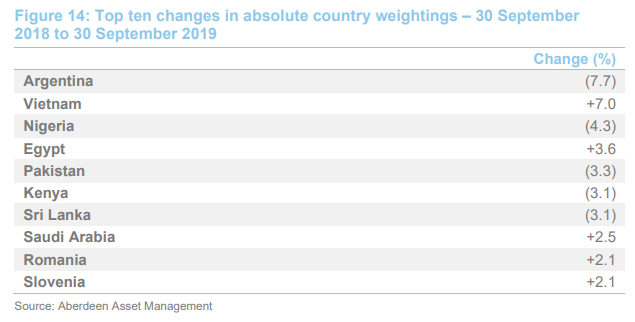
As well as increasing investment into Vietnam, Mark has added holdings in Croatia, Peru, Saudi Arabia and Slovenia. The top-ten country allocation changes over the year to September 2019 are summarised in Figure 14 below.
Consumer and financials-focused
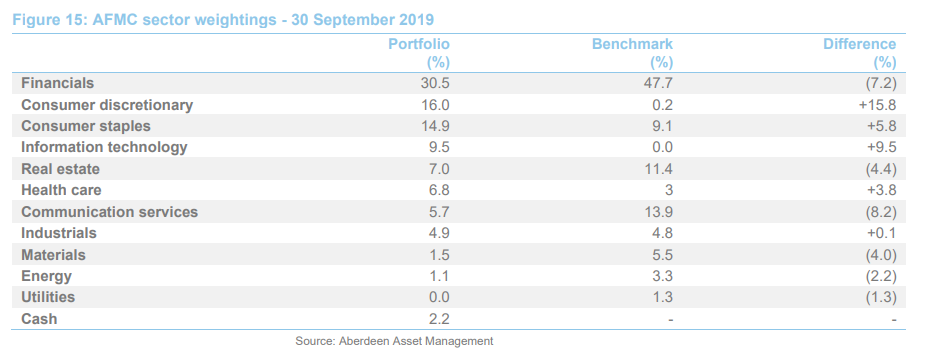
The consumer discretionary, staples and financials sectors account for over 60% of the sector allocation, aiming to capture long-term increases in the spending power and the proliferation of formal banking products.
Top 10 holdings
Figure 16 shows AFMC’s ten largest holdings at 30 September 2019. Since our last note, there have been four additions to the top 10: Masan, Humansoft, Grameenphone and Purcari Wineries. They replace BBVA Banco Francés (Argentina – financials) John Keells (Sri Lanka – industrials), Maple Leaf Cement (Pakistan – industrials) and Safaricom (Kenya – communication services).
Mobile World Investment Corporation
Mobile World Investment Corp (Mobile World) (mwg.vn/eng) is the leading home appliances and mobile phone retailer in Vietnam by sales, with a market share of around 35%. It is also a leader in e-commerce and is targeting organised food retailing with its relatively new fresh produce-focused convenience stores format (Bach Hoa Xanh).
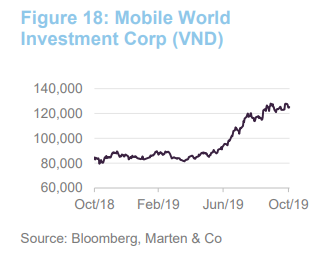
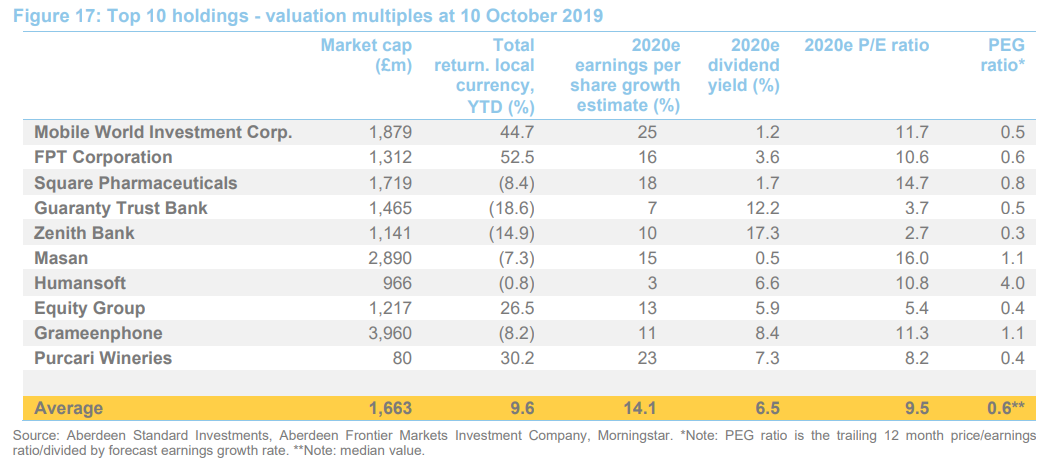
It has been an excellent performer for AFMC over the year-to-date, with the shares up around 45%. Mark believes the shares are undervalued by about 50%, based on a target P/E ratio of 18x (currently about 12x – see Figure 17). The manager says a catalyst for a re-rating could be the launch of domestic ETF focused on growth companies, which would increase the company’s accessibility to foreign investors. Currently, Mobile World’s valuation is constricted by limits on foreign ownership that restrict liquidity in the shares. When a limit has been reached on foreign ownership for a stock, a foreign investor can only acquire the shares from another foreign investor.
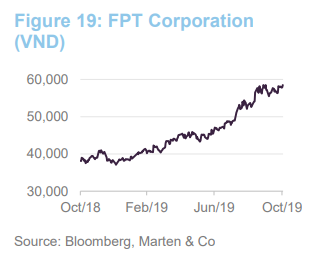
FPT Corporation
FPT Corporation (FTP) (fpt.com.vn/en) is split into three main divisions: IT software outsourcing, education and home broadband services. The manager says that IT outsourcing is the largest contributor to earnings and the fastest growing segment. FTP’s outsourcing client base includes companies in based across Europe and the US. Mark says the company will also be part of the domestic ETF and as with Mobile World, which could be a catalyst for a re-rating in the value of the shares (FPT is affected by the same ‘liquidity discount’ as Mobile World). FTP’s share price has increased by more than 50% so far this year.
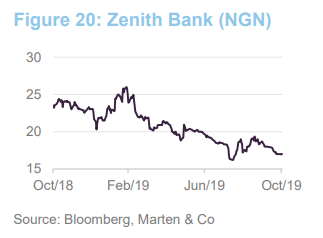
Zenith Bank
Nigeria’s Zenith Bank (Zenith) (zenithbank.com) is one of Nigeria’s two leading banks, alongside Guaranty Trust Bank (also an AFMC holding). Nigerian banking stocks have been performing poorly for some time now, in keeping with the wider Nigerian economy. AFMC’s manager told us that the banking sector has been holding a lot of capital on balance sheets; subsequent to our meeting with him, Zenith has announced plans to increase lending over the second half of the year. This comes after its loan-to-deposit ratio fell to 51.2% (from 54.6% a year earlier) in the six month period to June 2019. Nigeria’s Central Bank has briefed the banking sector to lend out at least 60% of deposits, to try and revive credit growth. For there to be a sustained turnaround in the sector, Mark says policy reform and the free-float of the naira currency are required. In the meantime, the manager says there is minimal further downside risk for their Nigerian banking holdings. Zenith’s shares are currently yielding 16.5%, making them a major contributor paid out by AFMC.
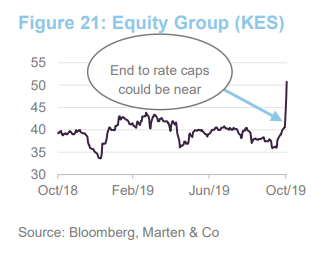
Equity Group
Equity Group Holdings (Equity Group) (equitybankgroup.com) has banking operations across East Africa, including in the Democratic Republic of Congo. It is Kenya’s biggest bank by market capitalisation and was awarded the designation of 2018 ‘SME Bank of the year’ by the International Finance Corporation. The bank, through its subsidiaries, focuses on the retail and small and medium enterprises sectors with a number of products tailored to the markets it operates in. It also has a corporate division that handles large enterprises.
Since 2016, Kenya has applied an interest rate cap on lending rates, making it very hard for borrowing to access credit. However, there appears to have been a major breakthrough in the removal of these caps. On 30 October 2019 lawmakers lent their support to President Uhuru Kenyatta’s intention to do away with the caps to stimulate loan growth. Equity Group’s shares soared on the news.
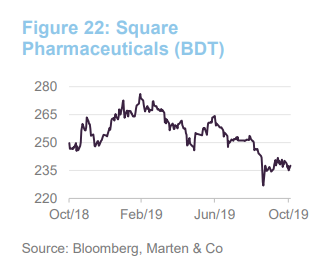
Square Pharmaceuticals
Square Pharmaceuticals (Square) (squarepharma.com.bd) is Bangladesh’s leading generic pharmaceutical manufacturer. The company’s facilities are compliant with the Food and Drug Administration’s (FDA) standards. AFMC increased its allocation to Square earlier in the year. The manager believes the company is undervalued by around 25%, noting that Indian generic pharmaceutical companies with comparable characteristics trade on trailing P/E ratios in the high 20s.
Purcari Wineries
Purcari Wineries (Purcari) (purcari.wine/en) is a Moldovian-Romanian based winery with a well-established presence across Central and Eastern Europe (CEE). The company owns over a thousand hectares of vineyards regionally; it has been growing its export business strongly outside of CEE as well.
Revenues are growing at around 20% per year, with exports to Poland and China a growing contribution. The manager believes the company’s growth will increase liquidity in the shares, which will make it a more attractive offering for a wider set of institutional investors. Mark believes the shares are substantially undervalued based on a target P/E ratio of 16x.
Elsewhere in the portfolio – Saudi Arabian shopping centre tops new additions
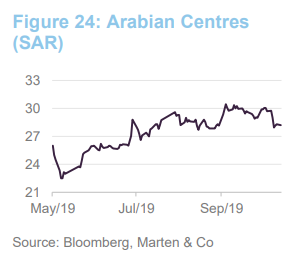
The manager has made a number of additions to the portfolio since our last note. In June, Saudi Arabia was added to AFMC’s country exposures through Arabian Centres (2.5% of the portfolio at end-September), a shopping centre developer. Mark says the company is well positioned to benefit from the gradual opening up of Saudi society, with more women entering the workforce and driving. The malls are popular meet-up points, as they are across much of the region where high temperatures mean people spend a lot of their time indoors.
Arabian Centres has a refreshed management team, led by the former CEO of Westfield Europe, to oversee a repositioning of their malls to provide more food and beverage and entertainment options. The shopping mall experience is not being disrupted by e-commerce in Saudi Arabia and most of the wider Middle East and North Africa (MENA) region due to the idiosyncrasies mentioned.
Elsewhere, Mark added Egypt-based CIRA and Cleopatra Hospitals Group in July. CIRA owns and operates several schools and universities in Cairo and other parts of the country while Cleopatra is the leading private hospital operator in Egypt.
Away from MENA, Mark made two banking sector allocations: to Austria-based Addiko Bank (which focuses on Central and Eastern Europe) and Slovenia’s largest bank, NLB. Mark also added Peru-based Grana Y Montero, an engineering, construction and infrastructure provider.
Performance
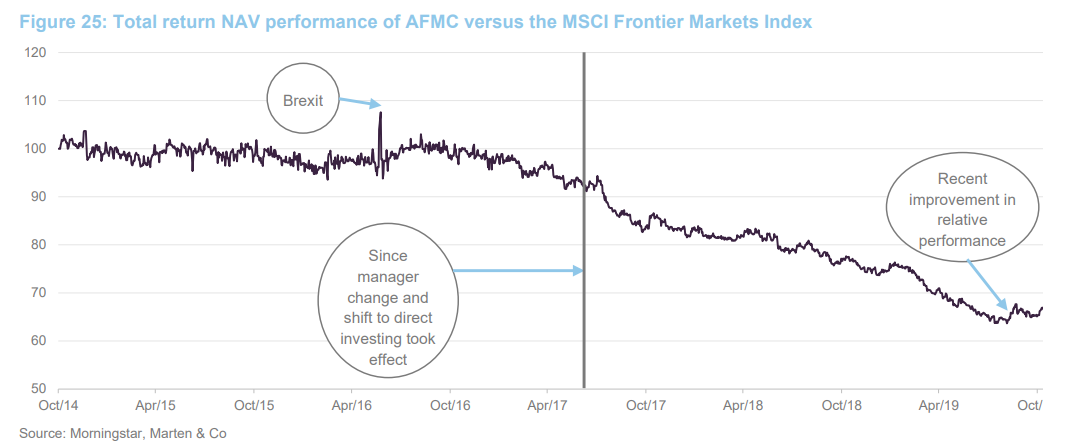
AFMC is a highly active stock picking fund with its manager stressing that the benchmark only offers a loose basis for comparison (we discussed this in the ‘benchmark problems’ section). That being said, after consistently underperforming the index and its peer-group since shifting to direct investing in mid-2017, AFMC must deliver outperformance in total return share price terms over a two-year period to 30 June 2020, or shareholders will be offered a cash exit.
AFMC’s geographic asset allocation has been the largest detractor from its returns in recent years. Relative performance has been weighed down by lower allocations to Kuwait and Bahrain, greater exposure to Sub-Saharan Africa and the underperformance of Pakistan.
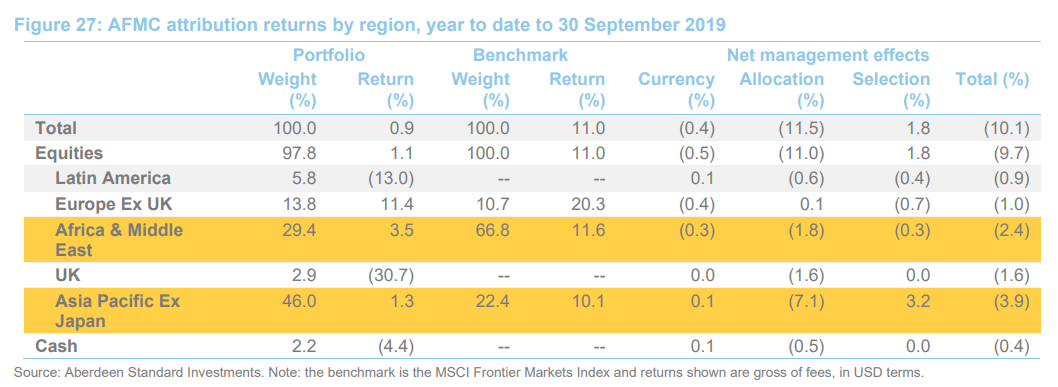
Attribution – Pakistan drags down Asia Pacific ex Japan
Figure 27 shows a geographic attribution breakdown of AFMC’s returns over the period from 31 December 2018 to 30 September to 2019. Pakistan, classified as ‘Emerging’ by MSCI, was responsible for the bulk of the relative underperformance of the Asia ex Japan region.
Mark believes Pakistan has started to turn the corner, noting that this has begun to positively impact foreign capital flows, which have edged up over the past three months. An IMF-supported adjustment programme is under way, as the country looks to rein in the current account and budget deficits. The manager believes that the structural reforms taking place, including the launch of a privatisation programme, will see the macroeconomic picture steadily improve, paving the way for earnings to tick up and the currency to strengthen.
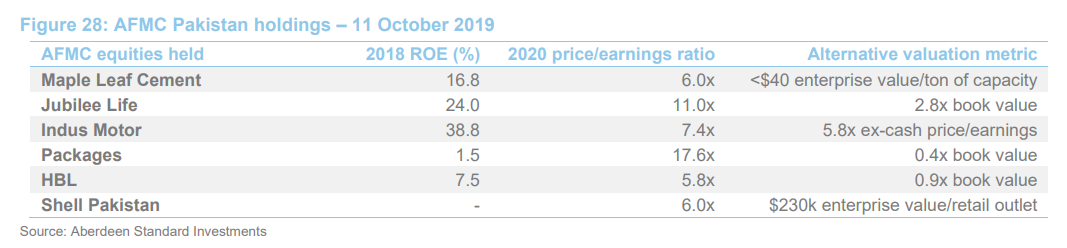
Figure 28 shows the depressed state of valuations for the AFMC’s Pakistan holdings. The equity market has been concerned about high interest rates and slowing corporate earnings. Small & mid cap names have underperformed large cap names by a considerable amount.
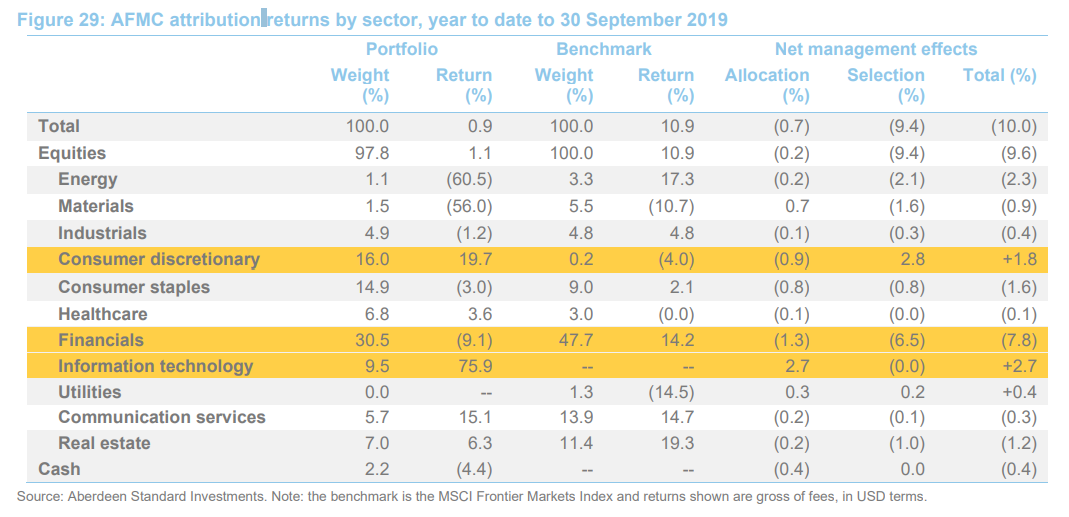
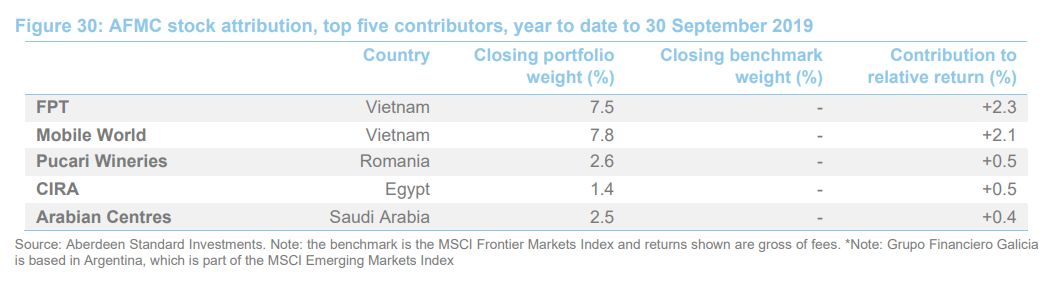
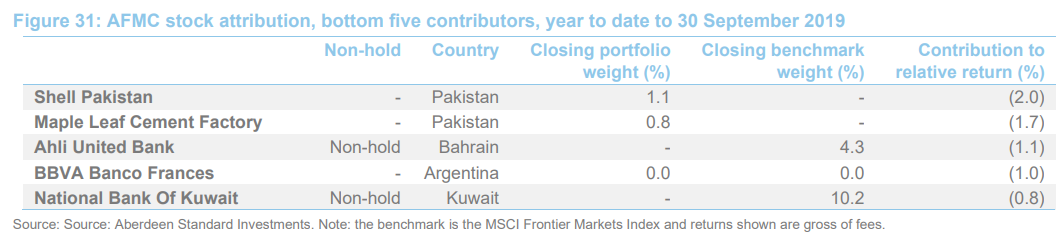
Led by FPT, technology has been the best performing sector for AFMC over 2019 (to end-September). Financials have been weighed down by banking holdings in Nigerian. Vietnam’s FPT and Mobile World contributed a combined 4.4% to AFMC’s active return while new 2019 holdings CIRA and Arabian Centres have added value immediately. Pakistani holdings as well as non-holds in Bahraini and Kuwaiti financials hurt relative performance.
Peer-group comparison
Comparing AFMC to its peers, in Figures 32 and 33, there is no disguising its poor performance record over recent years against its direct and wider peer groups. Picking out a couple of funds from the group, BlackRock Frontier Markets includes allocations to MSCI Emerging Markets Index countries such as Indonesia, UAE and Thailand. The MSCI Emerging Market Index has outperformed the Frontier Markets Index over the past three or so years.
Fundsmith Emerging Equities also has a greater focus on emerging markets, though it does share some similarities in its investment approach to AFMC; these include underweight exposure to financial stocks and overweight exposure to consumer-focused companies.
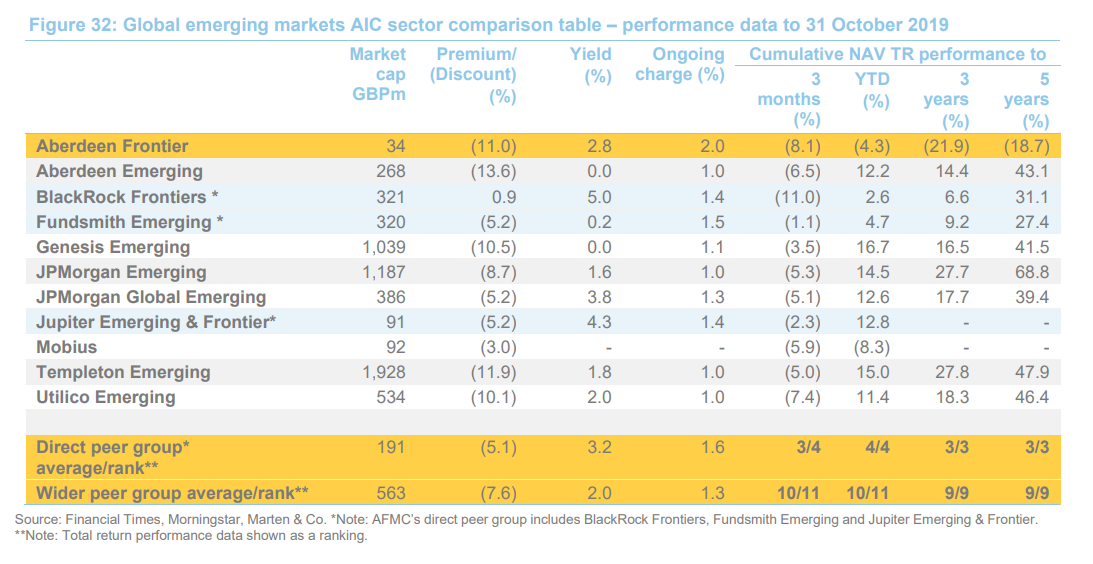
AFMC is the smallest fund in the sector by some margin. This is reflected in its ongoing charge rate of 2%, which is above average compared to both the direct and wider peer groups.
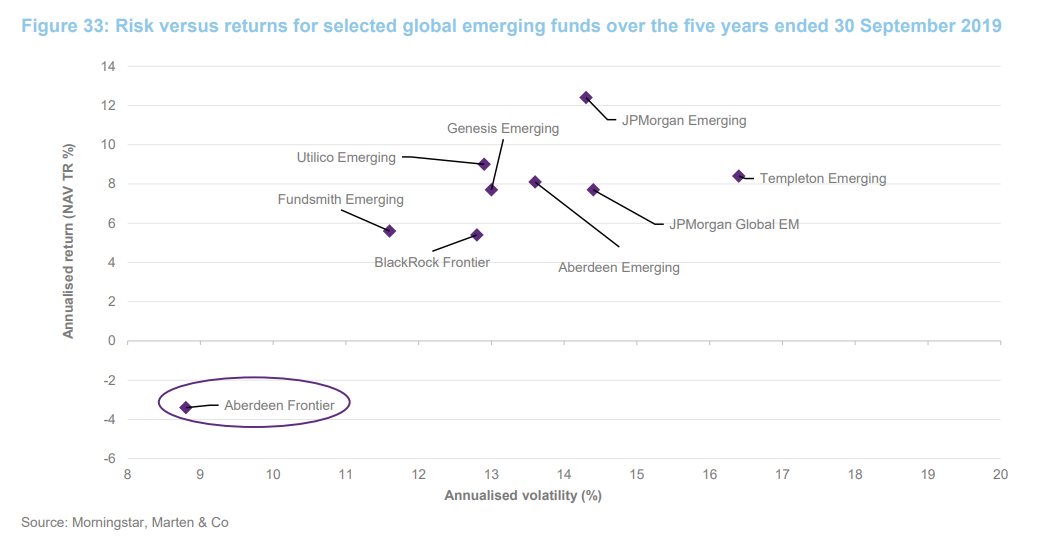
Over the past five years, AFMC has been the sector’s anomaly, as Figure 33 illustrates. Negative annualised total NAV returns as well as a significantly lower volatility profile. Mark notes that the portfolio has a relatively low portfolio correlation with emerging markets and developed markets.
Dividend
The board considers that dividends are an increasing part of the rationale for investing in frontier markets and the portfolio has a yield in excess of 3%. Dividends are declared semi-annually in US dollars. AFMC pays out dividends in July and December. In December 2018, a final dividend of 1.0 cent per share was paid out. An interim dividend, also of 1.0 cent per share was paid in June 2019. For the year to 30 June 2019, total dividends of 2.0 cents were 0.65x covered by earnings.
Premium/(discount)
Over the 12-month period to 31 October 2019, the discount moved within a range of (7.2%) and (16.1%). It was mostly recently at (11.96%) on 15 November. Widening over the summer months reflected increased risk aversion – it has since narrowed back near to its lowest (most expensive) value this year.
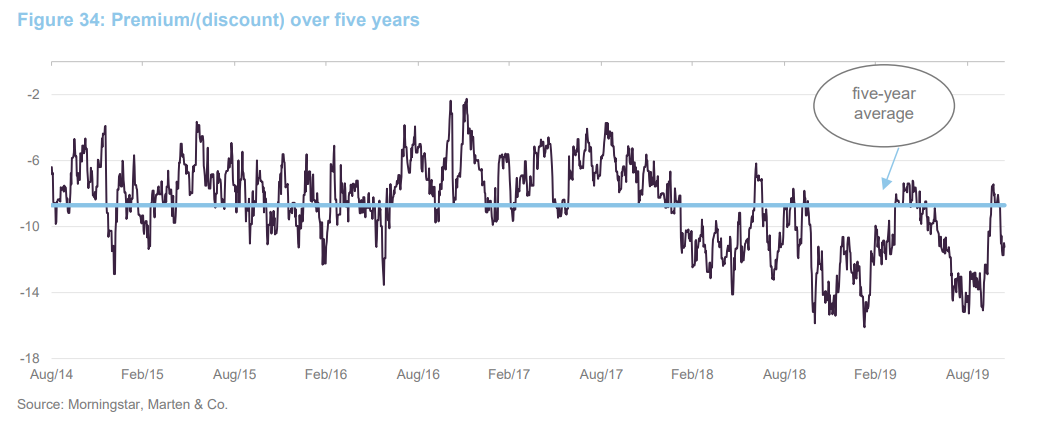
On a longer-term basis, AFMC has mostly been on a widening discount trend since shareholders voted in March 2017 to shift the trust from a fund of funds mandate to direct investing (see the Fund profile section). This likely reflects some shareholders’ frustration with AFMC’s relative performance.
Performance-driven exit opportunity
Shareholders approved the adoption of a new discount control policy in October 2018. Discount triggered tenders or other discount control mechanisms will no longer be pursued. Instead, if AFMC’s share price total return for the period from 1 July 2018 to 30 June 2020 does not exceed the total return in sterling of the FM index, shareholders will be given the opportunity to fully exit their investment in the company. Shareholders could then opt to exchange the shares for cash at the prevailing NAV less applicable direct costs (including any realisation costs of underlying investments).
The board also intends to seek annual renewal of the usual authority to buy back shares in the market. It will buy back shares where it believes it is in the best interests of shareholders to do so.
Fees and costs
The manager is entitled to a base management fee at the rate of 1.0% per annum of the NAV, payable monthly in arrears. There is no performance fee. The management agreement is terminable by either party giving to the other not less than six months’ written notice.
Vistra Fund Services (Guernsey) Limited is the administrator and secretary to the company. PraxisIFM Fund Services (UK) Limited has been appointed by Vistra to act as the UK administration agent. Vistra receives a fee at a rate of £30,000 per annum, plus a monthly fee equal to one twelfth of £20,675 plus 0.075% of the net assets subject to a current monthly minimum fee of £5,500. With effect from July 2017, AFMC has agreed to pay a fee to Aberdeen Asset Managers Limited for the provision of promotional activities. The annual fee over the financial year to June 2019 was £22,000, down from £26,000 the year before.
The company’s ongoing charges for the year ended 30 June 2019 were 2.0%. AFMC allocates management fees and finance costs as follows: 66.6% to capital and 33.3% to revenue. The board previously noted that it had secured an agreement from the manager to limit the company’s ongoing charge ratio (OCR) to no more than 2% when calculated annually as at 30 June. Should the 2% threshold be breached, the manager will rebate an equal amount of its management fee to the company. However, any rebate should not represent more than one third of the annual management fee payable for the relevant year.
Capital structure and life
AFMC has a simple capital structure with one class of ordinary share in issue. Its ordinary shares are listed on the AIM segment of the London Stock Exchange and, as at 30 September 2019 there were 71,910,117 in issue with 1,302,500 held in treasury.
No loan facility over the last financial year
AFMC is permitted to borrow; borrowings, for investment purposes, are limited to 10% of net assets at the time of drawdown. The trust is not leveraged at present and did not have a loan facility during the year to 30 June 2019.
AFMC is permitted to use an overdraft or another short-term borrowing facility to meet its working capital needs. This was most recently used between 24 May and 14 June 2019, through a $600,000 facility with Northern Trust Limited.
Major shareholders
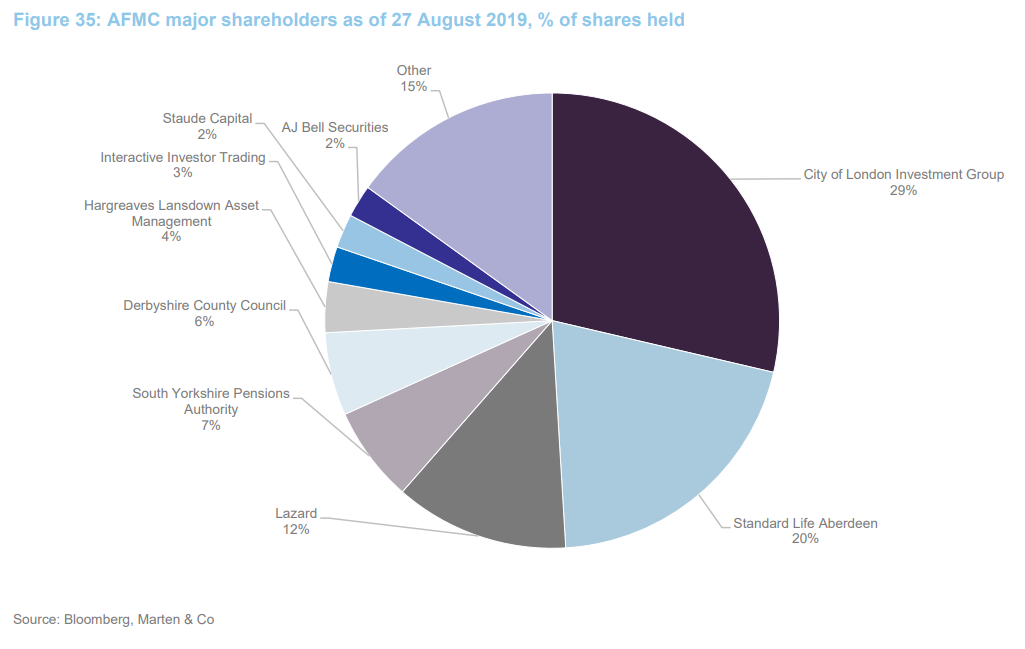
Figure 35 shows AFMC’s major shareholders, at 27 August 2019.
Financial calendar
The company’s year-end is 30 June. The company’s annual results are usually released in September (interims in February) and its AGMs are usually held in December of each year. The company makes semi-annual dividend payments. It is anticipated that an interim dividend will be paid in June and a final dividend paid in December of each year.
Board
The board comprises three non-executive directors, all of whom are deemed independent of the investment manager. A fourth director retired on 31 March 2017 and the board decided that, given the size of the company, he would not be replaced. The board considers that, collectively, the current directors demonstrate a breadth and depth of skills and experience required to steward the company.
The company’s articles of association require that one-third of the directors put themselves forward for re-election, on an annual basis, and that all directors automatically stand for election at the first AGM following their appointment.
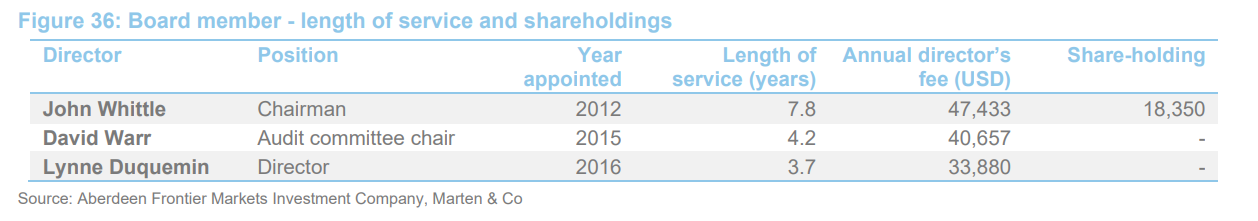
John Whittle (chairman)
John Whittle was appointed to the board on 1 February 2012. Some of his professional career highlights include his time at Close Fund Services, where he was finance director. He successfully initiated a restructuring of client financial reporting services and was a key member of the business transition team. John also spent time at PriceWaterhouse before taking his career in the direction of business services, where he was mainly involved in telecoms. He was a co-lead in the turnaround of Talkland International (now Vodafone Retail). John is a Fellow of the Institute of Chartered Accountants and holds the IOD Diploma in Company Direction. He also holds the role of executive director for a number of offshore investment funds and other companies.
David Warr (audit committee chair)
David Warr is the second-longest-serving member of the board after John; he was appointed on 9 September 2015. Following his appointment as a partner at Reads & Co, a Guernsey-based firm of chartered accountants. David helped grow the firm into a more broad-based financial services business, until its sale in 1998. He is also a Fellow of the Institute of Chartered Accountants and serves as a non-executive director for a number of UK-listed entities.
Lynne Duquemin (director)
Lynne Duquemin has served as independent director for three and a half years; she has over 30 years of investment experience, with a particular focus on investment management and advisory services. Lynne is a member of the CFA Society of the UK and holds the ASIP qualification, and has also completed the IOD Company Direction Programme, passing both the Certificate and Diploma examinations. Lynne is currently a director at Asset Risk Consultants Limited, which provides investment consulting, manager research and performance reporting to private clients, charities, family offices, professional trustees and their trusted advisers.
Previous research
Readers interested in further information about AFMC may wish to read our previous notes, which are summarised below:
- Long-term growth opportunity? – Initiation – 10 November 2016
- Direct investing – Update – 6 March 2017
- No closet-tracker – Annual overview – 26 March 2018
- Incentivised to perform – Update – 29 November 2018
The legal bit
This marketing communication has been prepared for Aberdeen Frontier Markets Investment Company Limited by Marten & Co (which is authorised and regulated by the Financial Conduct Authority) and is non-independent research as defined under Article 36 of the Commission Delegated Regulation (EU) 2017/565 of 25 April 2016 supplementing the Markets in Financial Instruments Directive (MIFID). It is intended for use by investment professionals as defined in article 19 (5) of the Financial Services Act 2000 (Financial Promotion) Order 2005. Marten & Co is not authorised to give advice to retail clients and if you are not a professional investor, or in any other way are prohibited or restricted from receiving this information you should disregard it. The note does not have regard to the specific investment objectives, financial situation and needs of any specific person who may receive it.
The note has not been prepared in accordance with legal requirements designed to promote the independence of investment research and as such is considered to be a marketing communication. The analysts who prepared this note are not constrained from dealing ahead of it but, in practice and in accordance with our internal code of good conduct, will refrain from doing so. Nevertheless, they may have an interest in any of the securities mentioned in this note.
This note has been compiled from publicly available information. This note is not directed at any person in any jurisdiction where (by reason of that person’s nationality, residence or otherwise) the publication or availability of this note is prohibited.
Accuracy of Content: Whilst Marten & Co uses reasonable efforts to obtain information from sources which we believe to be reliable and to ensure that the information in this note is up to date and accurate, we make no representation or warranty that the information contained in this note is accurate, reliable or complete. The information contained in this note is provided by Marten & Co for personal use and information purposes generally. You are solely liable for any use you may make of this information. The information is inherently subject to change without notice and may become outdated. You, therefore, should verify any information obtained from this note before you use it.
No Advice: Nothing contained in this note constitutes or should be construed to constitute investment, legal, tax or other advice.
No Representation or Warranty: No representation, warranty or guarantee of any kind, express or implied is given by Marten & Co in respect of any information contained on this note.
Exclusion of Liability: To the fullest extent allowed by law, Marten & Co shall not be liable for any direct or indirect losses, damages, costs or expenses incurred or suffered by you arising out or in connection with the access to, use of or reliance on any information contained on this note. In no circumstance shall Marten & Co and its employees have any liability for consequential or special damages.
Governing Law and Jurisdiction: These terms and conditions and all matters connected with them, are governed by the laws of England and Wales and shall be subject to the exclusive jurisdiction of the English courts. If you access this note from outside the UK, you are responsible for ensuring compliance with any local laws relating to access.
No information contained in this note shall form the basis of, or be relied upon in connection with, any offer or commitment whatsoever in any jurisdiction.
Investment Performance Information: Please remember that past performance is not necessarily a guide to the future and that the value of shares and the income from them can go down as well as up. Exchange rates may also cause the value of underlying overseas investments to go down as well as up. Marten & Co may write on companies that use gearing in a number of forms that can increase volatility and, in some cases, to a complete loss of an investment.