
 The rewards of long-term thinking
The CG Asset Management (CGAM) team’s focus on medium-to-long-term absolute returns and excellent track record have attracted a loyal following of investors. Both Capital Gearing Trust and CG Absolute Return Fund have seen significant inflows since we published our initiation note in September 2018, and CG Absolute Return now has a three-year track record, which is often a prerequisite for professional investors considering allocating money to a fund.
This note updates on progress over the past nine months with respect to:
- CGAM’s business;
- developments within the macroeconomic environment; and
- two of its absolute return funds:
- Capital Gearing Trust and
- CG Absolute Return Fund.
Turning £1 into £200
Since 1982, when Peter Spiller, CGAM’s chief investment officer, assumed responsibility for Capital Gearing Trust, it has been the best-performing of all conventional investment companies. Capital Gearing Trust’s success has allowed CGAM to launch a number of open-ended, UCITS funds. One of these, CG Absolute Return Fund, has many of the same characteristics as Capital Gearing Trust, offers a liquid way of accessing CGAM’s absolute return strategy and, unlike some of the other funds in CGAM’s stable, is open to new investors.
Excellent long-term returns
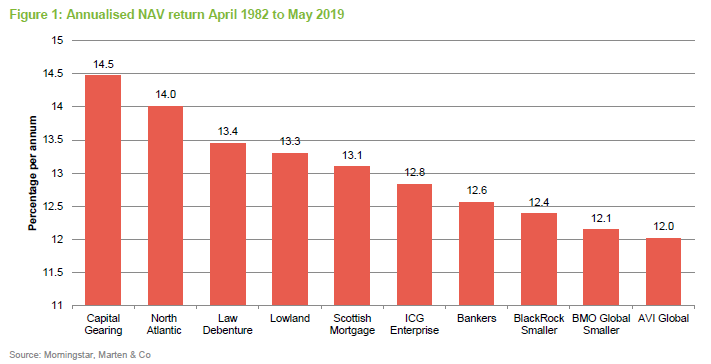
Figure 1 shows the average NAV return per year of the 10 best-performing conventional investment trusts since April 1982 (when Peter Spiller took on the management of CGT’s portfolio). The chart excludes Rights & Issues, which beats even Capital Gearing but was helped along the way by a split capital structure (which amplified its underlying performance). Law Debenture was excluded from the equivalent chart in our initiation note because of an error in the data, but is restored to its third-place position.
Defensive in falling markets
CGAM’s absolute return strategy (as evidenced by the performance of Capital Gearing Trust) can demonstrate a strong track record of preserving investors’ capital in falling markets.
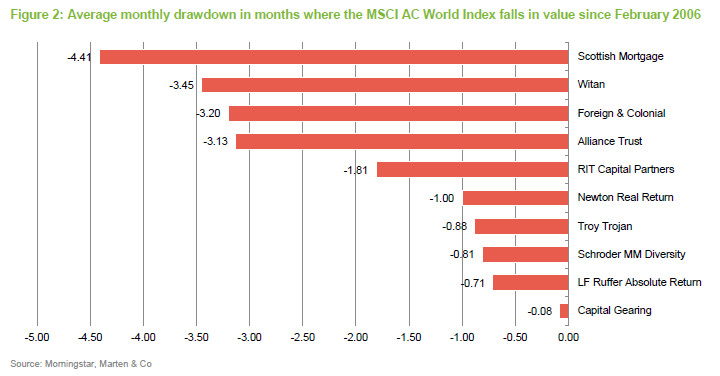
Figure 2 shows how various funds perform, on average, in months where world equity markets (as represented by the MSCI All Countries World Index in Sterling) are falling. When compared to a peer group of large global investment trusts and well-known open-ended funds with an absolute return objective, Capital Gearing Trust (CGT) is by far the most defensive.
CGAM’s investment approach was described in QuotedData’s initiation note, and readers who are unfamiliar with it may wish to refer to page 5 of that note. Similarly, the initiation note laid out CGAM’s thinking on markets in some detail. However, to recap:
Sun setting on decade-long expansion
The distortive effect of quantitative easing has contributed to an environment where prospective returns for almost all asset classes are poor, both relative to history and in absolute terms. The managers believe that the right approach in this scenario is to lock in these poor returns for as short a time period as possible and maintain an underweight exposure to assets such as equities whose value is based on their long-term prospects.
However, CGAM are not ‘permabears’, stuck in a groove of always being pessimistic. When return prospects improve, the substantial liquid investments within the portfolios of funds such as CGT and CG Absolute Return will be redeployed into risk assets (assets that are not low risk but have higher return prospects such as equities). The timing of such a move is impossible to predict. Across the globe, overall levels of debt are excessive and valuations are stretched. In the midst of a trade war, slowing growth in China cannot be countered by weakening China’s currency and boosting its exports. Geopolitical and financial candidates abound for the catalyst that will spark a crisis, but the managers will not pick one.
The managers feel that US Treasury Inflation Protected Securities (TIPS), the American equivalent of index-linked gilts, offer unusual value relative to other asset classes – real (adjusted for inflation) yields of between 0.3% and 0.8%, as compared to negative real yields in European and Japanese index-linked markets. The managers’ central case is that, when faced with the prospect of a recession, the US central bank will seek to re-inflate the economy and, in that scenario, they expect to see a capital gain from TIPS.
We saw some evidence of this theory in practice at the end of 2018. In the fourth quarter of 2018, as worries built about the impact of a US/China trade war on global growth, investors became progressively more risk-averse. The US central bank, the Federal Reserve (The Fed), which had been talking about rate rises and a reversal of quantitative easing, pivoted abruptly and declared that there would be no more rate rises in 2019. Markets have rebounded in 2019, although comments from President Trump have occasionally rekindled fears of a more significant disruption to world trade.
In the managers’ eyes, the US economy appears to be robust and it is unclear that the next move will be a US interest rate cut (as the market is now pricing in). We may be late in the economic cycle, but if you use the analogy of day turning to night, the managers are unsure whether we are in the afternoon or at dusk.
Asset allocation
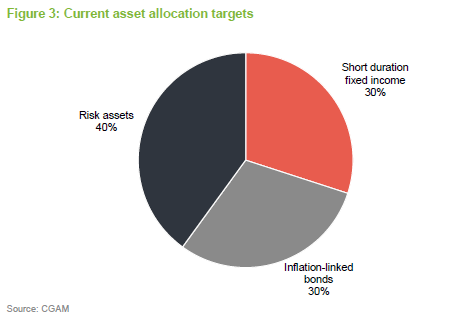
Given the views outlined above, the managers believe an optimum asset allocation should include elements of short-duration fixed-interest securities, longer-duration inflation-linked bonds and a selection of risk assets with defensive qualities.
When the Fed was sounding increasingly hawkish (ready to raise interest rates and reverse quantitative easing) in Autumn 2018, the managers took advantage of weak pricing to lengthen the duration of the TIPS portfolio from six and a half years to about nine years.
As markets retreated towards the end of 2018, it was also possible to identify some attractive investments for the risk assets portfolio and the managers would still consider adding to some of these positions on weakness. In the UK, investment trust discounts are on average narrower relative to history. The managers say that, where they wish to allocate part of the risk assets portfolio to a particular area, but that no suitable discount opportunities are available, they will use exchange-traded funds (ETFs) in preference to closed-end funds.
Assets under management
CGAM manages £1.93bn across six funds; four have an absolute return objective and two invest solely in index-linked securities issued by governments.
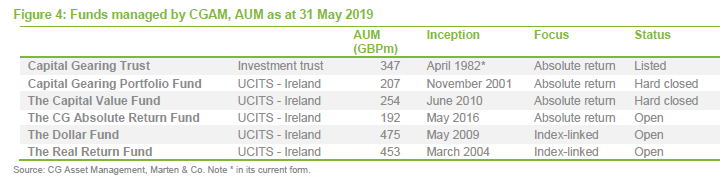
CGAM has at times made sizeable allocations to index-linked securities within its absolute return funds. A group of investors asked it to create funds dedicated to this strategy, for lack of suitable alternatives. This led to the creation of The Real Return Fund in 2004 and The Dollar Fund in 2009. An international hedged version of the Dollar Fund was launched in August 2016.
The Real Return fund recently reopened to new investors. Capital Gearing Trust and CG Absolute Return Fund are the only ways that new investors can gain access to CGAM’s absolute return strategy and we have provided an update on the positioning and performance of these funds in the following pages.
Capital Gearing Trust
A remarkable achievement
Peter Spiller has been an integral part of the management team for Capital Gearing Trust (CGT) since April 1982. Over that period, the trust’s share price has risen two hundredfold (from 21.25p to over £42.50), which is a remarkable achievement. We believe only one other trust, Rights & Issues, can match this and for a considerable period that trust’s capital appreciation was amplified by a split capital structure. Investors are recognising the attractions of the fund; there were 37% more shares in issue at the end of CGT’s financial year on 5 April 2019 than a year earlier. The shares are being issued at a premium to NAV, benefitting existing investors. Reflecting the additional impact of NAV growth over that period, the trust’s market capitalisation increased by 46%. The trust’s portfolio is relatively liquid, allowing the trust to grow without compromising the investment approach. One benefit of a growing fund is a falling ongoing charges ratio. This dropped to 0.7% for the 2018/19 financial year from 0.77% a year earlier.
Medium to longer term absolute total returns
CGT’s dual objectives are to preserve shareholders’ real wealth and to achieve an absolute total return over the medium to longer term.
It aims to achieve its investment objectives through long-only investment in quoted closed-ended funds and other collective investment vehicles, bonds, commodities and cash, as considered appropriate.
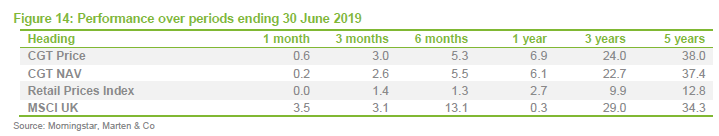
| wdt_ID | Year ended | Share price total return (%) | NAV total return (%) | RPI (%) | MSCI UK total return (%) |
|---|---|---|---|---|---|
| 1 | 30 Jun 2015 | 3.10 | 3.80 | 1.00 | 1.80 |
| 2 | 30 Jun 2016 | 8.00 | 7.90 | 1.60 | 2.20 |
| 3 | 30 Jun 2017 | 12.60 | 11.40 | 3.50 | 17.80 |
| 4 | 30 Jun 2018 | 3.00 | 3.70 | 3.40 | 9.20 |
| 5 | 30 Jun 2019 | 6.90 | 6.10 | 2.70 | 0.30 |
Readers who are unfamiliar with Capital Gearing Trust may be interested to read our initiation note, published in September 2018, which describes aspects such as the investment approach, fees, and capital structure.
Portfolio positioning
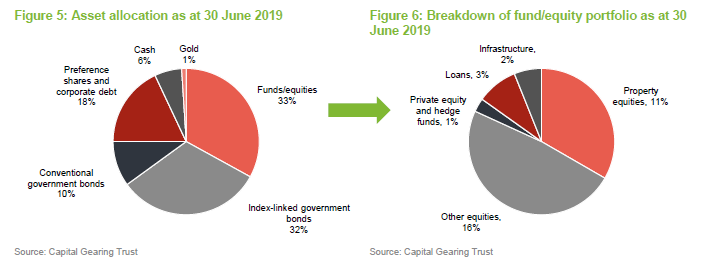
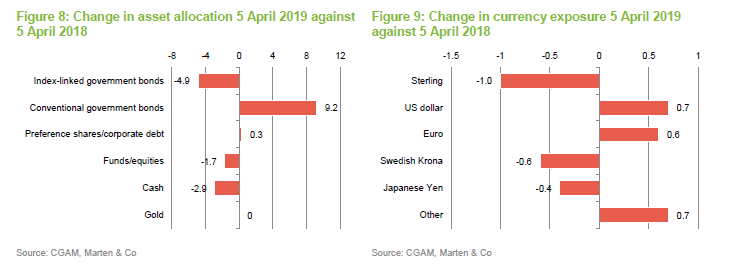
Figure 5 shows that CGT had 32% of its portfolio in index-linked government bonds as at 30 June 2019, reflecting the managers’ view that this asset class offers the prospect of exceptional risk-adjusted returns. Nevertheless, the proportion of the portfolio exposed to sterling conventional government bonds was markedly higher at the end of the 2018/2019 financial year than it was at the beginning, and the exposure to sterling and Swedish index-linked bonds had fallen somewhat.
The 33% invested in funds and equities comprises 27% exposure to equities (including a 11% allocation to property stocks), which remains at the low end of exposure when compared to competing funds (see page 12). The exposure to property is biased towards alternative property classes such as residential property and does not represent conventional UK office or retail exposure (areas that have been out of favour with investors).
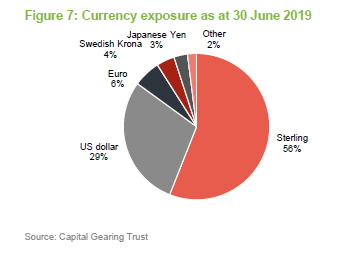
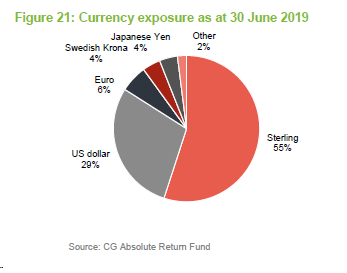
CGT retains its bias to sterling. As Figure 9 shows, CGT’s currency exposures did not alter much over its last financial year.
Largest holdings
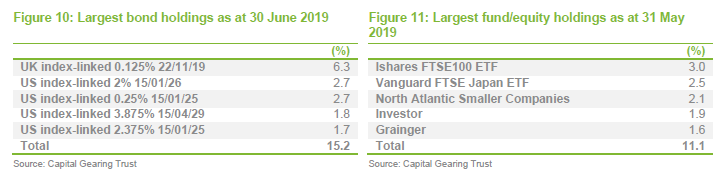
The constituents of the tables in Figures 10 are unchanged from when we last wrote on CGT. In Figure 10, German residential property companies, Vonovia and Deutsche Wohnen, which were discussed in our initiation note, have been replaced by Ishares FTSE100 ETF (tracking the UK market) and Grainger (a UK residential property company). Political resistance to rising rents in Germany meant that the managers did not expect rents to rise much faster than inflation from here, even though wages are increasing. The stocks are trading on attractive levels of dividend yield relative to German fixed income assets. Nevertheless, given the constraint to rental growth, the decision was taken to reduce these holdings.
Investor is a Swedish conglomerate with interests in business ranging from Electrolux to Astra Zeneca. It entered the portfolio shortly before we wrote our initiation note. Concerns about global trade have been weighing on Investor’s share price, given its investments in a number of leading exporters. Sweden, with its relatively open economy, has seen its currency slide (the managers think it is attractively valued relative to the Euro). CGAM acknowledges that it can do little to influence the substantial discount at which Investor’s shares trade relative to its net asset value, the investment is not predicated on a narrowing discount.
North Atlantic Smaller Companies (NAS), like Oryx International Growth (which CGT also holds), is managed by veteran investor Christopher Mills, who has been running the fund since August 1984. NAS trades on one of the widest discounts to NAV of any investment company, especially given its strong long-term performance record (second only to Capital Gearing since 1982 – see page 2) and significant cash/near cash.
One recent addition to the portfolio has been Pershing Square, the US hedge fund managed by Bill Ackman. The fund trades on a wide discount, despite much improved performance in 2019.
Performance
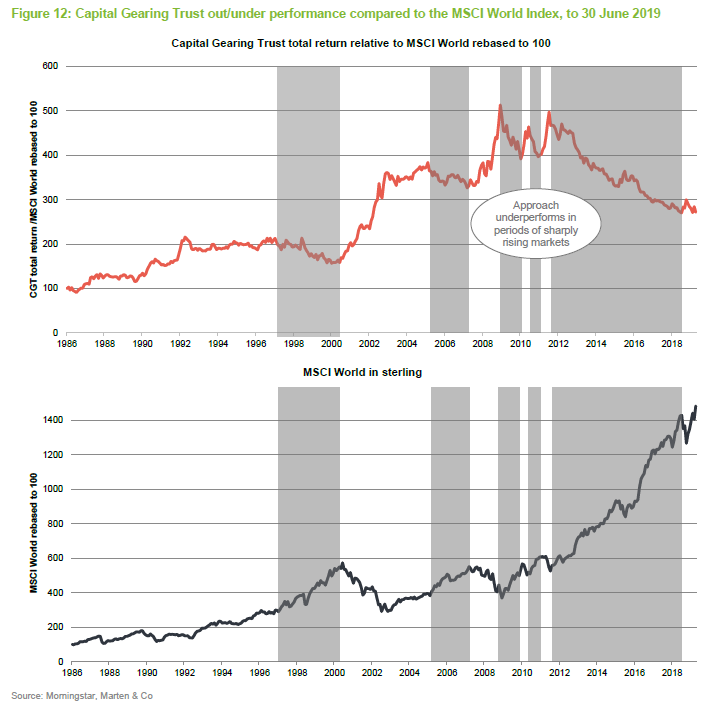
A version of Figure 12 was used in our initiation note. It demonstrates that CGT does have a tendency to underperform strong markets but holds up well in downturns. The long-term record is undimmed; CGT has outperformed equities, as represented by the MSCI World Index in sterling terms, by a considerable margin (2.7x) since that index was created in 1986.
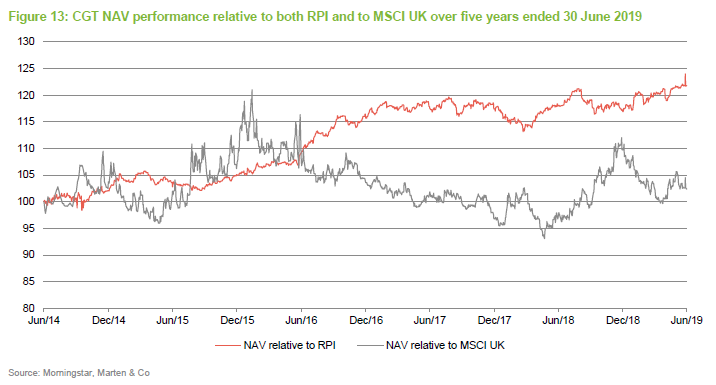
Over the short term (five years), as Figure 13 shows, CGT’s NAV has exceeded both UK inflation, as measured by RPI, and UK equity returns, as measured by the MSCI UK Index.
The UK market was weak in the second half of 2018 as Brexit uncertainties and the US/China trade war weighed on sentiment. That trend reversed in 2019, partly on the back of the policy reversal by the US Federal Reserve. Hopes also grew that the trade war might be resolved. While tweets from President Trump raised fears of a renewed trade dispute with Mexico, recent warm words between China and the US at the G20 summit have pushed markets higher.
Performance attribution
CGAM has kindly supplied us with some performance attribution data covering CGT’s financial year to 5 April 2019. Over that period:
- the index-linked loan portfolio added 2.76% to the NAV with US TIPS contributing the majority of this; and
- the risk asset portfolio contributed 3.44% to the NAV with notable positive contributions from Vonovia (0.49%), Castellum (0.39%), Investor AB (0.28%), North Atlantic Smaller Companies (0.23%) and The Renewable Infrastructure Group (0.20%). These were offset by negative contributions from CatCo Reinsurance Opportunities (0.31%) and Ground Rents Income (0.15%).
Some of these we have discussed earlier. Of the others:
- Castellum is a Swedish property company with a portfolio valued at SEK89.2bn (at 31 March 2019) dominated by offices, public sector properties and warehouses and logistics assets. Its EPRA triple-net NAV was 19.6% higher at 31 March 2019 than a year earlier, as demand for offices outstripped supply.
- The Renewables Infrastructure Group has a portfolio of wind and solar assets. On Morningstar’s numbers it is the best-performing of the London-listed renewables infrastructure funds over the past year. It has also benefitted from a rising premium.
- CatCo Reinsurance Opportunities’ NAV was devastated by a cluster of significant natural disasters, including hurricanes and wildfires, against which it was providing reinsurance.
- Ground Rents Income has fallen in the wake of adverse publicity about the leasing model in the UK and the loss of a court case in relation to the responsibility for remedying problems with the façade of a tower in Manchester.
Peer group
The AIC’s flexible investment sector now has 19 members. These encompass a wide range of objectives and investment styles. CGT believes its closest listed peers are probably Personal Assets (PNL) and Ruffer Investment Company (RICA), but in Figures 15 and 16 below, we have also included RIT Capital Partners (RCP), which aims to deliver long-term capital growth while preserving shareholders’ capital, and Aberdeen Diversified Income & Growth (ADIG), JP Morgan Multi-Asset Trust (MATE) and Seneca Global Income & Growth (SIGT), all of which have objectives of delivering absolute returns with low volatility, but which place greater emphasis on the provision of income, impacting their asset allocation decisions.
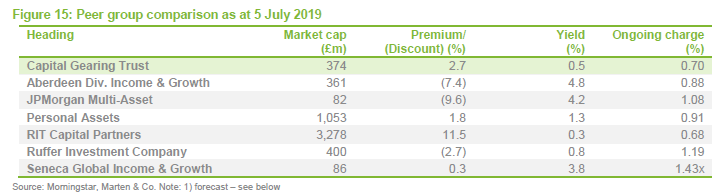
There has been some discount widening in the peer group since we last wrote, but CGT maintains its popularity with investors. As CGT expands, its ongoing charge ratio is trending down towards the lowest of the peer group.
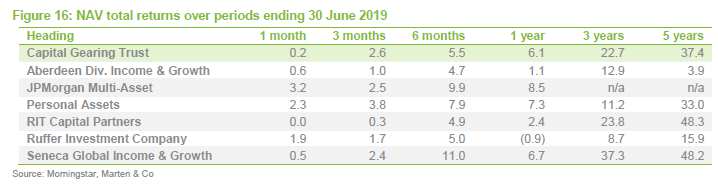
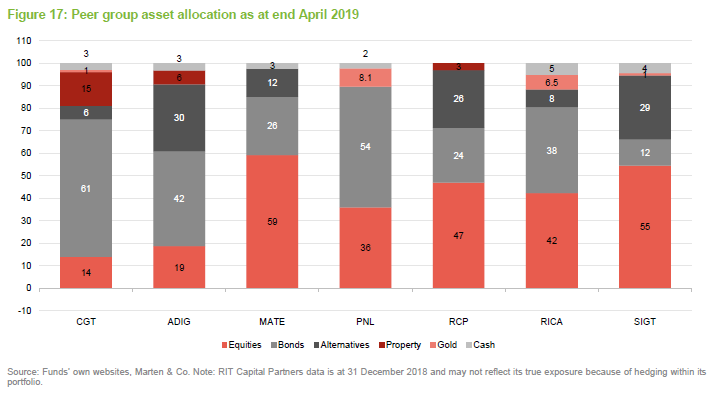
The disparity between the performances of the various funds in the peer group shown in Figure 16 can be attributed largely to their asset allocation. We have attempted to compare this in Figure 17. This is an inexact comparison, however, as there are substantial differences in the way that the various funds break down their portfolios.
What is clear from Figure 17 is that CGT still has the lowest allocation to equities of any fund in this peer group. Our analysis showed that it also had the highest allocation to index-linked bonds. CGT’s allocation to property looks to be higher than any other fund in this group. It might be worth noting, however, that some part of these fund’s equity allocation relates to property stocks and CGT’s property exposure is not to mainstream commercial property.
Premium
Over CGT’s life, it has often traded at a premium to NAV as is illustrated in Figure 17. In the board’s view, that premium on occasion became excessive. The managers have the view that investors in closed-ended funds should be able to turn their investment into cash at regular intervals at levels close to NAV. Where the underlying portfolio is liquid, they prefer that the fund offers a ‘zero discount mechanism’ (ZDM). For a less liquid portfolio, they would advocate periodic liquidity opportunities such as tender offers or redemption pools. The board believes that CGT’s portfolio is liquid enough to support a ZDM, and implemented one with effect from 31 July 2015 (coincidental with the appointment of Personal Assets Trust Administration Company Limited as the manager of the ZDM).
CGT’s policy is to issue shares at a small premium to NAV and redeem them at a small discount, thereby ensuring that ongoing shareholders are not disadvantaged by the costs of implementing the ZDM.
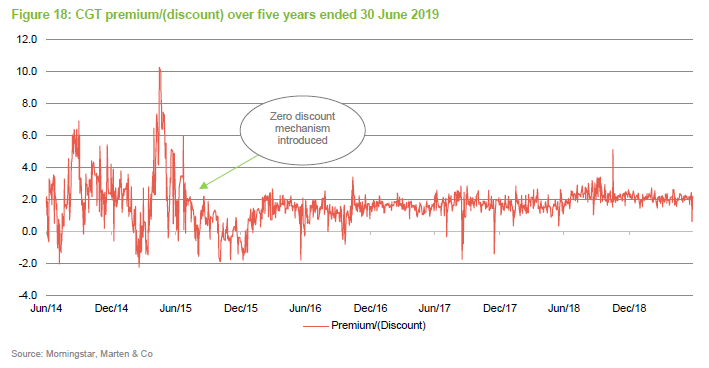
The reduction in the volatility of CGT’s premium after the introduction of the ZDM is clear in Figure 18. Over the year ended 30 June 2019, CGT’s shares have traded within a range of a 0.6% premium to a 5.1% premium (on an occasion in November when the share price spiked upwards for no good reason). As at 5 July 2019, the shares were trading at a premium of 2.7%.
Fund profile
Capital Gearing Trust (CGT) was incorporated in May 1963 and listed on the London Stock Exchange on 14 February 1973. Peter Spiller has been managing the trust since 1982 and has therefore been responsible for CGT’s excellent long-term performance record, described on page 2. CGAM’s founders and its other employees have substantial personal investments in the funds that it manages, and Peter Spiller is one of the largest shareholders in CGT. Since 2011, he has been assisted by Alastair Laing. Chris Clothier joined the team in 2015.
CGT’s dual objectives are to preserve shareholders’ real wealth and to achieve an absolute total return over the medium to longer term. It aims to achieve its investment objectives through a long-only, multi-asset portfolio of quoted closed-ended funds and other collective investment vehicles, bonds, commodities and cash. The generation of capital gains is prioritised over income.
Previous publications
Readers may be interested in our initiation note, Focus on absolute returns, published in September 2018. Please click the link above or visit our website.
CG Absolute Return Fund
Fulfilling its brief
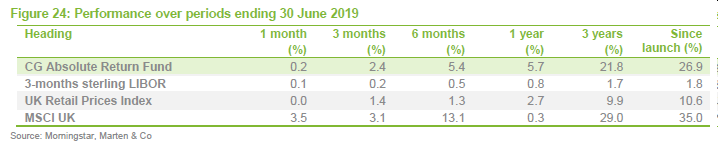
Since its launch in May 2016, CG Absolute Return has delivered returns well ahead of inflation and of competing open-ended funds (see page 18). It has even managed to outperform Capital Gearing Trust by a small margin since launch and now has a three-year performance track record. The open-ended fund returned 21.8% over the three years to the end of June 2019, compared to 22.7% for the trust.
The fund’s track record is attracting investors and the fund has been expanding – more than doubling in size over the past year. The underlying investments are liquid, however, and the manager believes the fund could be a multiple of its current size without compromising on potential returns.
Long-term capital growth in absolute terms
CG Absolute Return Fund’s investment objective is to achieve long-term capital growth in absolute terms.
It attempts to achieve this by investing in a spread of direct equities, exchange traded funds (ETFs), open-ended funds, closed-ended funds, and government and corporate bonds, including index-linked bonds – all listed on a recognised exchange.
Investment trusts and investment companies are used to obtain exposure to global and domestic equity markets, real estate, infrastructure, commodities and precious metals.
| wdt_ID | Year ended | Price total return (%) | 3-month Libor (%) | RPI (%) | MSCI UK total return (%) |
|---|---|---|---|---|---|
| 1 | 30 Jun 2017 | 10.80 | 0.40 | 3.50 | 17.80 |
| 2 | 30 Jun 2018 | 4.00 | 0.40 | 3.40 | 9.20 |
| 3 | 30 Jun 2019 | 5.70 | 0.80 | 2.70 | 0.30 |
Portfolio positioning
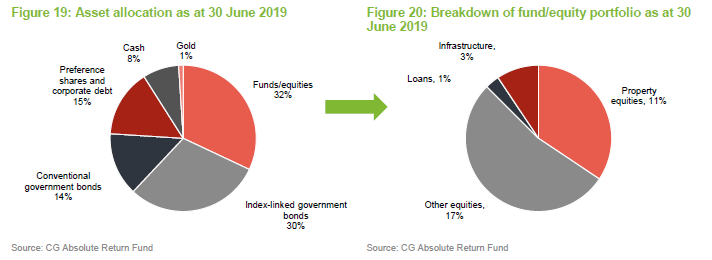
Figure 19 shows that CG Absolute Return Fund had 30% of its portfolio in index-linked government bonds as at 30 June 2019, reflecting the managers’ view that this asset class offers the prospect of exceptional risk-adjusted returns. Nevertheless, the proportion of the portfolio exposed to sterling conventional government bonds was markedly higher at the end of the 2018/2019 financial year than it was at the beginning and the exposure to sterling and Swedish index-linked bonds had fallen somewhat.
The 32% invested in funds and equities comprises 28% exposure to equities (including an 11% allocation to property stocks). The exposure to property is biased towards alternative property classes, notably residential property, and does not represent conventional UK office or retail exposure (areas that have been out of favour with investors).
Largest holdings
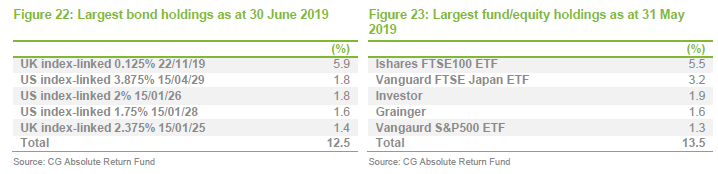
Consistent with the manager’s long-term approach to investment, the constituents of the table in Figure 22 little changed from when we last wrote on CG Absolute Return Fund. In Figure 23, German residential property companies, Vonovia and Deutsche Wohnen, which were discussed in our initiation note, have been replaced by Grainger (a UK residential property company) and a US index-tracking fund. Political resistance to rising rents in Germany meant that the managers did not expect rents to rise much faster than inflation from here, even though wages are increasing. The stocks are trading on attractive levels of dividend yield and the managers believe that the Euro may be undervalued. Nevertheless, the decision was taken to reduce these holdings.
Investor is a Swedish conglomerate with interests in business ranging from Electrolux to Astra Zeneca. It entered the portfolio shortly before we wrote our initiation note. Concerns about global trade have been weighing on Investor’s share price, given its investments in a number of leading exporters. Sweden, with its relatively open economy, has seen its currency slide (the managers think it is attractively valued relative to the Euro). CGAM acknowledges that it can do little to influence the substantial discount at which Investor’s shares trade relative to its net asset value; the investment is not predicated on a narrowing discount.
Performance
CG Absolute Return Fund now has a three-year track record and, as is evident from Figure 24, it has delivered returns well ahead of both its benchmark and inflation. Against equity markets, here represented by the MSCI UK Index, it has lagged by a small margin. This reflects the managers’ cautious stance in the face of high valuations. They are confident that their stance will be rewarded in the long term.
The UK market was weak in the second half of 2018 as Brexit uncertainties and the US/China trade war weighed on sentiment. That trend reversed in 2019, partly on the back of the policy reversal by the US Federal Reserve. Hopes also grew that the trade war might be resolved. While tweets from President Trump raised fears of a renewed trade dispute with Mexico, recent warm words between China and the US at the G20 summit have pushed markets higher.
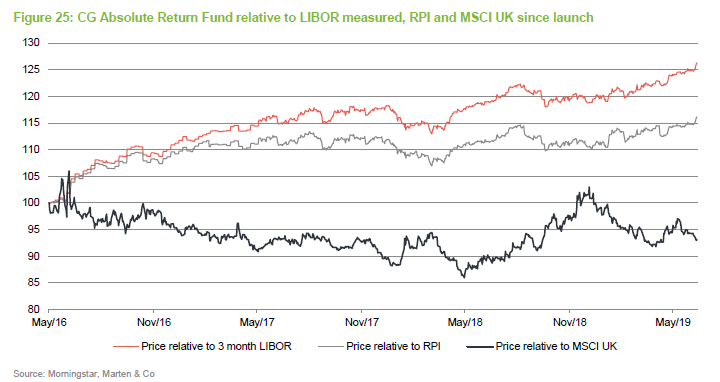
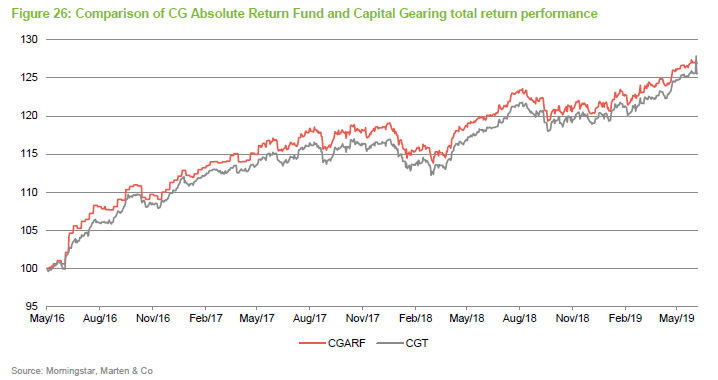
Figure 26 shows CG Absolute Return’s performance side-by-side with that of Capital Gearing Trust. Since the launch of the open-ended fund, it has outperformed the investment trust by more than 1%, while tracking it fairly closely.
CG Absolute Return has similar asset allocation but does not have exactly the same exposures to investment companies as the trust does, and this accounts for most of the difference in performance.
Performance attribution
CGAM has kindly supplied us with some performance attribution data covering CG Absolute Return Fund’s performance over the year to 15 May 2019. Over that period:
- the index-linked loan portfolio added 2.77% to the NAV with US TIPS contributing the majority of this; and
- the risk asset portfolio contributed 3.18% to the NAV with notable positive contributions from Vonovia (0.50%), Castellum (0.37%), Investor AB (0.27%), Vanguard S&P500 ETF (0.26%), and The Renewable Infrastructure Group (0.20%). These were offset by negative contributions from CatCo Reinsurance Opportunities (0.29%), Vanguard FTSE Japan ETF (0.15%) and Ground Rents Income (0.12%).
Some of these we have discussed earlier. Of the others:
- Castellum is a Swedish property company with a portfolio valued at SEK89.2bn (at 31 March 2019) dominated by offices, public sector properties and warehouses and logistics assets. Its EPRA triple-net NAV was 19.6% higher at 31 March than a year earlier as demand for offices outstripped supply.
- The Renewables Infrastructure Group has a portfolio of wind and solar assets. On Morningstar’s numbers it is the best-performing of the London-listed renewables infrastructure funds over the past year. It has also benefitted from a rising premium.
- CatCo Reinsurance Opportunities’ NAV was devastated by a cluster of significant natural disasters, including hurricanes and wildfires, against which it was providing reinsurance.
- Ground Rents Income has fallen in the wake of adverse publicity about the leasing model in the UK and the loss of a court case in relation to the responsibility for remedying problems with the façade of a tower in Manchester.
Peer group
There are many open-ended funds that target absolute returns or that operate with multi-asset portfolios. We have selected a peer group of well-known funds with similar objectives to CG Absolute Return Fund.
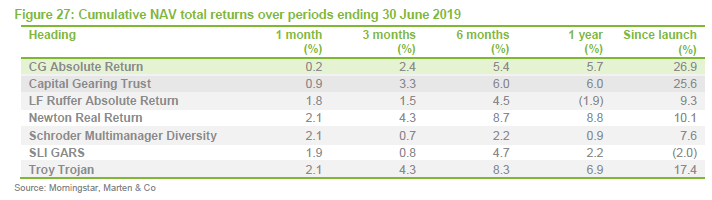
CG Absolute Return has outperformed all of these funds since it was launched, in most cases by a considerable margin.
Fund profile
CG Absolute Return Fund aims to achieve long-term capital growth in absolute terms by investing in a spread of direct equities, ETFs, open-ended funds, closed-ended funds, and government and corporate bonds, including index-linked bonds – all listed on a recognised exchange.
CG Absolute Return Fund is a UCITS fund domiciled in Ireland. CGAM acts as investment manager to the fund with the same team that manages CGAM’s other absolute return funds.
The fund was established in May 2016 as the fourth fund managed by CGAM with an absolute return objective. It is the only open-ended absolute return fund offered by CGAM that is open to new investment (see page 4).
A liquid alternative to Capital Gearing Trust
CG Absolute Return’s portfolio closely resembles that of CGAM’s flagship investment trust, Capital Gearing Trust. As we explain on page 17, over the fund’s relatively short life, it has delivered on its objectives, beaten competing funds by some margin and outperformed Capital Gearing Trust, aided by its lower fee structure.
CGAM has made modest adjustments to CG Absolute Return’s portfolio relative to Capital Gearing Trust which it believes will allow CG Absolute Return to expand to a multiple of its current size, without an adverse effect on its performance. The UCITS structure offers daily dealing. CG Absolute Return is therefore a liquid alternative to Capital Gearing Trust and, in CGAM’s opinion, an ideal core investment for most investors’ portfolios.
Previous publications
Readers may be interested in our initiation note, Focus on absolute returns, published in September 2018. Please click the link above or visit our website.
The legal bit
Marten & Co (which is authorised and regulated by the Financial Conduct Authority) was paid to produce this note on CG Asset Management.
This note is for information purposes only and is not intended to encourage the reader to deal in the security or securities mentioned within it.
Marten & Co is not authorised to give advice to retail clients. The research does not have regard to the specific investment objectives financial situation and needs of any specific person who may receive it.
The analysts who prepared this note are not constrained from dealing ahead of it but, in practice, and in accordance with our internal code of good conduct, will refrain from doing so for the period from which they first obtained the information necessary to prepare the note until one month after the note’s publication. Nevertheless, they may have an interest in any of the securities mentioned within this note.
This note has been compiled from publicly available information. This note is not directed at any person in any jurisdiction where (by reason of that person’s nationality, residence or otherwise) the publication or availability of this note is prohibited.
Accuracy of Content: Whilst Marten & Co uses reasonable efforts to obtain information from sources which we believe to be reliable and to ensure that the information in this note is up to date and accurate, we make no representation or warranty that the information contained in this note is accurate, reliable or complete. The information contained in this note is provided by Marten & Co for personal use and information purposes generally. You are solely liable for any use you may make of this information. The information is inherently subject to change without notice and may become outdated. You, therefore, should verify any information obtained from this note before you use it.
No Advice: Nothing contained in this note constitutes or should be construed to constitute investment, legal, tax or other advice.
No Representation or Warranty: No representation, warranty or guarantee of any kind, express or implied is given by Marten & Co in respect of any information contained on this note.
Exclusion of Liability: To the fullest extent allowed by law, Marten & Co shall not be liable for any direct or indirect losses, damages, costs or expenses incurred or suffered by you arising out or in connection with the access to, use of or reliance on any information contained on this note. In no circumstance shall Marten & Co and its employees have any liability for consequential or special damages.
Governing Law and Jurisdiction: These terms and conditions and all matters connected with them, are governed by the laws of England and Wales and shall be subject to the exclusive jurisdiction of the English courts. If you access this note from outside the UK, you are responsible for ensuring compliance with any local laws relating to access.
No information contained in this note shall form the basis of, or be relied upon in connection with, any offer or commitment whatsoever in any jurisdiction.
Investment Performance Information: Please remember that past performance is not necessarily a guide to the future and that the value of shares and the income from them can go down as well as up. Exchange rates may also cause the value of underlying overseas investments to go down as well as up. Marten & Co may write on companies that use gearing in a number of forms that can increase volatility and, in some cases, to a complete loss of an investment.