Penalised for being conservative?
In recent months, despite its attractive dividend yield (6.9% at the time of publication), GCP Infrastructure (GCP)’s shares moved to trade on a small discount to its net asset value, which is unusual both for funds in the infrastructure sector (where GCP sits) and the renewable energy sector, which is a better match for the majority of GCP’s portfolio. As the figures on page 18 show, even today, when GCP’s shares have recovered to trade at a small premium to asset value, it remains one of the cheapest funds in both sectors.
We believe that some investors may have been unnerved by falls in GCP’s net asset value (NAV). These falls relate to increased corporation tax rates and reductions in long-term power price estimates. These are factors that affect competing funds too, yet GCP’s rating seems to have been disproportionately and perhaps unjustly affected.
Public-sector-backed, long-term cashflows from loans used to fund UK infrastructure
GCP aims to provide shareholders with regular, sustained, long-term distributions and to preserve capital over the long term by generating exposure primarily to UK infrastructure debt and related and/or similar assets which provide regular and predictable long-term cashflows.
GCP primarily targets investments in infrastructure projects with long-term, public-sector-backed, availability-based revenues. Where possible, investments are structured to benefit from partial inflation-protection.
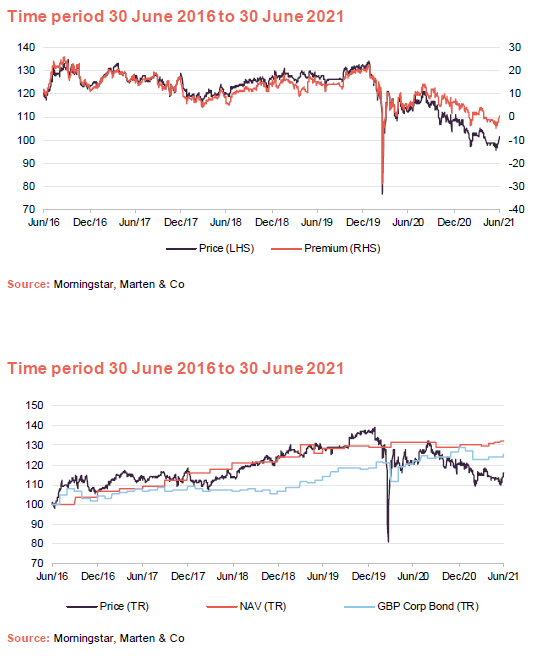
Over the year ended 30 June 2021, GCP’s shares traded on an average premium of 4.9%, with a premium high of 14.3%. However, over this period, the shares have also traded on a discount of 5.0% and at 30 June 2021, the premium was just 0.4%.
Our strong feeling is that GCP is suffering for its caution. Investors see a falling NAV and assume that GCP’s assets are underperforming peers, but the reality should be that GCP is in a stronger position than many competing funds in the renewable energy sector, in particular.
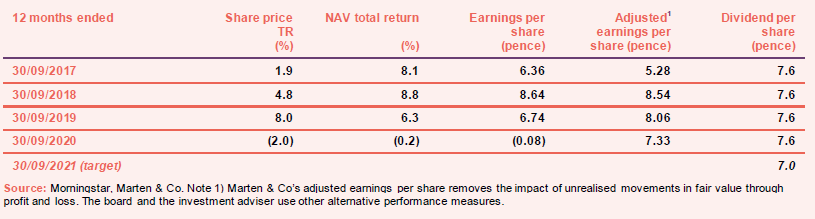
Over the six months ended 31 March 2021, GCP’s NAV fell by 3.1% to 100.78p. The NAV total return for the six-month period was 0.3%.
The reasons behind the NAV fall are more fully explored in this note, but largely they relate to changes in some of the assumptions used to value GCP’s long-term cash flows rather than operational or project-specific issues.
Results for the six-months ended 31 March 2021
Over the six months ended 31 March 2021, GCP’s NAV fell by 3.1% to 100.78p. The NAV total return for the six-month period was 0.3%. This was a continuation of a trend that has seen the NAV fall by 8.2% from 109.83p at the end of March 2020.
The fall in NAV has been accompanied by a reduction in the annual dividend from 7.6p to 7.0p. This was well-flagged by GCP’s board and discussed in our note published on 1 June 2020.
The reasons behind the NAV fall are more fully explored in this note, but largely they relate to changes in some of the assumptions used to value GCP’s long-term cash flows rather than operational or project-specific issues. Setting aside these factors, the portfolio generated operating income of £36.8m which was reduced by administration costs of £5.5m (the equivalent for the 2020 financial year – FY20 – was £5.7m) and finance costs of £1.9m (FY20 £2.5m). The dividend was well covered by cashflows from the underlying investments.
In the short term it looks as though investors may have been unnerved by the pace of GCP’s NAV fall relative to peers (we look more into the performance numbers on page 14). The share price has fallen faster than the NAV and GCP’s shares traded at a small discount to net asset value for a while. We think this is unjustified.
Other elements of the results statement to highlight are the new £165m revolving credit facility and new investments (loans advanced) of £46.4m secured against UK renewable energy, social housing and PFI projects. Again, we look into these in more detail later in the note.
A cautious approach to valuation
In calculating GCP’s NAV, alongside project-specific factors, forecasts for long-term power prices have been reduced again, and the planned increase in UK corporation tax from 2023 has been factored in as have official (Office for Budget Responsibility) changes to inflation forecasts.
Unlike GCP, its peers in the infrastructure sector (shown on page 16) have little or no exposure to renewable energy, and fluctuating power prices are not of much consequence to them. They are, however, still impacted by the changes to corporation tax and we are seeing this reflected in recent NAV announcements. Nevertheless, this is a significant reason why GCP’s returns are behind those of its infrastructure peer group.
The substantial majority of GCP’s investments are loans. Approximately, 60% of these by value are loans secured against renewable energy assets. As corporation tax rates rise and electricity prices decline, the ability of these borrowers to service their debt is reduced. If there is a risk that these borrowers may default, this needs to be factored into cashflow assumptions and valuations. It is largely this that is driving the falls in GCP’s NAV.
However, some investors have questioned why GCP’s returns appear to be behind those of comparable funds in the renewable energy sector, especially given that these funds are predominantly equity investors in power projects. Debt investors rank above equity investors in the corporate structure and where there is no longer any equity buffer and loans are impaired, any recovery in value benefits debt first. GCP’s adviser also says that, in certain cases, it targeted equity like exposures to underlying assets in order to benefit from potential future upsides.
Generally, in the renewable energy sector GCP holds subordinated debt. The adviser does not believe that the cash flow profile of GCP’s borrowers is sufficiently compromised as to trigger a default on the senior debt. If that were to be the case, the senior lender would be in control of the debt recovery process, but – as noted above – GCP would benefit from the equity cushion.
Conservative assumptions
We believe that when it calculates its NAV, essentially, GCP is adopting more conservative assumptions than these competing funds. We note that every quarterly NAV published by GCP has been signed off by an independent valuer, Mazars, as well as the independent board of directors.
Discount rates
Most importantly, it would appear that renewable energy funds are adopting the stance that, as the prices of renewable energy projects in the secondary market seem unaffected by adverse moves in long-term power price assumptions and the like, it follows that there must have been a corresponding decrease in the discount rates that the market is using to value these investments.
Whilst this stance may not be universally accepted, the recent KKR bid for John Laing, following on from 2018’s Dalmore/Equitix bid for John Laing Infrastructure, might illustrate the potential for opportunistic bids, were NAVs to become detached from secondary market prices for projects.
What happens if GCP’s borrowers run into trouble?
All of GCP’s loans are amortising, which means that the borrower must generate sufficient cashflow to service both the loan interest and capital repayments as they fall due.
The debt comes with covenants which allow GCP to step in and take control of the asset in the event of default. Reflecting what have historically been relatively predictable cash flows (helped by a high proportion of subsidy payments), debt service cover ratios are set at fairly low levels; 1.05x is common.
If GCP took control of an asset, it would be in a similar position in the capital structure as its renewable energy peers. It should follow that GCP could, if it chose to, be able to sell on the asset in the secondary market.
GCP’s adviser says that it might not automatically trigger an event of default on a loan that had breached its covenants or failed to make payments when due. It says that it would be more likely to be patient where it felt that the operator was doing a good job and where there is reasonable prospect of a recovery. Any unpaid interest would still accumulate to GCP’s benefit. GCP might opt to extend the life of the loan, provided that everything is in place to support this.
Historically, GCP took direct control of a number of anaerobic digestion plants. It retains equity ownership of three of these and says it continues to implement improvement works at these plants. The company reports that performance of these plants was positive over the six months ended 31 March 2021 and this was reflected in their valuation.
Recently, GCP restructured its loan against the Birmingham Biopower project, a 10.3 MWe waste wood biomass project in Birmingham. GCP had the project placed in administration. The asset is now under GCP’s control and the adviser is directing a programme of work to optimise plant operations and reduce costs.
Power prices
Figure 1 shows how baseload power prices have changed over the past decade.
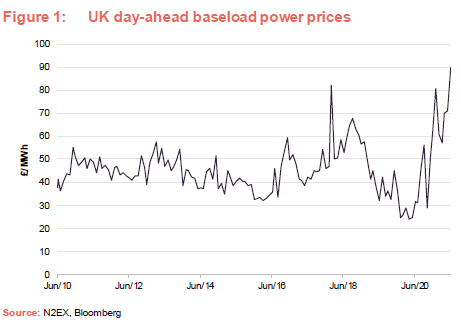
When we last published on GCP, COVID-19-related weakness in demand for power was weighing on power prices. In recent months, however, prices appear to have been trending higher, driven by increasing carbon and gas prices.
GCP’s power price forecasts come from a single independent forecaster, Afry. In the past, the rolling-average price over four quarters has been used to calculate GCP’s NAV. Going forward, the directors have opted to use published electricity futures market prices for the three-year period starting on the valuation date and then average Afry prices for periods longer than three years. Figure 2 shows how futures prices for three-year power have moved over the past year.
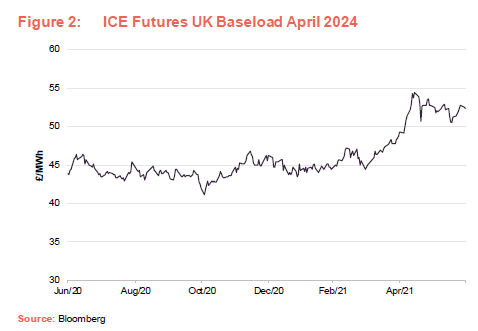
Substituting the futures prices for the baseload prices has increased GCP’s NAV, but the methodology seems reasonable to us and the investment adviser notes that, had it sourced its power price forecasts exclusively from Aurora (another independent power price forecaster favoured by many of the funds in the renewable energy sector), its end March 2021 NAV would have been 4.71p higher.
Capture prices
Figures 1 and 2 reflect changes in baseload power prices. However, where a renewable energy generator sells power in the spot market, it may not be able to obtain the baseload power price. Currently, it may often be the case that at times of peak renewable production, there is insufficient demand for the power generated. Consequently, spot prices may be considerably below baseload prices. The term ‘capture price’ describes the actual power price achieved.
GCP’s NAV calculation assumes an average capture price discount of 10% in respect of its wind projects. GCP’s adviser acknowledges that at least one competing fund is assuming a capture price discount of 15%, were it to adopt this stance, its end March NAV would be 0.78p lower. However, other competing funds are assuming no capture price discount. If GCP factored this in, its NAV would have been 1.90p higher.
If all energy produced could be stored when demand is insufficient, this problem could be solved. Addressing the UK’s deficiency in energy storage should help narrow, and in time perhaps even eliminate, the spread between capture prices and baseload prices.
We note that much of the power produced by GCP’s projects is sold under power purchase agreements (PPAs). The adviser says that many of its borrowers have been seeking to lock in the stronger power prices that have been seen more recently.
Asset lives
GCP’s NAV could benefit from life extensions for the assets it has invested in. Many of its peers have already assumed longer lives for their assets within their NAV calculations.
GCP notes that asset lives are dependent on the life of the equipment, the leases on the land and the associated planning permission. All three conditions need to be satisfied before an asset life extension can be assumed.
The adviser believes that if it could achieve asset lives of 30 years for wind projects and 40 years for solar projects, this would add 2.69p to GCP’s March 2021 NAV.
Equipment is increasingly efficient and costs per MWh of power produced are falling. In the event that older equipment could be replaced (equipping older wind farms with larger blades for example), asset values could be improved even further. At present, this is not being factored into NAVs as such a change would likely require planning permission.
Within GCP’s existing portfolio, there are also opportunities for operational enhancements. For example, GCP has been working with its wind projects to perform software and hardware upgrade works across the fleet of Vestas turbines to which it has exposure.
Taxation
In the recent UK budget, the Chancellor confirmed that, for companies with profits of more than £250,000, corporation taxes will rise from the current rate of 19% to 25% with effect from 1 April 2023.
GCP has assumed (not unreasonably we think, given the state of the UK’s finances) that the higher rate will be in effect in perpetuity. Other funds – Greencoat UK Wind, for example – have applied the higher rate for an unspecified ‘medium term’. GCP’s adviser thinks that were it to adopt a similar approach, its March 2021 NAV would be 0.99p higher.
The adviser also suspects that, for the purposes of estimating their future corporation tax liability, some competing funds are assuming that their funds are evergreen when the reality is that they hold a portfolio of projects with finite lives. It is likely that borrowings would be eliminated towards the end of a fund’s life and the interest that was offset against corporation tax would be lost, leading to a higher tax bill.
Inflation
With respect to inflation, GCP’s end March valuation uses inflation forecasts from the Office for Budget Responsibility for the short term, followed by long term assumptions of 2.5% for RPI and 2.0% for CPI. Other competing funds are assuming much higher inflation rates of 3% or more. GCP’s adviser notes that, were the NAV to factor in inflation of 3% per annum over the long term, the end March NAV would be 2.06p higher.
New areas for investment
The adviser says that it is not attracted by the returns available to GCP in the digital infrastructure market. It also doubts that new social housing investments would offer attractive rates of return given increased interest from more mainstream lenders in this market.
It seems increasingly likely that the UK government’s commitment to deliver net zero greenhouse gas emissions by 2050 will provide new opportunities for GCP. The adviser notes that the Climate Change Committee, the UK Government’s independent adviser on climate change, estimates that £50bn of investment will be required annually by 2030.
This may increase the portfolio’s exposure to renewables further. There may soon be support schemes to promote energy efficiency, decarbonise the transport sector, change the way we heat our homes and reduce industrial and agricultural emissions. The adviser also sees potential in areas such as hydrogen and carbon capture, transport and storage.
The new UK emissions trading scheme is operational (replacing the EU scheme which we left after Brexit) and the adviser says that the market is engaging in a price discovery process.
One concrete example of a new support mechanism is the new green gas support scheme.
Green gas support scheme
The non-domestic Renewable Heat Incentive (RHI), which forms part of the subsidy earned by anaerobic digestion (AD) plants, closed to new participants with effect from 31 March 2021 (the domestic scheme was extended for another year). The government has replaced this with a green gas support scheme, which is expected to become operational later this year. This new scheme will operate for five years initially.
The scheme will pay 5.5p/kWh on the first 60,000MWh of energy produced, 3.53p/kWh on the next 40,000MWh and 1.56p/kWh on the excess.
Crucially, the scheme sets a minimum of 50% of feedstock to be derived from waste, so new agricultural plants would not be eligible if they cannot meet this target. Green hydrogen plants (where hydrogen is made without using fossil fuels) would not qualify for support.
Woodland carbon guarantee scheme
We were intrigued to see a project in GCP’s pipeline which would benefit from the woodland carbon guarantee scheme. This was a £50m scheme launched in 2019 designed to encourage tree-planting in the UK. Applicants for subsidy under the scheme receive a credit related to the estimated amount of CO2 captured – woodland carbon units (WCUs) – which attract a government-guaranteed and index-linked price.
Woodland creation projects accepted into the woodland carbon guarantee have the option to sell WCUs to the government every five or 10 years up to 2055/56. Alternatively, they can be sold as carbon credits on the open market at any time.
AR4
Allocation Round 4 (AR4), the next of the UK’s auction of contracts for difference to support new projects in the renewable energy sector, was discussed in some detail in our last note (see page 10 of that note). The government now says that this is scheduled for December 2021.
Pipeline
GCP’s adviser has identified a pipeline of investment opportunities totalling £175.5m. These include a £30m potential loan to a forestry project seeking to benefit from the woodland carbon guarantee scheme which it estimates could earn a return of 9% a year. The bulk of the pipeline (over 60%) relates to biomass projects and most of the remainder to anaerobic digestion assets, including one which has an associated district heating scheme.
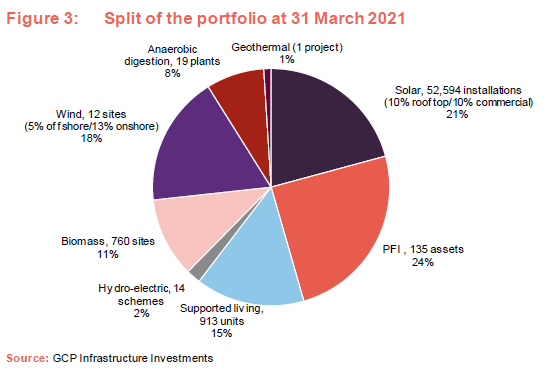
Asset allocation
At 31 March 2021, there were 48 investments in GCP’s portfolio. About 1% of the portfolio was exposed to assets in their construction phase.
Over the six months ended 31 March 2021, GCP advanced loans totalling £46.4m, £20.4m of which related to further advances to existing borrowers. Against that, GCP saw £18.4m of loans repaid, £8.8m of which related to unscheduled/early repayments.
Notable new loans were advanced against a number of hydroelectric schemes and, in a first for GCP, against a geothermal project.
The hydroelectric investment relates to 14 operational run-of-the-river hydro projects in Scotland. Power generated by the projects benefits from a price floor under the feed-in-tariff scheme. The geothermal loan relates to a scheme under construction at the Eden Project in Cornwall. Geothermal energy will be used to provide heat and power.
All investments in the pipeline fall into the renewables category, which means that the proportion of the portfolio accounted for by this sector will only increase over time.
The adviser has stated that it is not expected that the company will make significant material investments in assets developed under public‑private funding partnership models in the future.
In addition, GCP suspended new investment activity in the supported living area in response to concerns raised by the Regulator for Social Housing about the financial viability of potential counterparties for GCP’s loans. While progress may be being made in this area, the adviser says that further investment in supported living is unlikely given that other providers have entered this market, driving down returns.
Not much has changed with respect to the distribution of the portfolio since 30 September 2020.
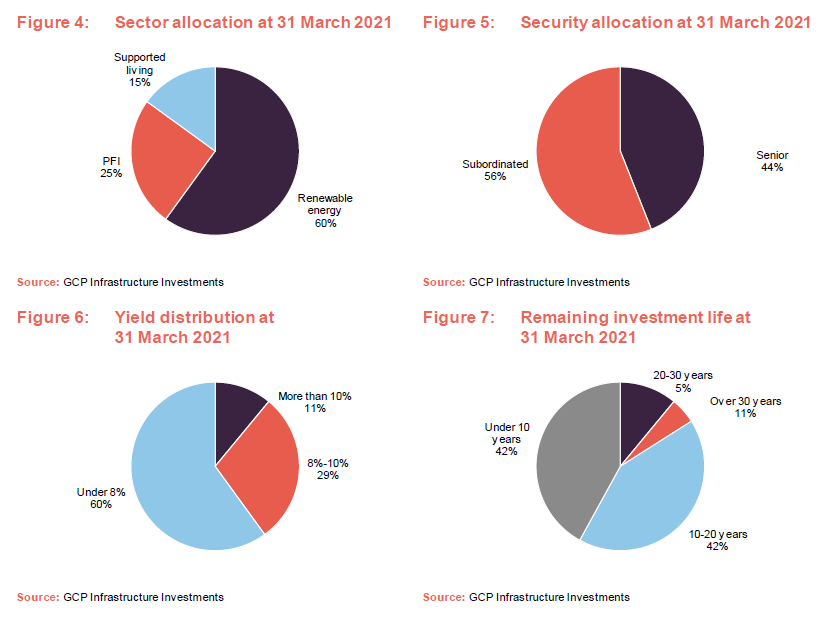
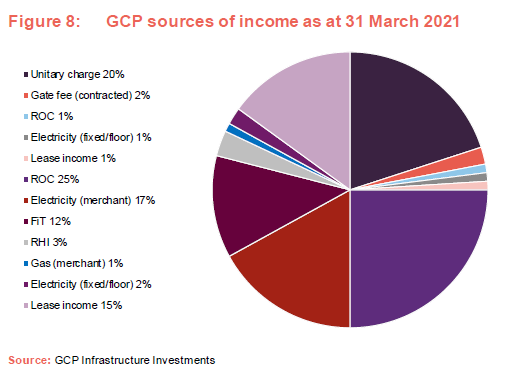
Figure 8 breaks down Figure 4 further, providing more information on GCP’s sources of income.
Top 10 investments
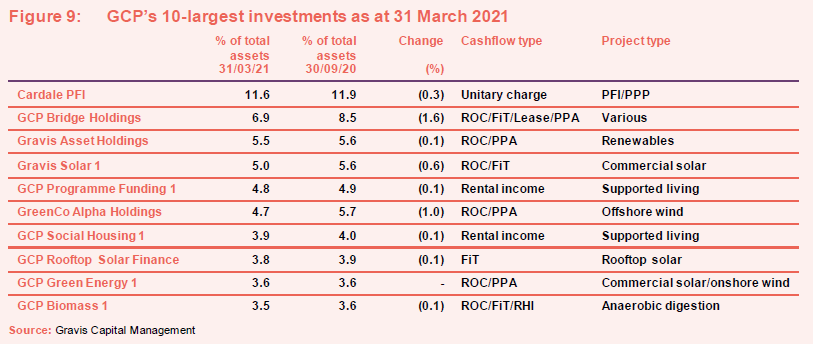
The constituents of Figure 9 are unchanged from 30 September 2020. The different types of subsidies were explained in the appendix to our initiation note – see page 27 of that note.
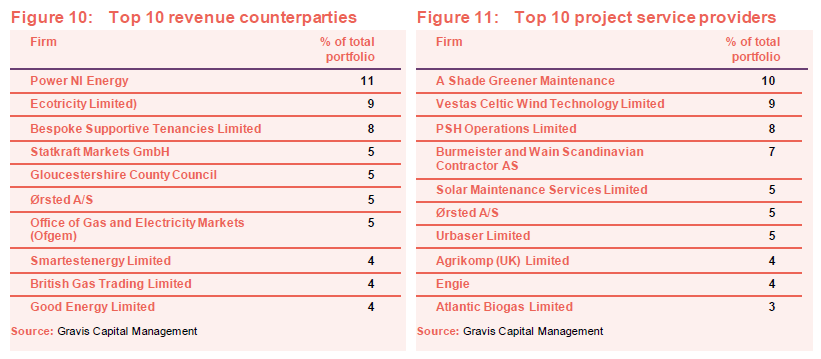
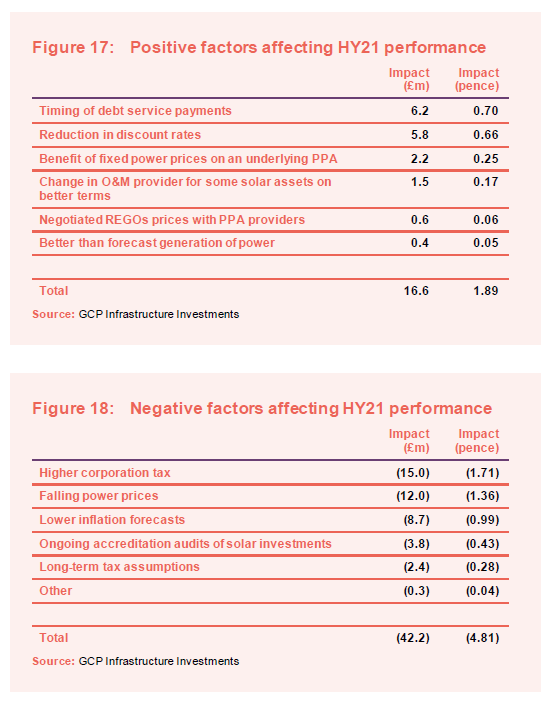
PSH Operations has replaced Solarplicity Services Limited as one of GCP’s projects’ largest service providers. It describes itself as one of the UK’s leading solar operations and maintenance (O&M) companies, managing over 1.6GW across more than 300 sites. We believe that this was beneficial to the fund in terms of lower costs (see Figure 17). The other new entrant to the list since we last published is Solar Maintenance Services, which specialises in maintaining rooftop solar installations.
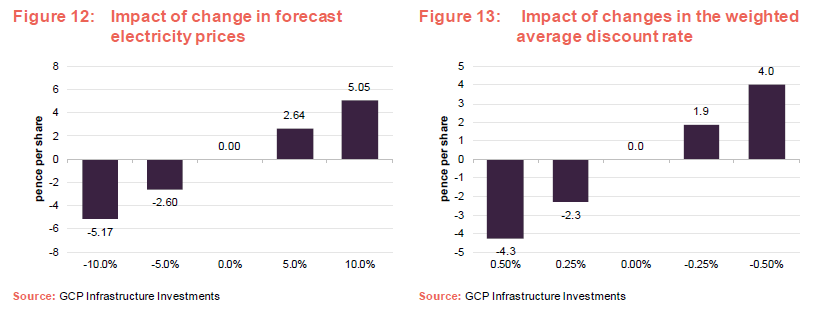
Sensitivities
The investment adviser provides sensitivity analysis to a range of factors. Figures 12 and 13 show the impact of changes in power prices and changes in the weighted average discount rate.
Performance
NAV progression
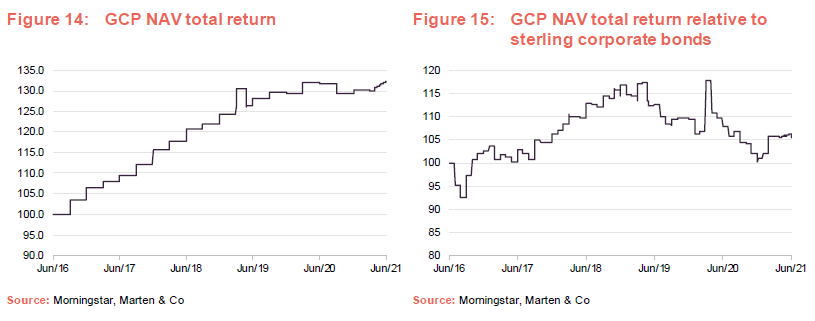
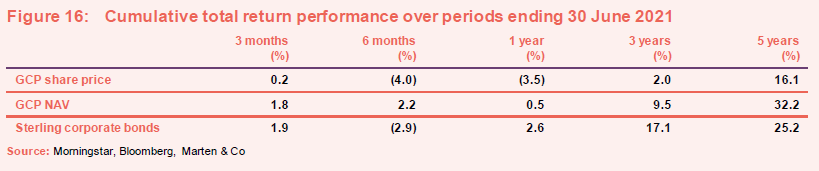
GCP does not have a formal benchmark, but the board chooses to compare its returns to those of a sterling corporate bond index, and we have done so here.
Most of the factors affecting GCP’s performance have been explored elsewhere in this note.
Factors affecting performance over the six months to the end of March 2021
As Figure 17 shows, prepayment penalties in connection with the early repayments of loans discussed on page 10 were beneficial to the NAV. Over the 12 months ended 31 March 2021, the weighted average discount rate used to value GCP’s investments fell from 7.40% to 7.18% (range 4.5% to 10.4%).
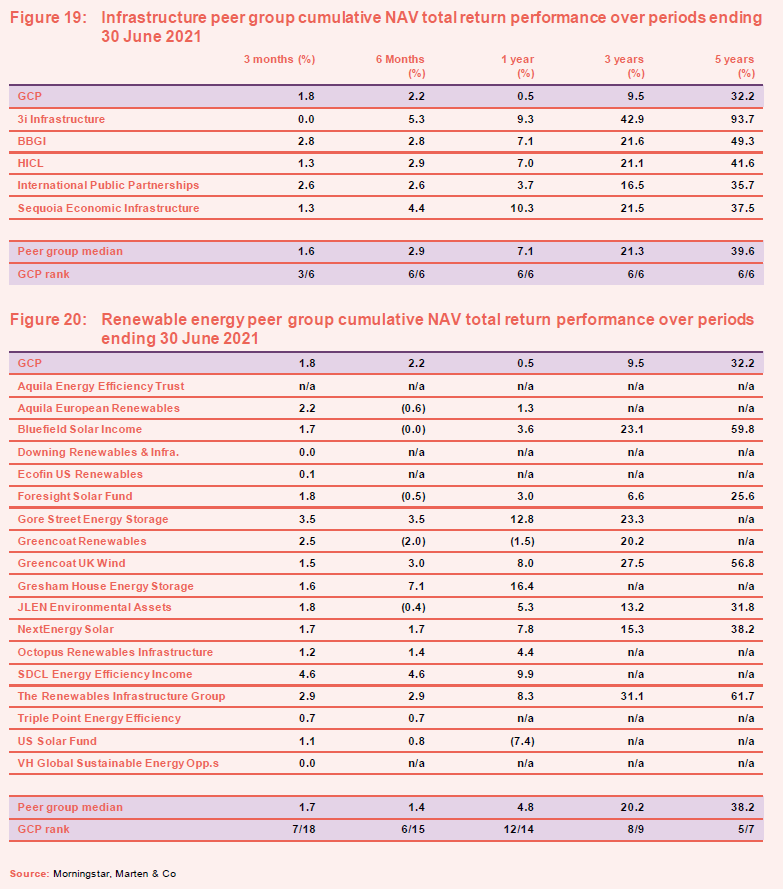
The ongoing accreditation audits of solar investments relate to a portfolio of 14 ground-mounted solar projects. Over the six months ended 31 March 2021, the owner of one project lost a judicial review that had been granted in respect of Ofgem’s decision to revoke renewable obligation certificates and remove the project from the renewables obligation scheme. GCP intends to appeal the judicial review decision.
Ofgem’s enquiries are ongoing in relation to the other projects in this portfolio. Nevertheless, GCP believes that the audits will not have a material impact. Either Ofgem’s queries will be satisfactorily addressed; any adverse decision will be challenged successfully; or GCP will seek to recover any losses that it incurs from third parties in relation to a breach of investment documentation.
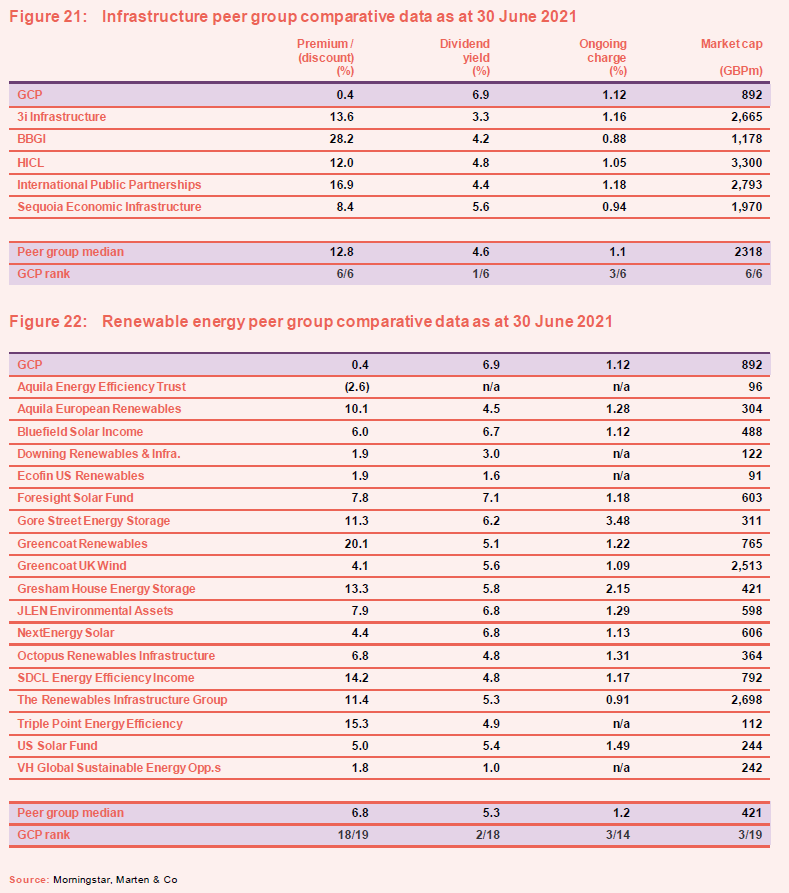
Peer group
GCP sits in the infrastructure sector alongside four funds (3I Infrastructure, BBGI, HICL and International Public Partnerships) which invest primarily in public/private partnership project equity, and one fund (Sequoia Economic Infrastructure) which, like GCP, invests primarily in infrastructure debt, but using a much broader definition of what constitutes infrastructure. We have excluded Infrastructure India (which has a very different risk/reward profile to the rest of the peer group) and the two recently-launched digital infrastructure funds (Cordiant Digital Infrastructure and Digital 9 Infrastructure) for the purposes of this note.
What is clear from Figure 19 is that GCP’s NAV returns are at the bottom end of those in its infrastructure peer group. We think that this reflect both GCP’s conservative approach to calculating its NAV and its asset mix.
We feel that, given the increasing importance of renewable energy within GCP’s portfolio, it is relevant to compare GCP to the constituents of the renewable energy sector. The sector has been expanding rapidly and consequently many of these funds have not yet built up much of a track record.
In Figure 20, once again, GCP’s conservatively valued NAV drags down its returns relative to the peer group median, but the impact of falling power prices can also be seen in the returns of other funds.
Ecofin US Renewables and US Solar Fund are somewhat cushioned from weak power prices by having much longer-term PPAs, which are typical of the US market. The energy storage funds – Gore Street and Gresham House – and the energy efficiency funds – Aquila, SDCL and Triple Point – are also much less exposed to shifts in power prices.
Many of these funds have also been impacted by foreign exchange movements, which GCP is not exposed to.
We think the best comparators are probably Bluefield Solar, Foresight Solar, Greencoat UK Wind, JLEN Environmental, NextEnergy Solar, Octopus Renewables and The Renewables Infrastructure Group.
Looking at Figure 21, within its AIC peer group, GCP is the only fund trading at a discount, but it can boast the highest dividend yield. Its ongoing charges ratio is competitive but, whilst a reasonable size, it is the smallest of these funds.
Figure 22 shows how GCP stacks up on these measures against the renewable energy sector. Again, GCP trades on the lowest rating, which as we explain elsewhere, we feel is unjustified. GCP is one of three funds, alongside Foresight Solar and NextEnergy Solar, that currently yields more than 7%.
Quarterly Dividend
GCP has declared dividends totalling 3.5p for the six-month period ended 31 March 2021, in line with its target of 7.0p for the financial year ended 30 September 2021. This is a reduction from 7.6p for the previous year. The reasons why the dividend was reduced were discussed at length in our note published on 1 June 2020. Based on the new lower level of dividend, the current pipeline of investment opportunities may eventually enable GCP to reinvest capital and to support modest potential growth in the dividend.
Dividends are declared and paid quarterly. Shareholders are able to elect to take their dividend as scrip (in shares rather than cash).
Premium rating
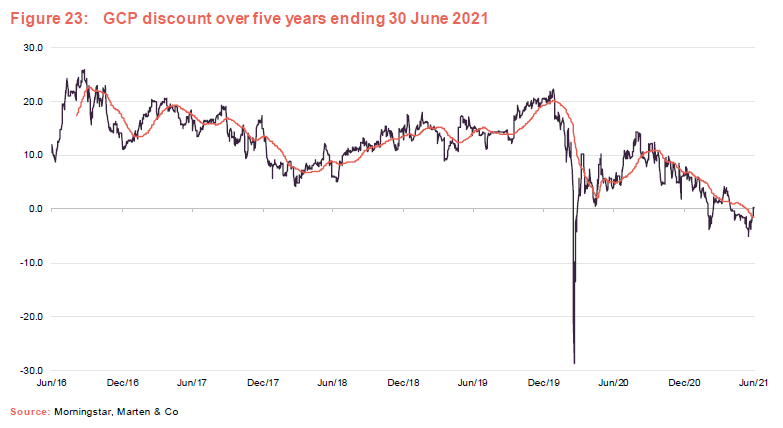
Over the year ended 30 June 2021, GCP’s shares traded on an average premium of 4.9% and reached a premium high of 14.3%. However, over this period, the shares have also traded on a discount of 5.0% and at 30 June 2021, the premium was just 0.4%.
In February 2021, shareholders approved the issuance of up to 20% of GCP’s then-issued share capital without pre-emption. They also approved the repurchase of up to 14.99% of the then-issued share capital. Repurchased shares could be held in treasury and reissued at the board’s discretion. The board does not issue shares in an attempt to moderate the premium. However, it would consider buying back shares if the shares were trading at a discount to NAV.
Since we last published on GCP, the company has issued 898,818 shares to satisfy demand for scrip dividends. No shares were repurchased.
Our strong feeling is that GCP is suffering for its caution. Investors see a falling NAV and assume that GCP’s assets are underperforming peers, but the reality should be that GCP is in a stronger position than many competing funds in the renewable energy sector, in particular.
Fund profile
GCP Infrastructure Investments Limited (GCP) is a Jersey-incorporated, closed-ended investment company whose shares are traded on the main market of the London Stock Exchange. GCP aims to generate a regular, sustainable, long-term income while preserving investors’ capital. The fund’s income is derived from loaning money at fixed rates to entities which derive their revenue, or a substantial portion of it, from UK public-sector-backed cashflows. Wherever it can, it tries to secure an element of inflation-protection.
In practice, GCP has exposure to renewable energy projects (where revenue is part subsidy and part linked to sales of power), PFI/PPP-type assets (whose revenue is predominantly based on the availability of the asset) and specialist supported social housing (where local authorities are renting specially-adapted, residential accommodation for tenants with special needs).
The investment adviser
Gravis Capital Management Limited (Gravis) is the fund’s AIFM and investment adviser. It is also investment manager of GCP Student Living and GCP Asset Backed Income, and advises VT Gravis Clean Energy Income Fund, VT Gravis UK Listed Property Fund and VT Gravis UK Infrastructure Income Fund. Assets under management are about £3bn.
Philip (Phil) Kent is the lead fund adviser, and is supported by an extensive team which includes Rollo Wright (Gravis Capital’s CEO, who was co-lead manager until May 2018).
Phil joined Gravis from Foresight Group, where he had responsibility for waste and renewable projects. He has also worked for Gazprom Marketing and Trading (latterly in its Clean Energy team) and PA Consulting’s Energy practice.
At 31 March 2021, the directors of the investment adviser – together with their family members – held 730,522 shares in GCP.
Gearing
The company’s £165m revolving credit facilities expired in March 2021 and were replaced with two new facilities comprising £140m with RBSI, Allied Irish and Lloyds (Facility A) and £25m with RBSI and Lloyds (Facility B). The revolving credit facilities are secured against a portfolio of certain underlying assets held by the company. Facility A is repayable in March 2024 and Facility B is repayable in June 2021.
Interest on amounts drawn under Facility A and Facility B is charged at SONIA plus 2.00% per annum. A commitment fee is payable on undrawn amounts of 0.70% on Facility A and Facility B. At 31 March 2021, £137.7m was drawn on Facility A and £24.6m was drawn on Facility B. The company should soon make an announcement with respect to the renegotiation/replacement of Facility B ahead of its expiry.
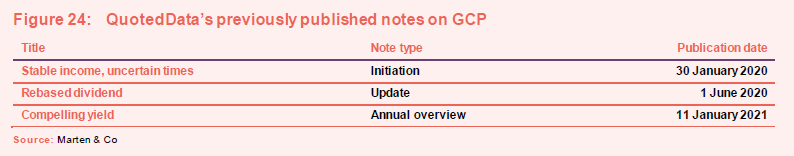
Previous publications
Readers interested in further information about GCP may wish to read our previous notes (details are provided in Figure 24 below).
The legal bit
Marten & Co (which is authorised and regulated by the Financial Conduct Authority) was paid to produce this note on GCP Infrastructure Investments Limited.
This note is for information purposes only and is not intended to encourage the reader to deal in the security or securities mentioned within it.
Marten & Co is not authorised to give advice to retail clients. The research does not have regard to the specific investment objectives financial situation and needs of any specific person who may receive it.
The analysts who prepared this note are not constrained from dealing ahead of it but, in practice, and in accordance with our internal code of good conduct, will refrain from doing so for the period from which they first obtained the information necessary to prepare the note until one month after the note’s publication. Nevertheless, they may have an interest in any of the securities mentioned within this note.
This note has been compiled from publicly available information. This note is not directed at any person in any jurisdiction where (by reason of that person’s nationality, residence or otherwise) the publication or availability of this note is prohibited.
Accuracy of Content: Whilst Marten & Co uses reasonable efforts to obtain information from sources which we believe to be reliable and to ensure that the information in this note is up to date and accurate, we make no representation or warranty that the information contained in this note is accurate, reliable or complete. The information contained in this note is provided by Marten & Co for personal use and information purposes generally. You are solely liable for any use you may make of this information. The information is inherently subject to change without notice and may become outdated. You, therefore, should verify any information obtained from this note before you use it.
No Advice: Nothing contained in this note constitutes or should be construed to constitute investment, legal, tax or other advice.
No Representation or Warranty: No representation, warranty or guarantee of any kind, express or implied is given by Marten & Co in respect of any information contained on this note.
Exclusion of Liability: To the fullest extent allowed by law, Marten & Co shall not be liable for any direct or indirect losses, damages, costs or expenses incurred or suffered by you arising out or in connection with the access to, use of or reliance on any information contained on this note. In no circumstance shall Marten & Co and its employees have any liability for consequential or special damages.
Governing Law and Jurisdiction: These terms and conditions and all matters connected with them, are governed by the laws of England and Wales and shall be subject to the exclusive jurisdiction of the English courts. If you access this note from outside the UK, you are responsible for ensuring compliance with any local laws relating to access.
No information contained in this note shall form the basis of, or be relied upon in connection with, any offer or commitment whatsoever in any jurisdiction.
Investment Performance Information: Please remember that past performance is not necessarily a guide to the future and that the value of shares and the income from them can go down as well as up. Exchange rates may also cause the value of underlying overseas investments to go down as well as up. Marten & Co may write on companies that use gearing in a number of forms that can increase volatility and, in some cases, to a complete loss of an investment.