
 Battery storage potential
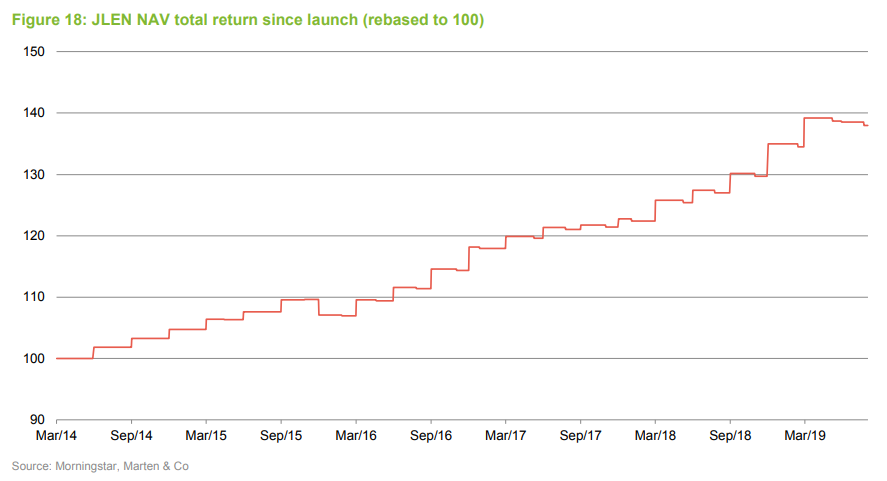
JLEN Environmental Assets (JLEN) recently added two new revenue streams, hydropower and battery storage, to its already-diverse portfolio. It’s clear from the 16.5% premium to NAV, that investors are drawn to JLEN and its asset mix. In an environment where interest rates are falling, JLEN’s dividend yield (which is well-covered by cash flow) and the relative predictability of its earnings are attractive. Premiums in the sector may look high, but the advisers highlight the conservative nature of JLEN’s NAV.
Opportunities to add to hydroelectric exposure are limited, but battery storage facilities could be applied across much of JLEN’s portfolio. Sensibly, the advisers will be using their experience with the new Thrybergh battery unit (see page 16) to evaluate the potential benefit to JLEN before committing to a more significant investment in this area.
Progressive dividend from investment in environmental infrastructure assets
JLEN aims to provide its shareholders with a sustainable dividend, paid quarterly, that increases progressively in line with inflation. It also aims to preserve the capital value of its portfolio on a real basis over the long term. It invests in environmental infrastructure assets with predictable, wholly or partially index-linked cash flows, supported by long-term contracts or stable regulatory frameworks.
Fund profile
JLEN Environmental Assets Group (JLEN) invests in infrastructure projects that use natural or waste resources or support more environmentally-friendly approaches to economic activity. This could involve the generation of renewable energy (including solar, wind, hydropower and biomass technologies), the supply and treatment of water, the treatment and processing of waste, and projects that promote energy efficiency. It aims to build a portfolio that is diversified both geographically and by type of environmental asset. This emphasis on diversification helps differentiate JLEN from its peers, which tend to specialise in solar or wind.
Reflecting its objective of delivering sustainable, inflation-linked dividends and preserving its capital, JLEN does not invest in new or experimental technology. A substantial proportion of its revenues is derived from long-term government subsidies.
Change of ownership of adviser
Until recently, JLEN was advised by John Laing Capital Management (JLCM). On 1 July 2019, JLCM’s advisory agreement with JLEN was acquired by Foresight Group CI Limited (Foresight or the adviser). The entire team went across to Foresight, strengthening that firm’s 90-strong cohort of professionals involved in managing or advising on renewable infrastructure assets. The deal brought Foresight’s assets under management to £4bn, over £3bn of which is in energy infrastructure. This includes Foresight Solar Fund, which sits in JLEN’s listed peer group (see page 20). For JLEN investors, it should be business as usual following the Foresight transaction, but with the additional comfort that the adviser will have a much deeper pool of professional expertise to draw on. More information on the leading members of the Foresight team covering JLEN is given on page 25. The First Offer agreement between JLEN and John Laing Group (see page 9) has continued following the sale of the advisory agreement to Foresight. The board announced a change in the name of the company from John Laing Environmental Assets Group to JLEN Environmental Assets Group on 14 August 2019.
The renewable energy market
We have written extensively on the renewable energy market in previous JLEN notes. In particular, we would direct readers to pages 3-7 of our note, Diversification benefits shine through, published in September 2018. The UK government set a target of net zero greenhouse gas emissions by 2050 on 12 June 2019. Incoming Prime Minister, Boris Johnson has reaffirmed that target. It seems unlikely, therefore, that the new administration will make any adverse change to the subsidy regime.
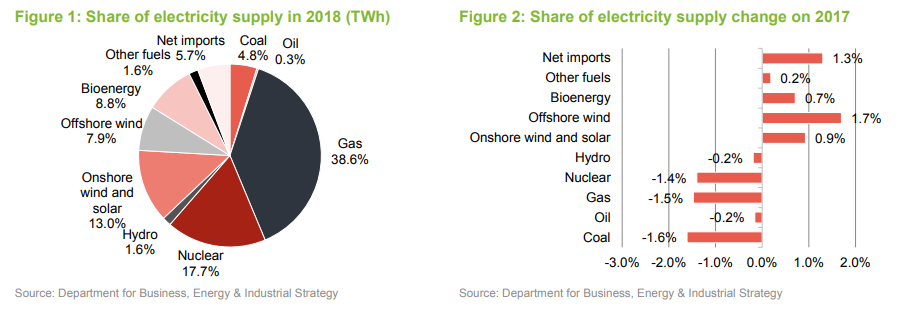
Data from the Department for Business, Energy & Industrial Strategy show that over the course of 2018, the share of electricity supplied accounted for by renewables hit a new high of 31.2%, up 3.1% over 2017. Correspondingly, the share of electricity supplied that is accounted for by fossil fuels (coal, oil and natural gas) fell from 46.9% to 43.7% (ignoring the small and unquantifiable amount of imported energy accounted for by fossil fuels).
Subsidy free?
Changes to the UK subsidy regime that supports renewable energy projects depressed development of onshore wind and solar projects for a while. However, falling costs of developing these projects are encouraging the creation of subsidy-free wind and solar farms. Often, these are augmented by battery storage facilities. JLEN’s advisers are not yet convinced that the risk/reward opportunity stacks up for JLEN with respect to subsidy-free projects. They are keeping an open mind, however, and are exploring the potential for battery storage.
Greater diversification with hydropower and battery storage
We believe that one of JLEN’s strengths is the degree of diversification within its portfolio and we explored this in our September 2018 note. JLEN has now entered two new subsectors of the renewable energy generation market with the acquisition of two run-of-the-river hydroelectric plants (more fully described on page 16) and an associated battery storage project. Whilst there is a limited pool of hydroelectric projects suitable for JLEN’s portfolio, battery storage could provide additional revenue opportunities across many of its power generation assets.
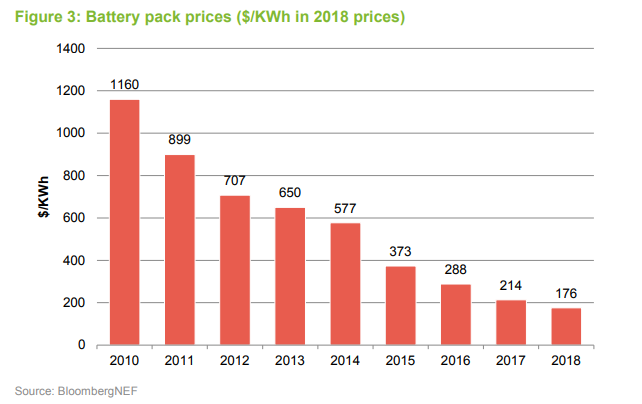
Battery storage projects became viable as the price of lithium ion batteries fell (BloombergNEF estimates that the cost of batteries has fallen by 85% since 2010 – see Figure 3). The electric vehicle market is driving demand, and producers have responded with an almost exponential increase in their supply. Production plants on the scale of the Tesla Gigafactories are being rolled out globally although, for now, China and Korea dominate the market. The EU is backing plans to create its own gigafactories and the UK government is being urged to follow suit.
Battery storage projects benefit from a variety of revenue streams. The two most important are mutually exclusive. Either the storage project can seek to facilitate trading in the short-term power market, or it can be used to help balance the frequency in the transmission network.
Intraday power price arbitrage
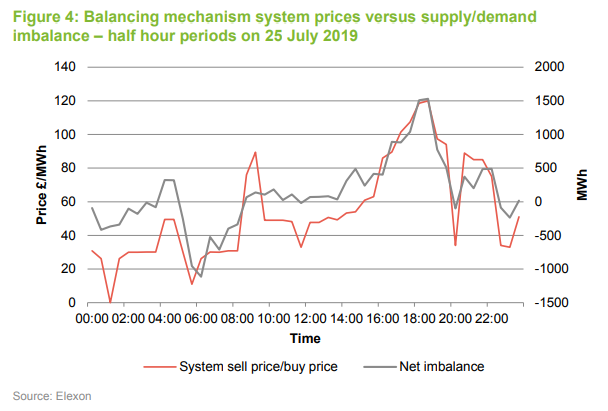
Demand for power fluctuates throughout the day and, increasingly, so does supply. The unpredictable nature of wind and solar generation can mean that there are times during the day when the UK is producing much more power than it needs. The National Grid’s Balancing Mechanism attempts to adjust supply and demand to bring them back into balance. Battery storage facilities enable you to buy power when it is cheap and sell it when it is expensive. Figure 4 illustrates this by showing how the system sell price and buy price fluctuated over the course of 25 July 2019. The price (in pink) bears a strong relationship to the under/oversupply of power, which you can see varies from undersupply in the early morning to oversupply in the evening.
Over the course of a year, in some conditions, the network can experience significant excess demand. To mitigate this, the National Grid operates the Triad system. This involves applying extra charges to heavy consumers of power and benefits generators (and battery storage operators) that can supply extra power during these periods. However, the extent of the benefit that can accrue from Triad avoidance is being greatly reduced. The charge is based on the three half-hour periods of peak power demand – battery storage facilities can be paid to help consumers and producers avoid these.
Firm frequency response
The main problem with the increasing share of generation accounted for by renewables is that power output from solar and wind can fluctuate significantly at short notice. This is unhelpful for the national transmission network, which needs to maintain a frequency of +/-1% of 50Hz across the power grid. Battery storage projects can, if they choose, absorb or release power at short notice when required, and National Grid pays them to provide this service.
The need for this was illustrated by the blackout that the UK suffered on 9 August 2019. Ofgem has launched an investigation into whether National Grid and the regional electricity network companies breached their licence conditions. Two power stations, Hornsea One offshore wind farm and an RWE gas plant (Little Barford, near Cambridge), dropped off the grid following a lightning strike, triggering a drop in frequency (to 48.8Hz). The grid responded by shedding load, causing widespread power cuts. More battery storage dedicated to firm frequency response might have avoided the problem but the investigation will also look at whether there is sufficient generation capacity in the UK.
The Capacity Market
The Capacity Market was a system of payments made to generators for providing back-up power generation capacity, seeking to ensure that there was some spare capacity in the UK power generation market in the event of some unforeseen reduction in supply. Battery storage projects had been able to derive some part of their revenue from Capacity Market payments. There were concerns, however, that the Capacity Market was encouraging the development of highly-polluting diesel power plants (which can be fired up at short notice).
In November 2018, the European Court of Justice ruled that the Capacity Market amounted to illegal State Aid. Payments were suspended and a planned capacity auction postponed. The UK government has been hoping to hold a new auction this summer, but ongoing legal challenges may block this. Those seeking a review are hoping that a revised system would benefit renewable energy producers and battery storage projects and penalise fossil fuel generators (such as the diesel-powered plants).
Ofgem’s targeted charging review
The regulator for the UK’s gas and power markets, Ofgem has been consulting on making changes to the way in which it recovers the costs associated with maintaining the electricity transmission grid. Renewable energy generators have been benefitting from the existing system, but these benefits may be lost and, in a worst-case scenario, additional costs may be imposed on them.
The need for a rethink stems from the change to the generation mix (especially from small-scale renewable energy projects, including rooftop solar) and the creation of additional energy storage capacity. The current system is set up to reward investment in on-site generation, demand-side response and storage, but these users do not then contribute to the costs of maintaining the transmission system. Ofgem believes they should pay.
The investment adviser has analysed Ofgem’s proposed way forward and quantified the impact on JLEN’s NAV as 1.7p per share. This reduction is reflected in the latest NAV, even though Ofgem has not definitively stated the changes that will occur. JLEN believes that it is prudent to recognise them now given that they are very likely to occur. Some peer funds have yet to reflect the impact of the targeted charging review, making JLEN’s valuation approach more conservative in this area.
Relative to competing funds, the impact on JLEN is muted by its business mix – it will affect its UK solar and wind operations but not overseas plants, anaerobic digestion plants and water/waste businesses. The effect on asset owners who hold only UK wind and solar projects will be proportionately higher.
Investment process
Projects are selected for the portfolio based on the advisers’ assessment of each project’s risk and reward profile. They operate within a limited set of investment restrictions. The fund acquires investments in the secondary market from third parties and also benefits from a First Offer agreement with John Laing Group.
The adviser aims to maintain the balanced and diverse nature of the portfolio. Their approach is a cautious one. Although JLEN can invest across all OECD countries, to date investments have focused on the UK and, to a limited extent, France. The advisers say that they prefer to concentrate on countries and regulatory/subsidy regimes that they know well or where they have relationships with established partners.
Investment restrictions
• No more than 15% of the portfolio to be invested in assets under construction or that are not yet operational.
• At least 50% invested in the UK and the balance invested in other OECD countries.
• No new investment to exceed 30% of NAV (or 25% of NAV based on the acquisition price, taking the value of existing assets into consideration).
First Offer agreement
The advisers have built up good working relationships with other developers. Some opportunities are brought to the adviser for appraisal by specialist consultancy firms operating in the area. Deals may also be introduced by the wider Foresight team.
Prices are negotiated at arm’s-length and reflect the advisers’ assessment of the potential risks and rewards from each project. This includes a review of the project’s capital structure.
Purchases from third parties in secondary market
JLEN also has a First Offer agreement (subject to a rolling one-year contract) with John Laing Group whereby it may acquire assets that John Laing Group wishes to sell. The agreement is a right of first offer for relevant investment interest in environmental infrastructure projects within the EU and EFTA that are consistent with JLEN’s investment policy. JLEN will only proceed with an offer that passes its due diligence and where the price is commensurate with the risks involved. Independent valuers report on fair market values for these deals and the independent directors can veto these transactions.
First Offer agreement
Potential acquisitions are assessed on a range of metrics. These vary according to the sector and include aims to:
• avoid greenhouse gas emissions, where possible;
• substitute fossil fuel consumption with renewable energy and biofuels;
• minimise the disposal of waste to landfill; and
• maintain good relations with local stakeholders.
As part of this process, the advisers:
• review each project’s permits and compliance with operating license requirements;
• review each project’s environmental management systems and the capabilities of the site’s managers; and
• commission an independent study to verify the positive environmental impact.
Ongoing management
The day-to-day facilities management, operations and maintenance of the projects are contracted to third parties and part of the adviser’s role is overseeing these arrangements, including approving payments.
The advisers seek to identify opportunities for efficiency enhancements and capacity increases (such as the one identified at Vulcan Renewables – see page 16).
The advisers also aim to optimise the company’s financial structure (the balance between debt and equity).
Disposals
JLEN will usually hold its assets for the long term and no disposals have been made to date. It may, however, sell assets when the advisers feel the sale price justifies it or when there are other valid reasons for doing so. The directors may choose to return the proceeds of disposals to investors but may reinvest them.
Hedging
When they invest in assets in currencies other than sterling, the advisers may choose to hedge the currency exposure back to sterling. The advisers may also hedge interest rate risk, inflation risk, power and commodity prices. All hedging is at the board’s discretion.
Revenue drivers
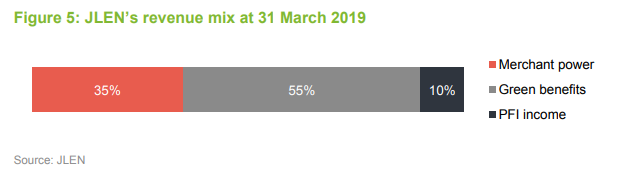
JLEN’s wind and solar assets generate revenue both from sales of electricity and from subsidies. The prices of around two thirds of revenues are stable and predictable. Whilst electricity prices fluctuate with the market, revenues from green benefits (subsidies) and PFI payments (which apply to the water and waste treatment operations) are at fixed prices. JLEN seeks to moderate its exposure to short-term power price moves by fixing prices for a proportion of its generating assets for six-12-month periods.
Subsidies
The subsidy regime in the UK has evolved over the years as new priorities have been emphasised by government. The subsidies are linked to inflation (to the retail prices index, RPI).
Renewables Obligation Certificates (ROCs) were one of the main mechanisms for the provision of subsidies to new renewable energy projects between April 2002 and March 2017. Electricity suppliers either bought ROCs from generators each year or paid a price per MWh set by the government who, in turn, passed the proceeds to the generators. The subsidies are paid for 20 years from the date of the commissioning of the project. Solar projects generating more than 5MW ceased to attract ROCs from April 2015 (although projects with planning permissions at that time were allowed to qualify for ROCs). Similarly, the scheme was terminated early, in April 2016, for onshore wind projects.
The Feed-in-tariff (FIT) scheme closed to new applicants in April 2019. FITs were only available for projects producing less than 5MW. New projects attracted a subsidy per KWh for electricity produced. Pre-2012 FITs are paid for 25 years and 20 years post-1 August 2012. These subsidies are linked to inflation.
Non-domestic renewable heat incentive (RHI)
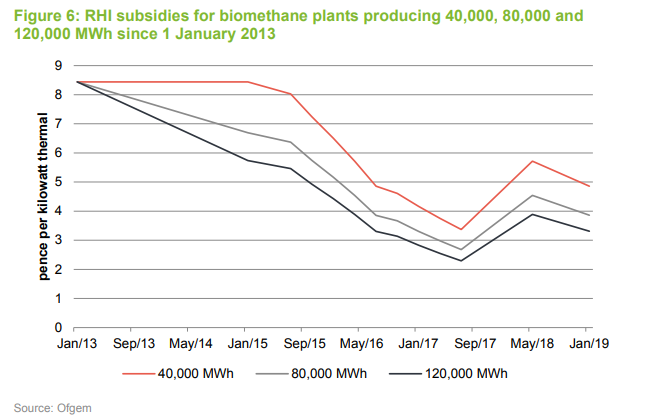
Anaerobic digestion plants, that export gas to the grid, like those in JLEN’s portfolio, are eligible for a subsidy under the non-domestic renewable heat incentive (RHI). Eligible installations receive quarterly payments over 20 years based on the amount of energy produced. The level of subsidy has varied over the years and is also dependent on the technology used to generate the energy. Tier one subsidies apply to plants producing less than 40,000 MWh; tier two applies to production between 40,000 MWh and 80,000 MWh; and tier three applies to production in excess of 80,000 MWh. Applications submitted on or after 1 April 2016 have their tariffs adjusted in line with the consumer prices index, CPI (RPI prior to that date). The scheme is scheduled to close to new plants in March 2021.
Schemes also exist whereby consumers pay a premium to use a renewable product and the producer benefits. The electricity scheme is an EU one, the Renewable Energy Guarantees of Origin (REGO) scheme. In a no-deal Brexit scenario, EU member states would not recognise UK REGOs (which might affect pricing) but Ofgem has said it will continue to operate the scheme within the UK. The gas equivalent is the Green Gas Certification Scheme.
The French subsidy system is based on Feed in tariffs. In France, wind production can be sold at fixed prices which include an element of subsidy derived from a levy on power purchases by consumers. For wind projects commissioned since 2006, for the first 10 years the power purchase agreement is set at 82€/MWh (indexed to inflation). For the remaining five-year period, the subsidy varies by output.
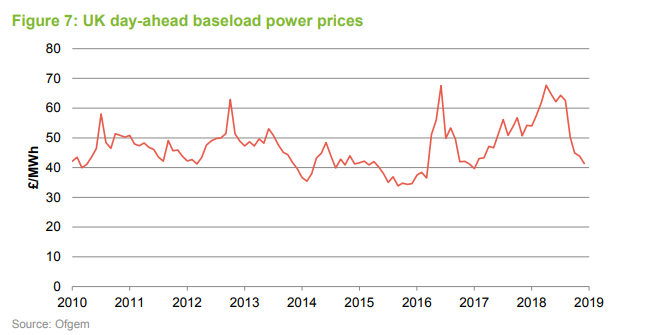
Electricity prices
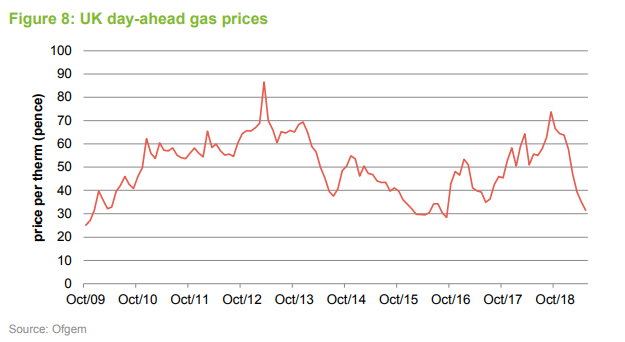
Electricity produced by JLEN’s projects is sold through power purchase agreements, (PPAs), either at fixed prices or based on prevailing spot prices (prices are set every half hour). Having climbed from the middle of 2016 to September 2018, prices have come off steeply since, reflecting a fall in the price of gas from 72p per therm in September 2018 to less than 28p in June 2019. The move in gas prices is in part due to increased deliveries of liquified natural gas (LNG) at British terminals, as well as the warm weather supressing demand.
Anaerobic digestion revenues
Once the biogas that JLEN’s anaerobic digestion plant produces has been upgraded into biomethane, it is sold at prevailing market prices for natural gas. However, increasingly the advisers are hedging the gas price. At the end of March 2019, 60% of expected gas production was hedged for 12 months. The plants attract a subsidy under the Non-Domestic RHI. The plants also have CHP (Combined Heat and Power) engines, which attract a subsidy under the FIT regime.
Water and waste revenues
With waste and wastewater treatment projects, revenues tend to vary by throughput, although contracts may be structured in such a way that handling a base case level of waste/wastewater provides the bulk of revenues.
The East London Waste Authority project has a guaranteed minimum tonnage level, set in the contract, that covers the bulk of the projects’ costs and margin at 400,000 tonnes while the contract guarantees a level of 350,000 tonnes.
Revenues from the Tay Wastewater project are banded so that over 90% of revenues are earned on the first band. JLEN thinks that the volume of wastewater treated will exceed the first band under likely scenarios. As an example, in 2003, one of the driest years on record in the UK, volumes were 12% below long-term averages.
Maintenance costs
The facilities management, operation and maintenance of JLEN’s investments is subcontracted to a range of service providers. The life of these contracts varies considerably across the portfolio. For example, the operators for the waste and wastewater projects are on whole life contracts whereas, for the other assets, these contracts can be considerably shorter.
Solar panels are guaranteed for 25 years by their manufacturers. Wind turbine contracts have product guarantees that typically cover the cost of replacing a faulty part. Operators will provide JLEN with compensation where output has fallen as a result of poor performance, insurance cover is available for lost output.
The turbines are warranted to have a 20-year life and should continue beyond this, although this is affected by location and usage. Some problems, such as grid connection failures, are JLEN’s problem, however. Insurance is in place to cover material damage, third parties and business interruption. There is a portfolio effect whereby the advisers can negotiate lower maintenance costs and insurance costs for a collection of assets as compared to a single asset.
Asset allocation
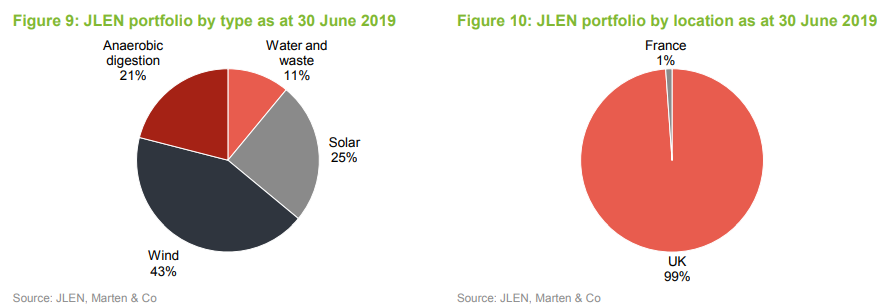
Following the most recent acquisitions, the total capacity of renewable energy assets in the JLEN investment portfolio is 286.2MW. At the end of March 2019, the 28 assets in JLEN’s portfolio were forecast to generate 520GWh of electricity (the equivalent of powering 140,000 houses), avoiding the emission of 370,000 tonnes of carbon dioxide.
The asset split in Figure 9 is not much changed from the end of December 2018. The latest acquisitions (the hydro and battery purchases announced on 19 July 2019 and the Methwold AD plant announced on 29 August 2019) are not reflected in the chart.
Wind
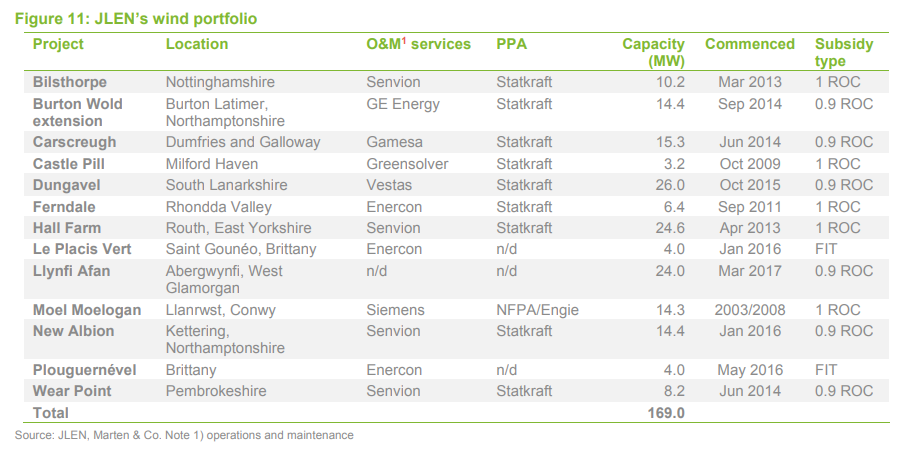
There has been no change to the composition of JLEN’s portfolio of UK onshore windfarms since we last published. All are 100% owned by JLEN. JLEN’s wind portfolio is located predominantly in the UK, with two small wind farms in Brittany, France. Life extensions have been secured on eight wind and solar projects; JLEN has not disclosed which ones or the length of the extensions. It has said, however, that it believes that there is more to go for in this regard.
Where in Figure 11 the counterparty to a PPA is not disclosed, it may be that this power is sold in the open market. Statkraft describes itself as Europe’s leading generator of renewable energy. Headquartered in Norway, it is wholly owned by the Norwegian state. NFPA is a body established in 1989 by the Regional Electricity Companies to contract for renewably generated power. Engie is one of Europe’s largest utility companies.
Work has been done to improve the operational performance of some of JLEN’s wind farms and the advisers believe that there is more that can be done in respect of this, to the benefit of the NAV.
Solar
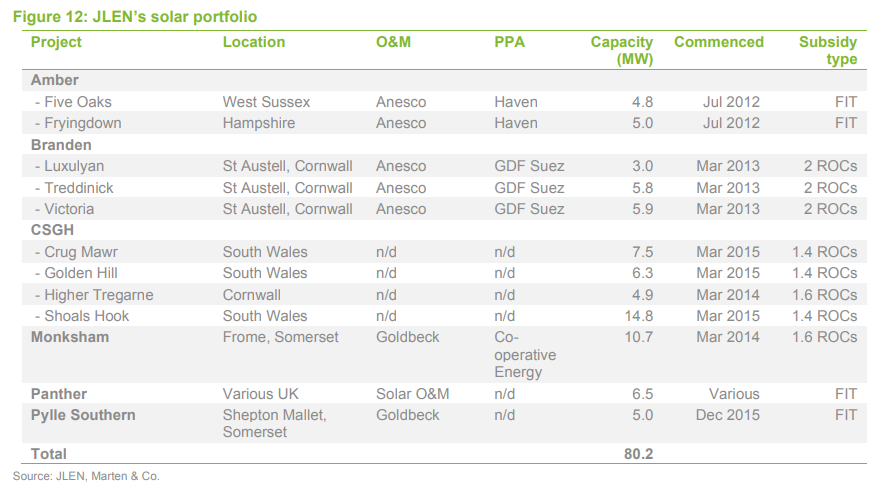
There has been no change to the composition of JLEN’s solar portfolio since we last published. Within JLEN’s solar portfolio, Amber operates across two locations, Branden operates across three locations and CSGH operates across four locations. Panther is a portfolio of smaller rooftop and ground mounted schemes scattered across the UK mainland. 1,033 of these are domestic installations, 52 are at farms and 14 are school rooftops. All are 100% owned by JLEN. Again, life extensions have been secured on some projects and the advisers are exploring what they can do with the remainder.
Anaerobic digestion
This has been the fastest-growing part of JLEN’s portfolio in recent years. Five plants are clustered in the Midlands and Egmere is just 35 miles from the latest addition to the portfolio, Methwold. This helps when sourcing feedstock and with servicing. Operations and maintenance for the anaerobic digestion portfolio are carried out by Future Biogas on six of the seven plants.
JLEN’s most recent acquisitions in this area were of Biogas Meden, which has a plant in South Yorkshire about 25 miles southeast of Sheffield, and Warren Power, which has a plant at Methwold in Norfolk.
The Biogas Meden plant cost £16.2m and Warren Power cost £14.8m (plus additional deferred payments of up to £0.8m). Both produce biomethane which is injected into the national gas grid. JLEN also increased its stake in the Icknield Plant from 40% to 52.6% at a cost of £1m.
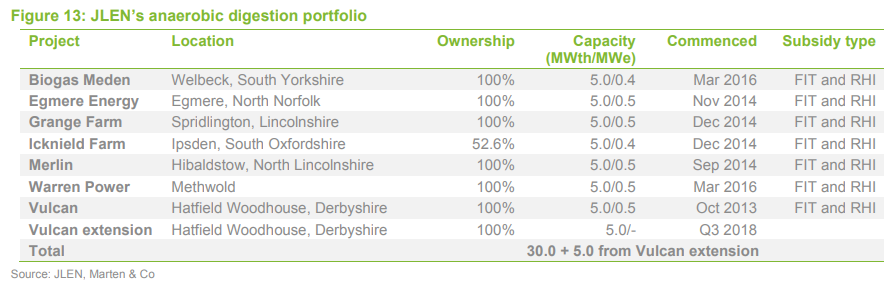
In June 2018, JLEN announced that it planned to extend its Vulcan Renewables plant. The company has injected £8.5m of funding to “significantly increase” the biomethane generation capacity of the plant by converting a storage tank into a digester and installing new storage capacity. This is said to be on track for completion later this year. The advisers say there may be scope for upgrades to other plants in the portfolio and opportunities to store feedstock, making their feedstock sourcing more flexible.
Water and waste
Following the termination of the Dumfries and Galloway (D&G) project, JLEN now has two operational PFI investments, the East London Waste Authority (ELWA) project and Tay Wastewater Treatment. JLEN estimates that it will receive £2m from the winding up of the D&G project.
ELWA processes waste from the four London boroughs of Redbridge; Barking and Dagenham; Havering; and Newham. The PFI concession agreement runs until 2027. Renewi has a 20% equity stake in the project holding company (the ELWA SPV).
The two ELWA sites became operational in 2006 and 2007. Waste processing is performed through a combination of facilities constructed and developed as part of the project, the largest of which are two mechanical biological treatment facilities which produce recyclable material and solid recoverable fuel (delivered to waste facilities, primarily in the Netherlands, and burnt to produce heat, for district heating schemes, and energy, for export to the grid). Brexit may make the export of solid recoverable fuel more difficult, but this is a matter for the operator (a division of Renewi) in the first instance.
Tay Wastewater Treatment serves 250,000 people in the vicinity of Dundee and Arbroath. Revenues from JLEN’s Tay Wastewater project are based on volume processed and are banded so that over 90% of revenues are earned on the first band. The advisers think that the volume of wastewater treated will exceed the first band under most likely scenarios. Operations and maintenance services are provided by a subsidiary of Veolia.
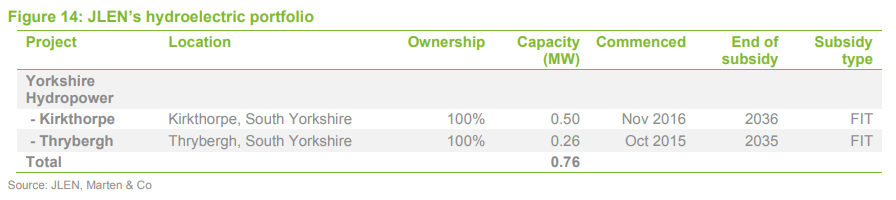
Hydropower
JLEN’s two new hydropower plants were bought for £4.3m. Kirkthorpe hydro is a 500kW single turbine hydro project located on the River Calder, and was commissioned on 21 November 2016. Thrybergh hydro is a twin-screw 260kW hydro project located on the River Don and commissioned on 26 October 2015.
Battery storage
JLEN has a single battery storage project co-located with the Thrybergh hydroelectric scheme. This has a capacity of 1.2MW and was commissioned in January 2018. Thebattery is dedicated currently to Firm Frequency Response under a contract that runs until next year. No decision has been taken yet as to the use of the battery beyond that date, but the investment adviser is considering a number of different usage cases.
Valuation
Calculating the NAV
JLEN publishes NAVs on a quarterly basis based on valuations prepared by the investment adviser. These are approved by the board prior to publication. There is no publicly quoted price for the projects that JLEN invests in, and so the projects are valued on the basis of discounting the cash flows over the life of the project at a rate that reflects what market evidence is available for project pricing. At the year end, an independent specialist will advise the board on the suitability of the discount rate, amongst other things. Discount rates used at the end of March 2019 ranged from 6.5% to 9.2% and the weighted average discount rate then was 7.9% (down from 8.1% at the end of March 2018).
The UK inflation rate was assumed to be 2.8% in 2019, falling to 2.75% from 2021 and French inflation was assumed to be 1.5%. Deposit rates were assumed to be 1.5% in the UK for 2019, rising gradually to 2.5% in 2020 and 0.5% in France. An exchange rate of 1.16 was used to translate the value of the French assets into sterling. UK corporation tax was assumed to be 19% in April 2019 falling to 17% in April 2020 and French corporation tax 28% falling to 25% from 2022.
The asset lives for the wind and solar assets were estimated to be 25 years but eight of these have now been extended. Extensions on additional assets are possible.
Forecasts of electricity output are based on long-term models and use a central base case of the amount of electricity that is expected to be generated by each project 50% of the time. They have to build possible outages into the model – they assume that wind projects are available for production 97.7% of the time and solar projects are available 98.9% of the time.
Electricity prices are modelled based on fixed-price agreements or, where these do not exist, forecast prices. For the first two years, Foresight uses market rates to forecast prices, where fixed price arrangements are not in place. For periods beyond two years, it uses long-term forecasts supplied by external consultants as adjusted for project-specific arrangements.
Forecasts of waste and wastewater volumes are based on the client’s own projections where available and independent studies where appropriate.
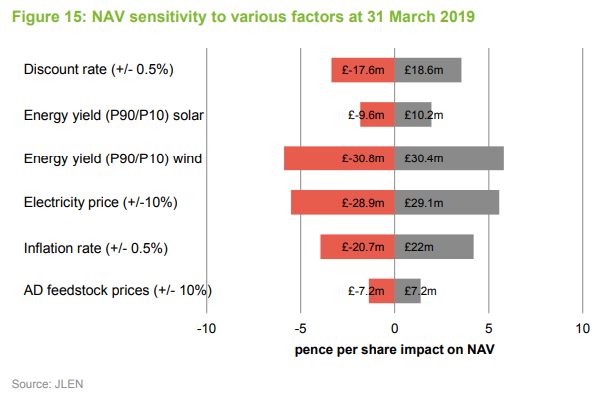
Sensitivities
Figure 15 shows how the NAV might move given various scenarios. ‘P90’ and ‘P10’ against the electricity yields show the impact if electricity yields were 10% off their worst and highest assumptions respectively. The bars show the impact both in monetary terms and the potential impact on the NAV and this reflects the asset mix within JLEN’s portfolio.
Performance
Operational performance
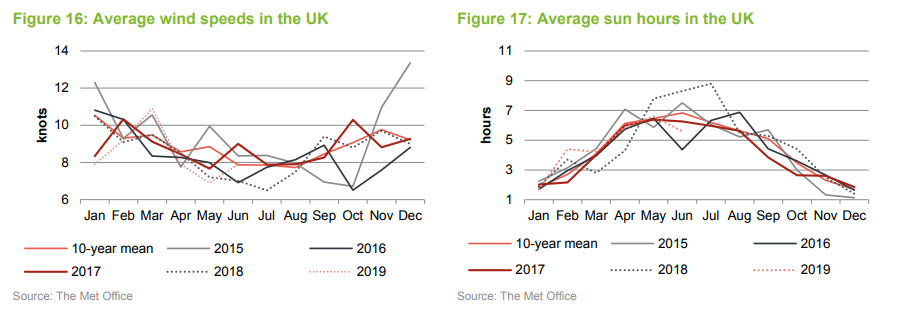
For the first six months of 2019, wind speeds have been below 10-year means according to Met Office data supplied by the Department for Business, Energy and Industrial Strategy. By contrast, solar PV resource has been at about average levels (albeit lower than last year’s exceptional levels).
For the year to the end of March 2019, JLEN’s overall generation was 3.9% behind budget, which can mainly be attributed to weather patterns.
Wind generation was 9.2% below budget. Of this, low winds speeds accounted for 7% and longer than anticipated outages in respect of maintenance on four farms serviced by Senvion made up most of the balance. Senvion is a German wind turbine business which has been struggling financially. Its lenders are supporting the business while it finds a buyer. The advisers are watching the situation closely.
Solar generation was 1.6% ahead of budget. Whilst, on irradiation levels alone, generation would have been 6.1% higher, the associated high temperatures increase electrical resistance and reduce the power output. Ongoing problems at Branden (discussed in earlier notes) and distribution network operator outages in Wales also impacted on revenue, but insurance will offset some of the issues at Branden. The advisers are focused on optimising the performance of the solar portfolio.
Gas generation from the anaerobic digestion plants was 3.7% ahead of budget for the year ended 31 March 2019. The Icknield plant did particularly well, and the upgrade work at Vulcan did not unduly affect the existing operation. The advisers say the availability of feedstock was constrained by adverse weather patterns in 2018/19. This is one reason why they are keen to develop strategic feedstock stores (see page 16).
For the year ended 31 March 2019, ELWA treated 445,000 tonnes of waste (against a maximum capacity of 700,000 tonnes). 25% was recycled and 93% of the waste was diverted from landfill.
Financial performance
The NAV benefitted from the lower weighted average discount rate. In addition:
• the life extensions that the adviser has secured to date added about £8.4m to the end March 2019 NAV;
• the refinancing carried out at the portfolio level (see page 24) added about £8.5m;
• the rising trend of power prices was also positive, adding £2.1m;
• higher prices for REGOs added £1.1m;
• the implementation of a gas hedging strategy and higher prices for green gas certificates added £1.5m;
• improvements to the anaerobic digestion portfolio added about £1.6m; and
• a reduction in the cost of servicing the wind portfolio added a further £0.5m.
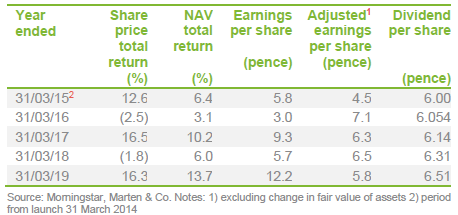
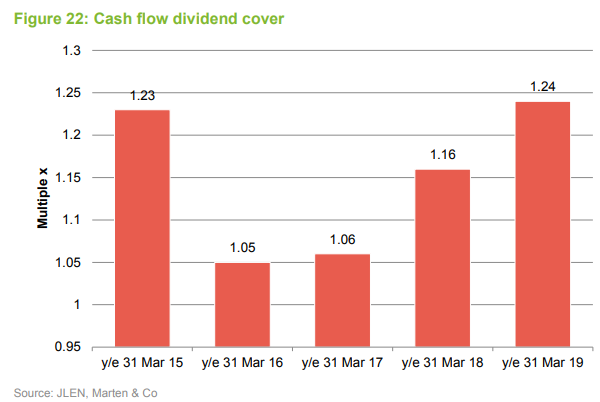
JLEN’s profit before tax for the end March 2019 financial year was £53.4m or 12.2p per share. £27.9m of this related to gains in the value of its investments, leaving it with adjusted earnings per share of 5.8p. As we have stated elsewhere, this is an imperfect yardstick to measure JLEN’s performance. We show how its cash flow stacks up against its dividend payments in Figure 22 on page 22.
Peer group
The AIC’s renewable energy sector has been expanding and now has 12 constituents. JLEN has the broadest remit and is the only fund in this peer group to incorporate environmental infrastructure assets such as anaerobic digestion and water and waste projects within its portfolio. Bluefield, Foresight, NextEnergy and US Solar are all pure solar plays. Greencoat UK Wind and Greencoat Renewables are focused exclusively on wind at present. The Renewables Infrastructure Group and Aquila European Renewables hold both solar and wind projects, the latter fund will also have some hydroelectric and battery storage exposure. Gore Street Energy Storage and Gresham House Energy Storage seek to derive revenue from battery storage facilities. Lastly, and least comparable to JLEN, SDCL Energy Efficiency Income funds projects that make businesses and buildings more energy efficient.
Figure 19 compares the performance of the funds, while Figure 20 highlights some of the key differences between them. To a large extent, variations in performance between the funds reflect differences in the asset mix. The sector is still relatively young (JLEN has only just passed its fifth birthday and the first fund to launch, Greencoat UK Wind, pre-dates JLEN by a year). We have excluded the most recent launches from the performance table in Figure 19.
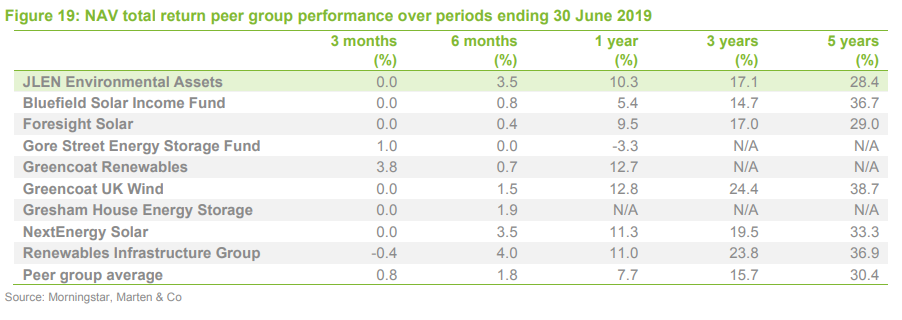
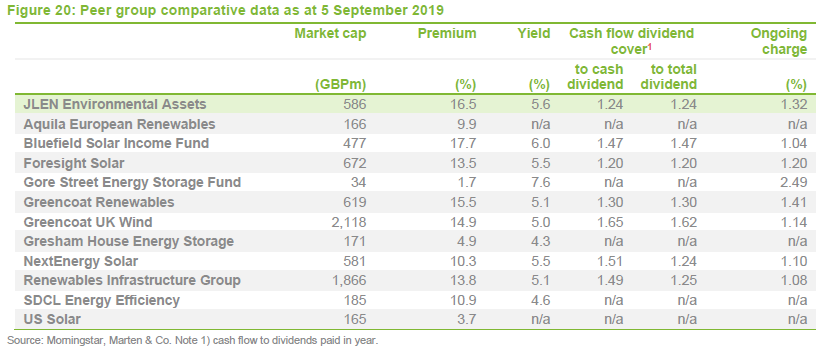
Figure 20 shows that JLEN ranks fifth of the 12 funds in the sector by market cap. Each of the funds in the peer group trades at a premium to NAV, see page 22 for more discussion on this topic. JLEN’s yield is amongst the highest in its sector and it is encouraging that these dividends are all well-covered by cashflow. Given the fundraise that JLEN completed in October 2018, we would expect its ongoing charges ratio to fall in its current financial year (as fixed costs are spread over a wider base).
Dividend
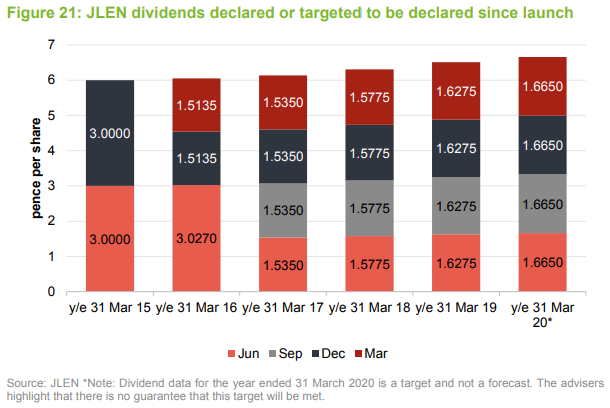
JLEN increased its dividend forecasts for the year ended 31 March 2020 to 6.66p or 1.665p per quarter.
Figure 22 shows that the dividends that JLEN paid in the period have been covered by the cash generated from the portfolio after running costs. Cash flow dividend cover is a more valid measure than earnings cover for a fund such as JLEN, in our opinion, as it is less subjective.
Premium/(discount)
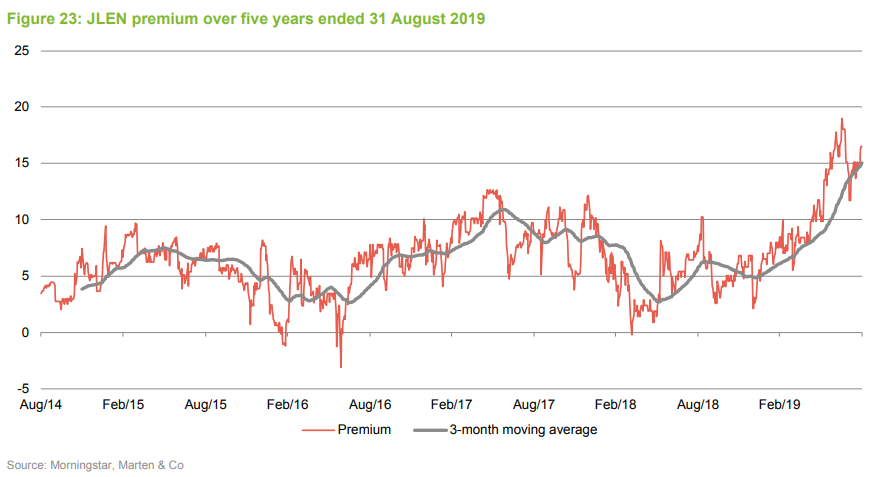
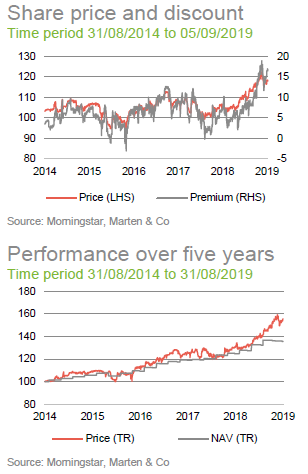
Over the past year, JLEN has traded between a premium of 2.1% and a premium of 19.0%, with an average premium of 8.8%. On 5 September 2019 JLEN was trading on a premium of 16.5%.
We believe that the strength of JLEN’s premium reflects its high and growing dividend yield and the relative predictability of its cash flows at a time when much else is uncertain. JLEN’s predicted returns look all the more attractive in an environment of falling interest rates and the premium may reflect an expectation by investors that discount rates will also drop. The Foresight team have told us that JLEN’s NAV is valued conservatively. There is also scope to secure additional life extensions.
Fees and costs
JLEN’s ongoing charges ratio for the year ended 31 March 2019 was 1.26%, down from 1.31% for the prior year. The advisers are entitled to a base fee of 1% on the first £500m of adjusted portfolio value and 0.8% on the balance. That sliding scale took effect during the year as the assets surpassed £500m for the first time. In addition, the growth of the company helps spread fixed costs over a wider base.
The adviser’s contract can be terminated on one year’s notice. There is no performance fee.
Directors’ fees and expenses totalled £242,000 for the last financial year. Other notable expenses were for administration services, provided by Praxis Fund Services Limited (£100,000), and for the auditors, Deloitte LLP (£102,000).
Capital structure and life
JLEN is domiciled in Guernsey and is listed on the main market of the London Stock Exchange. It invests through a subsidiary, JLEN Environmental Assets Group (UK) Limited (UK Holdco), in which it may own both equity and loan notes.
On 24 October 2018, the company raised gross proceeds of £105m, issuing 102,941,176 shares at 102p. Following this share issue, JLEN has 497,018,205 ordinary shares in issue and no other classes of share capital.
JLEN has an indefinite life but a discontinuation vote may be triggered if its shares trade at a discount for a prolonged period of time (see Premium/(discount) on page 22). The company’s financial year end is 31 March and AGMs are typically held in August.
Gearing
Gearing is permitted at the fund level up to a maximum of 30% of net assets. Gearing is provided to UK Holdco by a £170m multi-currency revolving credit facility. This can be extended under an accordion facility by a further £20m (an accordion facility allows the borrower to expand the maximum borrowing allowed). The facility is provided at a margin above LIBOR (or, in respect of loans denominated in euros only, EURIBOR) of 2.00%-2.25% depending on JLEN’s loan-to-value ratio. Interest rate risk is hedged out using swaps. The facility has been extended to June 2022. At 31 March 2019, the facility was drawn by £16.7m. This was offset by unrestricted cash at Group level of £11.4m.
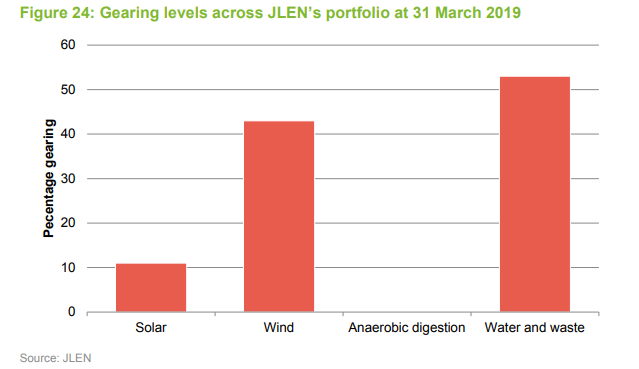
In addition to the revolving credit facility, the stable, predictable cashflows generated by the underlying projects make it easier to borrow money secured against them. At the project level, JLEN is constrained to a maximum 65% gearing on gross project value for renewable energy generation projects and maximum 85% gearing on gross project value for PFI/PPP type projects. Actual project gearing is much lower than this (33.7% of gross project value at the end of March 2019). This finance is non-recourse to thefund. Adding in the outstanding balance on the revolving credit facility gives overall gearing of 36%.
In March 2019, JLEN refinanced part of its portfolio (ahead of the maturity of the previous facilities scheduled for March 2021), putting in place a single senior term loan, a debt service reserve facility and a letter of credit facility. These totalled approximately £200m and were secured against JLEN’s 10 wind assets and four of its solar projects.
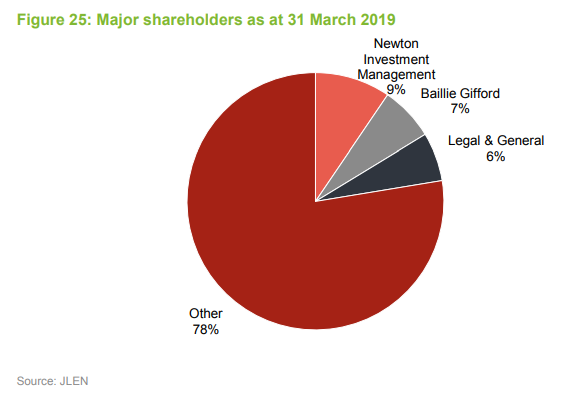
Major shareholders
John Laing Pension Trust’s stake in the company (about 22m shares) was placed with other investors in March 2019.
Key members of the advisory team
Chris Tanner joined the team in January 2014. Prior to this, he was a principal in Janus Henderson’s private equity infrastructure team, often working closely with John Laing Group on a range of special projects, including the buying of investments in environmental infrastructure, as well as corporate refinancing and valuations. For the 18 months prior to joining the advisers, he was on secondment to JLG, focusing on its renewable energy business as corporate finance director. Before joining Henderson in 2007, Chris worked at PricewaterhouseCoopers for 11 years, including seven years in the infrastructure concessions team, where he focused on project finance advisory services for both public and private sector clients, covering a wide range of projects with a strong focus on the waste sector. Chris is a member of the Institute of Chartered Accountants in England and Wales and has an MA in Politics, Philosophy and Economics from Oxford University.
Chris Holmes joined the team in January 2018 to take on the role of joint lead adviser to the company, working alongside Chris Tanner. Chris Holmes is formerly of the UK government’s Green Investment Bank, where he was head of its waste and bioenergy team. His background is in project finance banking and he spent 12 years at Dutch bank NIBC heading the UK lending and advisory activities for infrastructure and renewable transactions. He also managed the bank’s initiative to bring institutional investors into infrastructure projects via structured capital market solutions. Prior to working at NIBC, Chris spent a number of years in project finance at firms including Grant Thornton. Chris has a BA in Business Economics from the University of Durham.
Board
The five directors are all non-executive and independent of the adviser. Chris Legge, the former chairman of the audit committee, stood down from the board on 13 June 2019 and Hans Joern Rieks replaced him as a director. Peter Neville became the new chairman of the audit committee at that date, handing the chairmanship of the risk committee to Hans.
The board says that Hans’s appointment forms part of a process of board succession. It regards it as important to address the diversity of the board within the next 12 months, and to address the fact that four more of the original directors are likely to be replaced by the ninth anniversary of the fund’s listing in 2023.
The bill for the total remuneration and benefits in kind payable to the directors is capped (within the Articles of the company) at £300,000 per annum.
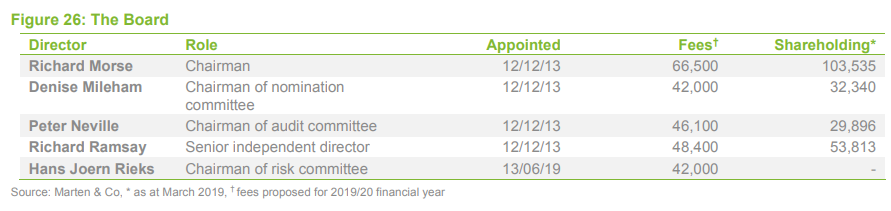
Hans Joern Rieks is a relatively new appointment to the board. He has over 25 years of experience within the global wind industry, held senior level positions with Vestas, and spent the last five years with Siemens/Gamesa where he was appointed as CEO of the Wind Power division for EMEA.
Previous publications
Readers interested in further information about JLEN may wish to read our earlier notes. You can access them notes by clicking on the links below.
- Diverse renewables exposure – Initiation – 6 September 2017
- Anaerobic diversification – Update – 6 March 2018
- Diversification benefits shine through – Annual overview – 12 September 2018
- Life extension to boost NAV? – Update – 15 March 2019
The legal bit
Marten & Co (which is authorised and regulated by the Financial Conduct Authority) was paid to produce this note on JLEN Environmental Assets Group.
This note is for information purposes only and is not intended to encourage the reader to deal in the security or securities mentioned within it.
Marten & Co is not authorised to give advice to retail clients. The research does not have regard to the specific investment objectives financial situation and needs of any specific person who may receive it.
The analysts who prepared this note are not constrained from dealing ahead of it but, in practice, and in accordance with our internal code of good conduct, will refrain from doing so for the period from which they first obtained the information necessary to prepare the note until one month after the note’s publication. Nevertheless, they may have an interest in any of the securities mentioned within this note.
This note has been compiled from publicly available information. This note is not directed at any person in any jurisdiction where (by reason of that person’s nationality, residence or otherwise) the publication or availability of this note is prohibited.
Accuracy of Content: Whilst Marten & Co uses reasonable efforts to obtain information from sources which we believe to be reliable and to ensure that the information in this note is up to date and accurate, we make no representation or warranty that the information contained in this note is accurate, reliable or complete. The information contained in this note is provided by Marten & Co for personal use and information purposes generally. You are solely liable for any use you may make of this information. The information is inherently subject to change without notice and may become outdated. You, therefore, should verify any information obtained from this note before you use it.
No Advice: Nothing contained in this note constitutes or should be construed to constitute investment, legal, tax or other advice.
No Representation or Warranty: No representation, warranty or guarantee of any kind, express or implied is given by Marten & Co in respect of any information contained on this note.
Exclusion of Liability: To the fullest extent allowed by law, Marten & Co shall not be liable for any direct or indirect losses, damages, costs or expenses incurred or suffered by you arising out or in connection with the access to, use of or reliance on any information contained on this note. In no circumstance shall Marten & Co and its employees have any liability for consequential or special damages.
Governing Law and Jurisdiction: These terms and conditions and all matters connected with them, are governed by the laws of England and Wales and shall be subject to the exclusive jurisdiction of the English courts. If you access this note from outside the UK, you are responsible for ensuring compliance with any local laws relating to access.
No information contained in this note shall form the basis of, or be relied upon in connection with, any offer or commitment whatsoever in any jurisdiction.
Investment Performance Information: Please remember that past performance is not necessarily a guide to the future and that the value of shares and the income from them can go down as well as up. Exchange rates may also cause the value of underlying overseas investments to go down as well as up. Marten & Co may write on companies that use gearing in a number of forms that can increase volatility and, in some cases, to a complete loss of an investment.