June 2024
Monthly | Investment companies
Kindly sponsored by abrdn
Winners and losers in May 2024
May has been a story of market rebounds, with some of 2024’s worst-performing sectors having become the best-performing. Infrastructure securities was the top performing sector over the month. Listed infrastructure was supported by a fall in interest rate expectations in Europe and the UK, as well as an increasingly positive outlook on global GDP growth.
The UK saw an across-the-board rally, reflected in both the small and large cap peer groups. The market sentiment around the UK improved on the back of declining inflation, lower rate expectations, and perhaps the announcement of the general election. The UK reported positive GDP growth over the first quarter of 2024, up 0.6%. This meant that the UK had emerged from recession, improving investor confidence (however, we have since learned that April’s GDP figure was flat). The UK is also one of the cheapest developed markets to invest in, which has encouraged takeover bids.
These positives for the UK also helped support select segments of the UK property market, largely those with greater structural tailwinds such as healthcare, which reported both positive NAV and share price growth. While not featuring in the top five listed below, the UK logistics sector was also a decent performer.
Much like the UK, Europe also benefited from the tailwinds of declining inflation and higher growth, with the Swedish central bank cutting interest rates (heralding June’s 0.25% rate cut by the European Central Bank). Europe’s smaller companies benefited most from the changing macroeconomic environment, given that they are more sensitive to the domestic economy. Rate cuts are also good news for growth stocks and the European small cap sector is biased towards such companies.
Best performing sectors in May 2024 by total price return
| Median share price total return (%) |
Median NAV total return (%) |
Median discount 31/05/24 (%) |
Median sector market cap 31/05/24 (£m) | Number of companies in the sector | |
|---|---|---|---|---|---|
| Infrastructure securities | 10.8 | 9.5 | (14.3) | 110.9 | 2 |
| UK smaller companies | 8.0 | 5.7 | (11.5) | 133.1 | 26 |
| UK all companies | 7.1 | 5.6 | (10.5) | 214.4 | 8 |
| Property – UK healthcare | 4.7 | 1.4 | (27.4) | 424.8 | 2 |
| European smaller companies | 4.5 | 4.6 | (12.5) | 512.8 | 4 |
In terms of the worst performers, the property – rest of world sector was this month’s laggard. The sector is exposed to three diverse strategies, and its fall was driven by the 7.6% fall in the value of Macau Properties and the 5.7% fall in Aseana Properties. Both of these are small, thinly traded strategies and these losses reflect their own unique issues as much as the global demand for East Asian property.
The falls for other sectors are fairly meagre. Insurance strategies has just two constituents, and its share price return was driven by a widening discount at Life Settlement Assets.
We note that the majority of the debt direct lending sector is currently being wound up, which may mean that the fall in their share prices reflects investors selling out of an effectively amortising asset in favour of trusts with higher capital growth potential.
Indian equities were unsettled by the result of the recent election, which left the current Modi government with fewer seats. Indian equites have also gone through a period of substantial outperformance relative to the wider emerging markets, so the selloff was likely amplified by investors taking profits.
Worst performing sectors in May 2024 by total price return
| Median share price total return (%) |
Median NAV total return (%) |
Median discount 31/05/24 (%) |
Median sector market cap 31/05/24 (£m) | Number of companies in the sector | |
|---|---|---|---|---|---|
| Property – rest of world | (5.7) | 0.0 | (67.1) | 24.0 | 3 |
| Insurance & reinsurance strategies | (3.1) | (1.7) | (6.4) | 33.9 | 2 |
| Debt – direct lending | (2.7) | 0.0 | (16.1) | 122.4 | 5 |
| Japanese smaller companies | (2.4) | (0.5) | (9.1) | 245.1 | 4 |
| India/Indian Subcontinent | (1.2) | (1.0) | (13.5) | 390.2 | 4 |
Looking now at the best performing companies in terms of NAV growth, Manchester & London leads the way. This isn’t surprising given a third of the fund is invested in Nvidia, and a quarter in Microsoft, some of the biggest winners of the AI rally. These two companies were up 32% and 5% respectively over May.
The rest of the top 10 NAV performers were either infrastructure securities or UK funds, which outperformed on the back of the tailwinds that we highlighted earlier. The Premier Miton fund benefited from the gearing provided by its zero dividend preference shares.
In share price terms, the top performer, Foresight Sustainable Forestry, saw its share price surge on 29 May after it announced that it was to be acquired by Averon Park at 97p per share (a 32.9% premium to its close).
Around half of the best performers are also UK and infrastructure securities trusts.
Livermore Investments saw its share price rally on the back of its full year results, which saw a reversal of the losses it made in the prior year. Given its portfolio of fixed income assets, a fall in rate expectations would have also supported the trust. We note that the trust also has low trading volumes, which may have led it to increased sensitivity to positive news flow.
HydrogenOne Capital Growth released a positive results announcement for the first quarter of 2024, which included increased profitability for its underlying companies, up 103% on average year-on-year.
JPMorgan Emerging Europe, Middle East & Africa Securities saw its share price rally after being sold off aggressively in April when it was named as a defendant in Russian civil proceedings. In May it provided an update stating that its assets are in fact not subject to the previously announced freezing order with the civil proceedings being brought by VTB.
There was not much news surrounding Amedeo Air Four Plus, though its shares may have rallied on the back of improving interest rate expectations, given its high yield.
Best performing funds in total NAV (LHS) and share price (RHS) terms over May 2024
| Fund | Sector | (%) | Fund | Sector | (%) |
|---|---|---|---|---|---|
| Manchester & London | Global | 15.1 | Foresight Sustainable Forestry | Farmland & forestry | 44.3 |
| Invesco Perpetual UK Smaller | UK smaller companies | 11.2 | Livermore Investments | Flexible investment | 21.7 |
| Premier Miton Global Renewables Trust | Infrastructure securities | 10.5 | HydrogenOne Capital Growth | Renewable energy infrastructure | 20.6 |
| BlackRock Smaller Companies | UK smaller companies | 9.7 | Oryx International Growth | UK smaller companies | 18.6 |
| Henderson Smaller Companies | UK smaller companies | 9.0 | Rockwood Strategic | UK smaller companies | 15.8 |
| Ecofin Global Utilities & Infra | Infrastructure securities | 8.5 | JPMorgan Emerg E, ME & Africa Sec Plc | Global emerging markets | 15.4 |
| Henderson Opportunities | UK all companies | 8.4 | Amedeo Air Four Plus | Leasing | 14.7 |
| abrdn UK Smaller Companies Growth | UK smaller companies | 8.4 | Premier Miton Global Renewables Trust | Infrastructure securities | 14.6 |
| Montanaro UK Smaller Companies | UK smaller companies | 8.0 | Oryx International Growth | UK smaller companies | 18.6 |
| Odyssean Investment Trust | UK smaller companies | 8.0 | Crystal Amber | UK smaller companies | 14.0 |
Worst performing
The worst performing trusts, in NAV terms, were dominated by global emerging market strategies. However, these funds are not all global mandates, as the list includes regional trusts. The worst of these was the Gulf investment Fund. May marked an usual period of poor performance for the trust, with its NAV hit hardest in the last week of May, as the region’s markets were likely impacted by the ongoing military action in the Middle East and weakening oil price.
Ballie Gifford Shin Nippon dramatically underperformed its peers, which will come down to poor stock selection. Using data as at end May, the trust trails its benchmark by 27.6 percentage points over 12 months, 51 percentage points over three years and 47.1 percentage points over five years. The region took a risk off approach over the month, as the Bank of Japan indicated that it does not intend to intervene to stop the yen’s decline or lower the cost of borrowing. Gulf and Shin Nippon were the only two trusts to report NAV losses greater than 5%.
Blackrock Latin America’s returns are a close approximation to the wider losses of the Latin American market, which was down 4.7% over the month in sterling terms.
The wider emerging markets index was also down over the month, albeit not as much as the Gulf or Latin American regions. The broader-based decline was reflected in the performance of Fidelity Emerging Markets, Barings Emerging EMEA Opportunities, BlackRock Frontiers and JPMorgan Emerging Europe, Middle East & Africa. Part of the decline in the emerging markets (and more so Latin America) can be attributed to the ‘hawkish’ tone taken by the US Federal Reserve on US interest rates. A strong US dollar is traditionally bad news for emerging market equities.
India Capital Growth’s returns were affected by the volatility associated with the election result, but also appear to have been hit quite hard in recent months by the Securities and Exchange Board of India’s crackdown on speculative and fraudulent activity in the small and mid-cap sector.
UIL’s concentrated portfolio suffered over the month, with its two largest holdings (which make up 60% of its portfolio) down over the month.
Worst performing funds in total NAV (LHS) and share price (RHS) terms over May 2024
| Fund | Sector | (%) | Fund | Sector | (%) |
|---|---|---|---|---|---|
| Gulf Investment Fund | Global emerging markets | (7.8) | Life Science REIT | Property – UK commercial | (15.4) |
| Baillie Gifford Shin Nippon | Japanese smaller companies | (6.3) | Syncona | Biotechnology & healthcare | (11.8) |
| BlackRock Latin American | Latin America | (4.8) | Asian Energy Impact Trust | Renewable energy infrastructure | (11.5) |
| Lindsell Train | Global | (4.4) | Symphony International Holding | Private equity | (10.9) |
| JPMorgan Emerg E, ME & Africa Sec | Global emerging markets | (4.2) | VPC Specialty Lending Investments | Debt – direct lending | (9.1) |
| BlackRock Frontiers | Global emerging markets | (4.1) | Aquila Energy Efficiency Trust | Renewable energy infrastructure | (9.0) |
| India Capital Growth | India/Indian Subcontinent | (3.9) | India Capital Growth | India/Indian Subcontinent | (8.8) |
| Barings Emerging EMEA Opportunities | Global emerging markets | (3.7) | Residential Secure Income | Property – UK residential | (8.4) |
| Fidelity Emerging Markets | Global emerging markets | (2.8) | Macau Property Opportunities | Property – rest of world | (7.6) |
| UIL | Flexible investment | (2.6) | ICG-Longbow Senior Sec. UK Prop Debt Inv | Property – debt | (7.0) |
In terms of the share price performance list, property trusts were amongst the biggest losers. While higher quality UK-property assets (such as healthcare and logistics) rallied over the month, several other trusts continued their ongoing trend of widening discounts. Life Science REIT was the worst example of this, as there was no negative news released over the period, with its investment advisers actually purchasing shares in May to take advantage of the discount. This was also the case for Residential Secure Income REIT, which also had no negative announcements made over the period. ICG-Longbow Senior Secured UK Property Debt is currently being wound up, with its fall in NAV reflecting issues associated with the three loans that make up its portfolio. We covered Macau Properties earlier.
There was no negative news around Syncona over May, rather it released a positive announcement regarding the clinical trials of one of its holdings. Syncona’s negative share price returns likely reflect the large volume of trading made over the third week of May, which could be a large shareholder reducing its stake.
Asian Energy Impact Trust suspended its shares at the start of May and relisted them on the 14th, as the board required additional time to publish its annual report. The report outlined not only the fall in assets, but also the board’s intention to wind up the trust. The shares were sold off as a result.
Symphony International Holdings and VPC Specialty Lending Investments are currently being wound up. No material news was released by either company over the month, implying their negative share price returns reflected trading activities of the market rather than company-specific issues.
Aquila Energy Efficiency Trust is also in the midst of a windup, however its discount widened immediately following the completion of a tender offer on 13 May (as part of the windup).
Moves in discounts and premiums
More expensive (LHS) and cheaper (RHS) relative to NAV over May 2024
| Fund | Sector | Disc/ Prem 30/04/24 (%) |
Disc/ Prem 31/05/24 (%) |
Fund | Sector | Disc/ Prem 30/04/24 (%) |
Disc/ Prem 31/05/24 (%) |
|---|---|---|---|---|---|---|---|
| JPMorgan Emerg E, ME & Africa Sec Plc | Global emerging markets | 81.4 | 117.6 | Syncona | Biotechnology & healthcare | (33.4) | (41.2) |
| Foresight Sustainable Forestry | Farmland & forestry | (34.2) | (5.1) | Life Science REIT | Property – UK commercial | (51.1) | (58.7) |
| Oryx International Growth | UK smaller companies | (35.6) | (23.6) | Aquila Energy Efficiency Trust | Renewable energy infrastructure | (32.4) | (38.5) |
| Livermore Investments | Flexible investment | (54.0) | (44.2) | ICG-Longbow Senior Sec. UK Prop Debt Inv | Property – debt | (27.4) | (33.4) |
| HydrogenOne Capital Growth | Renewable energy infrastructure | (54.8) | (45.4) | VPC Specialty Lending Investments | Debt – direct lending | (38.9) | (45.0) |
Each of the companies featured in this list has already been discussed. On the plus side there are Foresight’s bid, JMEA’s bounce on its assets being excluded from VTB’s actions against JPMorgan, and Oryx on the UK bounce. On the negative, there is no good reason for Syncona and Life Science REIT’s discount widening.
Money raised and returned
Money raised (LHS) and returned (RHS) over May 2024 in £m
| Fund | Sector | £m raised | Fund | Sector | £m returned |
|---|---|---|---|---|---|
| JPMorgan Global Growth & Income | Global equity income | 31.5 | Scottish Mortgage | Global | (363.3) |
| Ashoka India Equity Investment | India/Indian Subcontinent | 12.6 | Smithson Investment Trust | Global smaller companies | (45.3) |
| Geiger Counter | Commodities & natural resources | 9.3 | Capital Gearing | Flexible investment | (21.1) |
| TwentyFour Select Monthly Income | Debt – loans & bonds | 3.5 | Finsbury Growth & Income | UK equity income | (18.8) |
| CQS New City High Yield | Debt – loans & bonds | 2.8 | Worldwide Healthcare | UK equity income | (16.7) |
JPMorgan Global Growth & Income once again tops the list of money raised, issuing shares on the back of the premium it traded on over May. Ashoka India Equity Investment bucked the trend of the Indian equity selloff, issuing shares on the back of its premium rating and superior medium-term performance. Geiger Counter completed the issuance of its subscription shares in May, issuing 12m new shares. TwentyFour Select Monthly Income and CQS New City High Yield both issued shares on the back of their premiums.
In terms of money being returned to investors, the usual suspects have made a repeat appearance with all but one present last month; continually repurchasing shares in an attempt to control their discounts. Worldwide Healthcare made a return to the list.
Upcoming events
Here is a selection of what is coming up. Please refer to the Events section of our website for updates between now and when they are scheduled:
Major news stories and QuotedData views over May 2024
Visit www.quoteddata.com for more on these and other stories plus in-depth analysis on some funds, the tools to compare similar funds and basic information, key documents and regulatory news announcements on every investment company quoted in London
Interviews
Have you been listening to our weekly news round-up shows? Every Friday at 11 am, we run through the more interesting bits of the week’s news, and we usually have a special guest or two answering questions about a particular investment company.
| 21 June | Quarterly panel – big discounts | Nick Greenwood, Peter Hewitt, Ben Ritchie | |
| 28 June | Nick Train | Finsbury Growth & Income | |
| 5 July | James Baker | The Investment Company | |
| 19 July | Chris Clothier | Capital Gearing |
Research
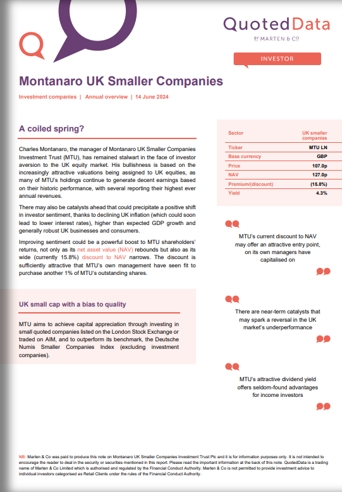
Charles Montanaro, the manager of Montanaro UK Smaller Companies Investment Trust (MTU), has remained stalwart in the face of investor aversion to the UK equity market. His bullishness is based on the increasingly attractive valuations being assigned to UK equities, as many of MTU’s holdings continue to generate decent earnings based on their historic performance, with several reporting their highest ever annual revenues. There may also be catalysts ahead that could precipitate a positive shift in investor sentiment, thanks to declining UK inflation (which could soon lead to lower interest rates), higher than expected GDP growth and generally robust UK businesses and consumers. Improving sentiment could be a powerful boost to MTU shareholders’ returns, not only as its net asset value rebounds but also as its wide discount to NAV narrows.
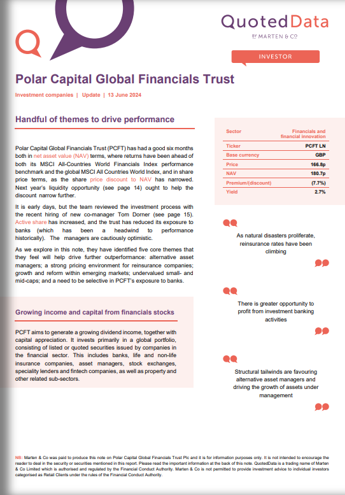
Polar Capital Global Financials Trust (PCFT) has had a good six months both in net asset value (NAV) terms, where returns have been ahead of both its MSCI All-Countries World Financials Index performance benchmark and the global MSCI All Countries World Index, and in share price terms, as the share price discount to NAV has narrowed. Next year’s liquidity opportunity (see page 12) ought to help the discount narrow further. It is early days, but the team reviewed the investment process with the recent hiring of new co-manager Tom Dorner (see page 14). Active share has increased, and the trust has reduced its exposure to banks (which has been a headwind to performance historically). The managers are cautiously optimistic.
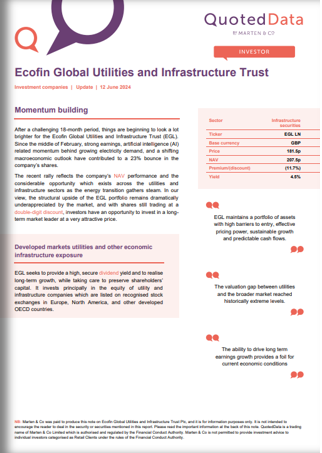
After a challenging 18-month period, things are beginning to look a lot brighter for the Ecofin Global Utilities and Infrastructure Trust (EGL). Since the middle of February, strong earnings, artificial intelligence (AI) related momentum behind growing electricity demand, and a shifting macroeconomic outlook have contributed to a 23% bounce in the company’s shares. The recent rally reflects the company’s NAV performance and the considerable opportunity which exists across the utilities and infrastructure sectors as the energy transition gathers steam. In our view, the structural upside of the EGL portfolio remains dramatically underappreciated by the market, and with shares still trading at a double-digit discount, investors have an opportunity to invest in a long-term market leader at a very attractive price.
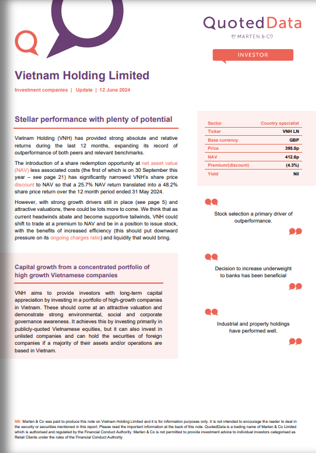
Vietnam Holding (VNH) has provided strong absolute and relative returns during the last 12 months, expanding its record of outperformance of both peers and relevant benchmarks. The introduction of a share redemption opportunity at net asset value (NAV) less associated costs (the first of which is on 30 September this year – see page 21) has significantly narrowed VNH’s share price discount to NAV so that a 25.7% NAV return translated into a 48.2% share price return over the 12 month period ended 31 May 2024. However, with strong growth drivers still in place (see page 5) and attractive valuations, there could be lots more to come. We think that as current headwinds abate and become supportive tailwinds, VNH could shift to trade at a premium to NAV and be in a position to issue stock.
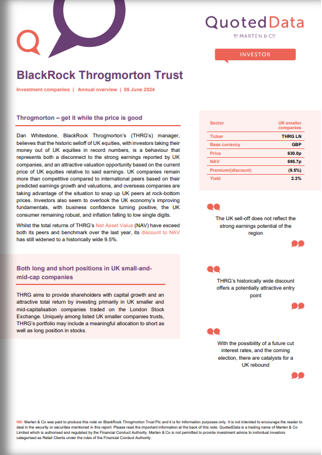
Dan Whitestone, BlackRock Throgmorton’s (THRG’s) manager, believes that the historic selloff of UK equities, with investors taking their money out of UK equities in record numbers, is a behaviour that represents both a disconnect to the strong earnings reported by UK companies, and an attractive valuation opportunity based on the current price of UK equities relative to said earnings. UK companies remain more than competitive compared to international peers based on predicted their predicted earnings growth and valuations, and overseas companies are taking advantage of the situation to snap up UK peers at rock-bottom prices. Investors also seem to overlook the UK economy’s improving fundamentals, with business confidence turning positive, the UK consumer remaining robust, and inflation falling to low single digits.
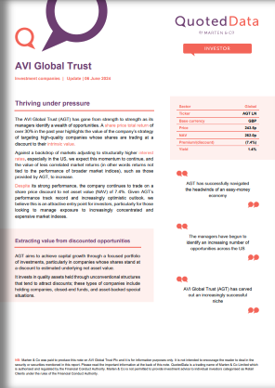
The AVI Global Trust (AGT) has gone from strength to strength as its managers identify a wealth of opportunities. A share price total return of over 30% in the past year highlights the value of the company’s strategy of targeting high-quality companies whose shares are trading at a discount to their intrinsic value. Against a backdrop of markets adjusting to structurally higher interest rates, especially in the US, we expect this momentum to continue, and the value of less correlated market returns (in other words returns not tied to the performance of broader market indices), such as those provided by AGT, to increase.
Despite its strong performance, the company continues to trade on a share price discount to net asset value (NAV) of 7.4%. Given AGT’s performance track record and increasingly optimistic outlook, we believe this is an attractive entry point for investors, particularly for those looking to manage exposure to increasingly concentrated and expensive market indexes.
Appendix 1 – median performance by sector, ranked by 2024 year to date price total return
| YTD Rank |
Sector | Share price total return YTD (%) | NAV total return YTD (%) |
Discount 30/04/24 (%) |
Discount 31/05/24 (%) |
Change in discount (%) |
Median mkt cap 31/05/24 (£m) |
| 1 | Farmland & Forestry1 | 44.3 | 3.9 | (34.2) | (5.1) | 29.2 | 166,894,393 |
| 2 | Royalties2 | 10.8 | 11.5 | 10.0 | 6.0 | (4.1) | 1,216,469,572 |
| 3 | Technology & Technology Innovation | 8.0 | 16.3 | (7.6) | (10.4) | (2.9) | 2,463,086,707 |
| 4 | Commodities & Natural Resources | 7.1 | 6.5 | (20.0) | (20.7) | (0.6) | 75,596,617 |
| 5 | Leasing | 4.7 | 6.5 | (31.7) | (30.1) | 1.6 | 133,107,920 |
| 6 | UK Smaller Companies | 4.5 | 11.5 | (11.5) | (11.5) | (0.0) | 133,143,030 |
| 7 | Debt – Structured Finance | 4.1 | 7.2 | (12.1) | (13.4) | (1.3) | 159,963,048 |
| 8 | UK All Companies | 3.9 | 11.9 | (11.8) | (10.5) | 1.4 | 214,403,378 |
| 9 | Europe | 3.7 | 8.8 | (11.0) | (9.4) | 1.5 | 456,852,463 |
| 10 | European Smaller Companies | 3.7 | 10.0 | (11.7) | (12.4) | (0.8) | 512,845,911 |
| 11 | UK Equity Income | 3.6 | 9.9 | (7.1) | (8.5) | (1.4) | 410,692,487 |
| 12 | Global | 2.8 | 8.0 | (7.9) | (8.9) | (1.0) | 1,087,939,361 |
| 13 | North America | 2.6 | 6.7 | (12.5) | (12.0) | 0.5 | 481,507,721 |
| 14 | Country Specialist | 2.6 | 10.1 | (11.4) | (10.7) | 0.7 | 426,717,632 |
| 15 | Debt – Direct Lending | 2.4 | 1.3 | (15.9) | (16.1) | (0.2) | 122,441,612 |
| 16 | Global Smaller Companies | 2.0 | 6.3 | (11.2) | (11.7) | (0.5) | 799,177,862 |
| 17 | Asia Pacific Equity Income | 1.7 | 5.7 | (8.9) | (9.1) | (0.1) | 332,953,433 |
| 18 | Debt – Loans & Bonds | 1.7 | 4.8 | (3.5) | (4.3) | (0.8) | 106,875,691 |
| 19 | Japan | 1.5 | 4.3 | (10.5) | (10.3) | 0.3 | 300,842,928 |
| 20 | UK Equity & Bond Income | 1.5 | 6.1 | (9.9) | (9.7) | 0.1 | 279,730,263 |
| 21 | China / Greater China | 1.4 | 4.9 | (10.8) | (8.5) | 2.3 | 190,949,657 |
| 22 | Global Emerging Markets | 1.3 | 2.1 | (11.3) | (10.5) | 0.8 | 217,121,317 |
| 23 | India/Indian Subcontinent | 1.3 | 5.2 | (10.6) | (13.6) | (3.0) | 390,200,610 |
| 24 | Asia Pacific | 1.2 | 4.1 | (10.0) | (9.5) | 0.6 | 560,331,336 |
| 25 | Growth Capital | 1.1 | 0.0 | (39.5) | (41.6) | (2.2) | 157,025,463 |
| 26 | Financials & Financial Innovation | 1.1 | 6.6 | (22.4) | (22.2) | 0.1 | 344,450,329 |
| 27 | Flexible Investment | 1.0 | 2.6 | (17.4) | (17.8) | (0.4) | 90,354,424 |
| 28 | Global Equity Income | 1.0 | 5.3 | (8.6) | (9.0) | (0.4) | 321,405,094 |
| 29 | Insurance & Reinsurance Strategies | 0.9 | 6.0 | (9.8) | (10.9) | (1.1) | 33,850,958 |
| 30 | Asia Pacific Smaller Companies | 0.9 | 3.8 | (16.0) | (16.0) | 0.1 | 371,848,423 |
| 31 | Private Equity | 0.4 | 1.3 | (33.5) | (33.0) | 0.4 | 488,746,946 |
| YTD Rank |
Sector | Share price total return YTD (%) | NAV total return YTD (%) |
Discount 30/04/2024 (%) |
Discount 31/05/24 (%) |
Change in discount (%) |
Median mkt cap 31/05/24 (£m) |
|---|---|---|---|---|---|---|---|
| 32 | Property – Debt | 0.3 | 0.6 | (23.4) | (18.0) | 5.3 | 52,128,138 |
| 33 | Hedge Funds | 0.1 | 0.1 | (10.4) | (9.5) | 0.9 | 86,796,317 |
| 34 | Environmental | 0.0 | 8.6 | (29.6) | (28.8) | 0.8 | 84,161,626 |
| 35 | Infrastructure Securities | 0.0 | (0.3) | (15.7) | (14.3) | 1.4 | 110,861,982 |
| 36 | Biotechnology & Healthcare | 0.0 | 0.2 | (9.2) | (9.3) | (0.1) | 515,281,518 |
| 37 | North American Smaller Companies | 0.0 | 1.1 | (10.6) | (11.7) | (1.2) | 197,952,608 |
| 38 | Property – UK Healthcare | 0.0 | 4.9 | (30.0) | (27.4) | 2.6 | 424,834,797 |
| 39 | Japanese Smaller Companies | (0.5) | (0.3) | (7.6) | (9.1) | (1.5) | 245,149,032 |
| 40 | Infrastructure | (0.8) | 1.9 | (23.4) | (22.7) | 0.7 | 819,792,771 |
| 41 | Property – Rest of World | (1.2) | 0.0 | (65.7) | (67.1) | (1.4) | 23,992,264 |
| 42 | Property – Europe | (2.4) | (5.1) | (38.9) | (39.9) | (1.0) | 256,372,449 |
| 43 | Property – UK Logistics | (2.7) | 0.0 | (29.2) | (27.6) | 1.6 | 560,706,788 |
| 44 | Property – UK Residential | (3.1) | 0.1 | (61.5) | (62.6) | (1.1) | 154,343,608 |
| 45 | Property – UK Commercial | (3.2) | 1.4 | (25.8) | (27.1) | (1.3) | 137,829,529 |
| 46 | Renewable Energy Infrastructure | (3.3) | 1.1 | (31.8) | (32.8) | (1.0) | 312,967,636 |
| 47 | Latin America | (5.7) | (14.1) | (14.0) | (12.9) | 1.1 | 108,370,999 |
| MEDIAN | 4.1 | 4.8 | (11.8) | (12.0) | (0.1) | 256,372,449 |
Guide

Our independent guide to quoted investment companies is an invaluable tool for anyone who wants to brush up on their knowledge of the investment companies’ sector. Please register on www.quoteddata.com if you would like it emailed to you directly.
IMPORTANT INFORMATION
This note was prepared by Marten & Co (which is authorised and regulated by the Financial Conduct Authority).
This note is for information purposes only and is not intended to encourage the reader to deal in the security or securities mentioned within it. Marten & Co is not authorised to give advice to retail clients. The note does not have regard to the specific investment objectives, financial situation and needs of any specific person who may receive it.
Marten & Co may have or may be seeking a contractual relationship with any of the securities mentioned within the note for activities including the provision of sponsored research, investor access or fundraising services.
This note has been compiled from publicly available information. This note is not directed at any person in any jurisdiction where (by reason of that person’s nationality, residence or otherwise) the publication or availability of this note is prohibited.
Accuracy of Content: Whilst Marten & Co uses reasonable efforts to obtain information from sources which we believe to be reliable and to ensure that the information in this note is up to date and accurate, we make no representation or warranty that the information contained in this note is accurate, reliable or complete. The information contained in this note is provided by Marten & Co for personal use and information purposes generally. You are solely liable for any use you may make of this information. The information is inherently subject to change without notice and may become outdated. You, therefore, should verify any information obtained from this note before you use it.
No Advice: Nothing contained in this note constitutes or should be construed to constitute investment, legal, tax or other advice.
No Representation or Warranty: No representation, warranty or guarantee of any kind, express or implied is given by Marten & Co in respect of any information contained in this note.
Exclusion of Liability: To the fullest extent allowed by law, Marten & Co shall not be liable for any direct or indirect losses, damages, costs or expenses incurred or suffered by you arising out or in connection with the access to, use of or reliance on any information contained in this note. In no circumstance shall Marten & Co and its employees have any liability for consequential or special damages.
Governing Law and Jurisdiction: These terms and conditions and all matters connected with them, are governed by the laws of England and Wales and shall be subject to the exclusive jurisdiction of the English courts. If you access this note from outside the UK, you are responsible for ensuring compliance with any local laws relating to access.
No information contained in this note shall form the basis of, or be relied upon in connection with, any offer or commitment whatsoever in any jurisdiction.
Investment Performance Information: Please remember that past performance is not necessarily a guide to the future and that the value of shares and the income from them can go down as well as up. Exchange rates may also cause the value of underlying overseas investments to go down as well as up. Marten & Co may write on companies that use gearing in a number of forms that can increase volatility and, in some cases, to a complete loss of an investment.