September 2024
Monthly | Investment companies
Kindly sponsored by abrdn
Winners and losers in August 2024
Interest rates were the driving force behind markets in August, with the Bank of England finally making its first interest rate cut since it began its hiking cycle in January 2022. In their August meeting, the Bank of England elected to cut rates by 0.25% to 5.0%. And while the US is yet to cut interest rates, Jerome Powell made a formal comment that interest rate cuts were ‘on the cards’. Though the move may be relatively small, it represents a clear shift in direction with interest rate-sensitive assets rallying in response. August also saw the AI story finally begin to lose some of its steam, given the market’s cool response to Nvidia’s strong earnings, which sent ripples through the US and wider technology sector.
In terms of the best performing sectors, the UK property market dominated, given how sensitive the asset class is to interest rates. UK residential property moved the most, likely a reflection of how wide the sector’s discount was going into the month, amplifying its sensitivity to positive news. The rate cuts also had similar effects on the UK healthcare and UK commercial property sectors; though these were also likely supported by an improving outlook for the UK economy as well as the political stability provided by the new Labour government.
Infrastructure securities also benefited from falling rates, thanks to their inherently bond-like revenue stream (due to their predictable and regulated revenues). Debt – structured finance also rallied, given the inverse relationship between bond prices and interest rates. The structure finance sector also benefited from the fact that it is one of the more conventional debt asset classes, likely perceived to be a more immediate beneficiary of lower rates (when compared to direct lending strategies).
Best performing sectors in August 2024 by total price return
| Median share price total return (%) |
Median NAV total return (%) |
Median discount 31/08/24 (%) |
Median sector market cap 31/08/24 (£m) | Number of companies in the sector | |
|---|---|---|---|---|---|
| Property – UK residential | 4.2 | 0.0 | (55.5) | 177 | 6 |
| Property – UK healthcare | 4.0 | 1.4 | (25.7) | 443 | 2 |
| Infrastructure securities | 1.6 | 0.5 | (12.3) | 111 | 2 |
| Property – UK commercial | 1.5 | 0.0 | (17.8) | 212 | 11 |
| Debt – structured finance | 0.7 | 1.5 | (12.0) | 152 | 6 |
Source: Morningstar, Marten & Co. Note: inclusive of sectors with at least two companies. Note: many alternative asset sector funds release NAV performance on a quarterly basis
On the downside, US smaller companies led the way. Their selloff was a result of a conflux of factors increasing the risks associated with the asset class: a rise in US unemployment, the political upheaval that came as a result of Joe Biden’s resignation, as well as the fallout from the stalling AI-stock rally. The poor performance of the Global Smaller companies sector was also a result of the US selloff, given how large a component of the universe US companies are.
China continues to be a perennial underperformer, having been a regular constituent of the worst performing sector list over 2024. The region’s economy has yet to show material signs of reversing the issues impacting its growth (such as deflation, weak consumer demand, and falling real estate prices), despite the CCP’s attempts to shore up asset prices. There was also a sense that US trade tensions could pick up if Trump secures the US Presidency.
US technology stocks sold off as a result of investors taking profits on the previous ‘AI winners’. Nvidia’s earnings had the largest impact on the sector’s performance, failing to impress analysts despite their positive growth, with Super Micro Computer also selling off after being accused of fraud.
Private equity was a mixed bag of performance, a blend of strong positive and negative share price performance over the month, though ultimately outweighed by the latter. We would have expected that an improving interest rate outlook would have been a net positive for the sector, but it seems that the market is seeking greater clarity before re-rating the sector as a whole.
Worst performing sectors in August 2024 by total price return
| Median share price total return (%) |
Median NAV total return (%) |
Median discount 31/08/24 (%) |
Median sector market cap 31/08/24 (£m) | Number of companies in the sector | |
|---|---|---|---|---|---|
| North American smaller companies | (6.3) | (2.1) | (10.2) | 207 | 2 |
| China / greater China | (5.4) | (2.8) | (12.4) | 159 | 3 |
| Technology & technology innovation | (5.1) | (1.1) | (12.4) | 2,432 | 2 |
| Private equity | (5.0) | 0.0 | (33.7) | 493 | 18 |
| Global smaller companies | (4.6) | (1.3) | (11.6) | 797 | 5 |
Source: Morningstar, Marten & Co. Note: inclusive of sectors with at least two companies. Note: many alternative asset sector funds release NAV performance on a quarterly basis
Best performing
Bellevue Healthcare Trust led the pack thanks to a combination of company-specific factors and the supportive trends behind healthcare allowing the sector to grow in the face of wider uncertainty. The trust is also a beneficiary of the positive effects of an improving interest rate outlook, with its portfolio’s bias to small and mid-cap companies. For similar reasons, we also find Worldwide Healthcare within our top performers.
Lindsell Train made a notable reversal of the previous underperformance this month, capitalising on the rally in UK equities. The high-quality UK equities in its portfolio, and by extension its holding in its own management company, are primed to benefit from falling UK interest rates.
Golden Prospect’s Precious Metal’s performance was a reflection of the rally in the price of gold, which broke $2,500 an ounce for the first time in August.
Manchester & London was a rare winner amongst the technology sector. More than 50% of its portfolio is held in Nvidia and Microsoft, both of which were up over the month. The selloff in Nvidia in the latter days of August was insufficient to offset the gains it made at the start of the month.
Hansa Investment Company’s performance was a reflection of its largest holding, Ocean Wilsons Holdings, which makes up a quarter of its portfolio. Ocean Wilsons Holdings rallied c.12% after it announced it was in discussions to sell one of its companies.
Middlefield Canadian Income is benefiting from lower interest rates, its portfolio has substantial exposure to real estate.
Montanaro European Smaller Companies NAV moves can be attributed to the positive share price performance from its largest holding, MTU Aero Engines, and some other sizeable positions.
We covered the debt – structured finance sector above.
In terms of the share price moves, PRS REIT is facing a shareholder rebellion aimed at narrowing its discount and improving corporate governance.
With respect to the Doric Nimrod Air Three and Air Two fund, both of these funds rallied after Emirates announced that it would purchase five Airbus A380 aircraft from Air Two for $40m each. The upward valuation of the aircraft seems to have also been reflected in Air Three’s NAV. Note that after the sales of these Aircraft, Air Two will be put into liquidation.
Best performing funds in total NAV (LHS) and share price (RHS) terms over August 2024
| Fund | Sector | (%) | Fund | Sector | (%) |
|---|---|---|---|---|---|
| Bellevue Healthcare | Biotechnology & healthcare | 8.5 | PRS REIT | Property – UK residential | 16.7 |
| Lindsell Train | Global | 6.3 | Doric Nimrod Air Three | Leasing | 15.2 |
| Golden Prospect Precious Metal | Commodities & natural resources | 6.0 | Doric Nimrod Air Two | Leasing | 13.7 |
| Manchester & London | Global | 5.5 | Octopus Renewables Infrastructure | Renewable energy infrastructure | 8.8 |
| Hansa Investment Company | Flexible investment | 4.6 | Residential Secure Income | Property – UK residential | 8.5 |
| Worldwide Healthcare | Biotechnology & healthcare | 4.5 | Triple Point Social Housing REIT | Property – UK residential | 8.4 |
| Middlefield Canadian Income | North America | 3.1 | Golden Prospect Precious Metal | Commodities & natural resources | 7.5 |
| Montanaro European Smaller Companies | European smaller companies | 2.8 | JPMorgan Global Core Real Assets | Flexible investment | 7.4 |
| Chenavari Toro Income Fund | Debt – structured finance | 2.5 | Bellevue Healthcare | Biotechnology & healthcare | 6.6 |
| Blackstone Loan Financing | Debt – structured finance | 2.5 | EJF Investments | Debt – structured finance | 6.6 |
Source: Morningstar, Marten & Co. Note: excludes trusts with market caps below £15m at 31/08/24
JPMorgan Global Core Real Assets may have been seen as a beneficiary of lowering rates; as real assets, like infrastructure, tend to have predictable revenues and thus bond-like return characteristics. Which by extension makes them more attractive when interest rates are lowered. However, we note that, since the end of August, it has lost its continuation vote and it may just be that investors were expecting this result.
Worst performing
Geiger Counter continues to suffer from the fall in the price of uranium, having been amongst the worst performing trusts in our last monthly roundup.
NB Distressed Debt Extended Life is in wind down mode. In its interim report, published towards the end of the month, the board cautioned that realisations were taking longer than it had hoped.
Fidelity Japan Trust and CC Japan Income & Growth’s performance reflected the wider selloff of Japanese equities over August. Japanese equities fell on the back of the unwinding of the yen carry trade, after it become apparent that the Japanese central bank was taking a more hawkish tone than its developed market peers, which lead to not only higher borrowing costs but also a stronger yen.
Third Point Investors’s performance reflects big positions in Alphabet and Amazon, which were weak in August.
We have covered the trends impacting JPMorgan China’s performance previously.
Weiss Korea’s performance reflected the wide Korean equity market, which was down 2.0% over August. Its performance reflected the wider weakness in the technology sector over the month, with Korea being a key country in the industry’s supply chain.
BlackRock World Mining’s performance reflects the ongoing weakness of the broader commodity market, with many commodities prices down over the month of August.
Aberforth Geared Value & Income and Rights & Issues Investment Trust were the worst performers of the UK small cap sector, both on stock specific factors.
Worst performing funds in total NAV (LHS) and share price (RHS) terms over August 2024
| Fund | Sector | (%) | Fund | Sector | (%) |
|---|---|---|---|---|---|
| Geiger Counter | Commodities & natural resources | (14.0) | JPMorgan Emerg E, ME & Africa Sec Plc | Global emerging markets | (18.2) |
| NB Distressed Debt Extended Life | Debt – loans & bonds | (7.8) | Symphony International Holding | Private equity | (15.2) |
| Fidelity Japan Trust | Japan | (7.4) | Schiehallion Fund | Growth capital | (14.1) |
| Third Point Investors USD | Hedge funds | (6.3) | HydrogenOne Capital Growth | Renewable energy infrastructure | (13.0) |
| CC Japan Income & Growth | Japan | (5.8) | RTW Biotech Opportunities | Biotechnology & healthcare | (12.2) |
| JPMorgan China Growth & Income | China / greater China | (4.9) | Gresham House Energy Storage | Renewable energy infrastructure | (10.9) |
| Weiss Korea Opportunity | Country specialist | (4.7) | Edinburgh Worldwide | Global smaller companies | (9.4) |
| BlackRock World Mining Trust | Commodities & natural resources | (4.5) | JZ Capital Partners | Private equity | (9.3) |
| Aberforth Geared Value & Income | UK smaller companies | (4.4) | Digital 9 Infrastructure | Infrastructure | (8.8) |
| Rights & Issues Investment Trust | UK smaller companies | (4.3) | ICG Enterprise Trust | Private equity | (8.5) |
Source: Morningstar, Marten & Co. Note: excludes trusts with market caps below £15m at 31/08/24
With respect to the largest share prices losses over the month, JPMorgan Emerging Europe, Middle East, and Africa lead the pack. Its losses likely reflect its legacy Russian holdings, which are not included in its NAV valuations, with the escalation of the Ukrainian conflict likely dragging on the trust.
The turbulence in markets in the early part of the month seems to have led investors to become more risk averse. Many of these funds including Schiehallion and its sister fund Edinburgh Worldwide may have been caught by this. Symphony International Holdings share price decline was likely a result of its negative NAV returns over the month.
There was no negative news surrounding HydrogenOne Capital Growth, rather it posted a positive quarterly trading update at the end of July. Its share price movements likely reflected investor confidence in the wider hydrogen industry as a whole. It was also a similar story for Gresham House Energy Storage, as there was no negative press surrounding this trust either, rather it announced that its portfolio had passed a key milestone, having achieved an operational capacity of 1GWh.
The selloff in RTW Biotech Opportunities was a reflection of the selloff in US small cap equities, given 70% of its portfolio is invested in North America.
JZ Capital Partners and Digital 9 Infrastructure are in the process of being wound up and their share price losses likely reflect investors’ frustrations with the pace of asset sales (although Digital 9 has since published a savage cut to its NAV).
There was no negative news from ICG Enterprise Trust, though with 42% of its portfolio invested in US companies, it may have also been a casualty of the US small-cap selloff.
Moves in discounts and premiums
More expensive (LHS) and cheaper (RHS) relative to NAV over July 2024
| Fund | Sector | Disc/ Prem 31/07/24 (%) |
Disc/ Prem 31/08/24 (%) |
Fund | Sector | Disc/ Prem 37/07/24 (%) |
Disc/ Prem 31/08/24 (%) |
|---|---|---|---|---|---|---|---|
| Doric Nimrod Air Three | Leasing | 20.1 | 36.2 | JPMorgan Emerg E, ME & Africa Sec | Global emerging markets | 192.5 | 141.8 |
| Doric Nimrod Air Two | Leasing | (7.0) | 4.5 | Schiehallion Fund | Growth capital | (11.7) | (22.7) |
| PRS REIT | Property – UK residential | (33.9) | (23.3) | RTW Biotech Opportunities | Biotechnology & healthcare | (16.1) | (24.6) |
| Geiger Counter | Commodities & natural resources | (21.7) | (14.7) | Manchester & London | Global | (9.6) | (17.3) |
| Life Settlement Assets A | Insurance & reinsurance strategies | (22.5) | (16.3) | Edinburgh Worldwide | Global smaller companies | (5.0) | (11.9) |
Source: Morningstar, Marten & Co
Most of these trusts have been discussed already. Geiger Counter’s discount has run contrary to its NAV performance, which may reflect investor expectations around future price movements in uranium. Life Settlement Assets’ discount narrowed after receiving the first tranche of income from one of its policies, with investors likely front running the forthcoming NAV increase.
Manchester & London’s discount also ran contrary to its positive NAV performance, as investors are likely discounting the trust in light of the increasing apprehension to Nvidia and the AI ‘winners’ as a whole, with Nvidia’s share price declining towards the end of August. The trust recently announced that it had adopted a new management fee, which should ultimately benefit its rating.
Money raised and returned
Money raised (LHS) and returned (RHS) over August 2024 in £m
| Fund | Sector | £m raised | Fund | Sector | £m returned |
|---|---|---|---|---|---|
| JPMorgan Global Growth & Income | Global Equity Income | 16.1 | Scottish Mortgage | Global | (101.6) |
| CQS New City High Yield | Debt – Loans & Bonds | 4.9 | Smithson Investment Trust | Global Smaller Companies | (33.5) |
| Ashoka India Equity Investment | India/Indian Subcontinent | 4.5 | Monks | Global | (27.5) |
| Rockwood Strategic | UK Smaller Companies | 4.3 | F&C Investment Trust | Global | (26.7) |
| TwentyFour Select Monthly Income | Debt – Loans & Bonds | 3.0 | Finsbury Growth & Income | UK Equity Income | (23.9) |
Source: Morningstar, Marten & Co. Note: excludes trusts with market caps below £15m at 31/08/24. Note: based on the approximate value of shares at 31/08/24
In terms of money raised, all of these trusts were able to issue money on the back of the premium rating, with these trusts being regular members of the list.
Likewise, it was largely the usual cohort for money being returned, as they continue to buy back shares in an attempt to tackle wide discounts.
Upcoming events
Here is a selection of what is coming up. Please refer to the Events section of our website for updates between now and when they are scheduled:
- Monks AGM – 10/09/2024
- Warehouse REIT AGM – 11/09/2024
- Polar Capital Technology AGM – 11/09/2024
- TwentyFour Income AGM – 12/09/2024
- Oakley Capital Investments Shareholder presentation – 12/09/2024
- Baker Steel Resources AGM – 12/09/2024
- Invesco Asia AGM – 12/09/2024
- JLEN Environmental Assets Group AGM – 13/09/2024
- Home REIT General meeting – 16/09/2024
- Greencoat UK Wind Shareholder presentation – 16/09/2024
- Greencoat Renewables Shareholder presentation – 16/09/2024
- Schroder Real Estate AGM – 16/09/2024
- HydrogenOne Capital Growth Shareholder presentation – 16/09/2024
- EJF Investments Shareholder presentation – 17/09/2024
- Worsley Investors AGM – 18/09/2024
- Gore Street Energy Storage AGM – 18/09/2024
- Real Estate Credit Investments AGM – 18/09/2024
- MIGO Opportunities AGM – 18/09/2024
- Schroder British Opportunities AGM – 18/09/2024
- Castelnau Group AGM – 18/09/2024
- Augmentum Fintech AGM – 19/09/2024
- abrdn New India AGM – 20/09/2024
- Miton UK Microcap AGM – 24/09/2024
- Boussard & Gavaudan Holding AGM – 25/09/2024
- RM Infrastructure Income General meeting – 25/09/2024
- Life Science REIT Shareholder presentation – 26/09/2024
- Baillie Gifford US Growth AGM – 27/09/2024
Major news stories and QuotedData views over August 2024
Visit www.quoteddata.com for more on these and other stories plus in-depth analysis on some funds, the tools to compare similar funds and basic information, key documents and regulatory news announcements/ on every investment company quoted in London
Portfolio developments
- Rights and Issues fast out of the gates in 2024
- Portfolio development driving strong returns for DORE
- Challenging start to the year but optimism remains for Impax Environmental Markets
- JLEN Environmental sells slice of AD portfolio to firm backed by 3i Infrastructure
- Caledonia Investments adds to portfolio through stake in Direct Tyre Management
- Diverse Income hopes that the tide has turned in its favour
- Narrowing discount offsets Baillie Gifford US Growth underperformance
- Apax Global Alpha invests in Veriforce through Apax XI
- Chelverton UK Dividend battles on during difficult environment for UK small and mid caps
- Downing Renewables & Infrastructure acquires three Swedish hydropower plants
- Oakley Capital sells Ocean Technologies Group
Corporate news
- Pantheon International outlines next phase of its corporate strategy
- Hargreaves Lansdown bid to boost Finsbury Growth and Income
- Literacy Capital backs Campfire
- Pershing Square Holdings trails market in H1, while IPO withdrawn
- Doric Nimrod Air Two sells five Airbus aircraft to Emirates for $200m
- Harmony Energy Income confirms strong interest in its assets
- Life Settlement Assets updates on Mutual Benefit Keep Trust settlement
- Murray Income announces a reduction in management fee
- Artemis Alpha and Aurora to merge
- JPMorgan Global Core Real Assets fails to pass continuation vote
- Manchester and London announces new management fee structure
- JPMorgan European Discovery tender four times oversubscribed
Property News
Portfolio developments
QD views
Visit www.quoteddata.com for more on these and other stories plus in-depth analysis on some funds, the tools to compare similar funds and basic information, key documents and regulatory news announcements on every investment company quoted in London
Interviews
Have you been listening to our weekly news round-up shows? Every Friday at 11 am, we run through the more interesting bits of the week’s news, and we usually have a special guest or two answering questions about a particular investment company.
Research
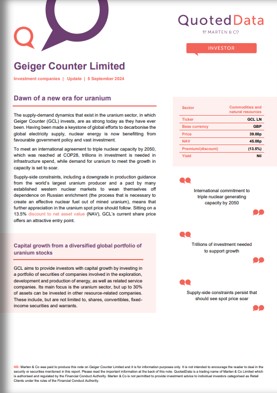
The supply-demand dynamics that exist in the uranium sector, in which Geiger Counter (GCL) invests, are as strong today as they have ever been. Having been made a keystone of global efforts to decarbonise the global electricity supply, nuclear energy is now benefitting from favourable government policy and vast investment. To meet an international agreement to triple nuclear capacity by 2050, which was reached at COP28, trillions in investment is needed in infrastructure spend, while demand for uranium to meet the growth in capacity is set to soar. Supply-side constraints, including a downgrade in production guidance from the world’s largest uranium producer and a pact by many established western nuclear markets to wean themselves off dependence on Russian enrichment, means that further appreciation in the uranium spot price should follow. Sitting on a 13.5% discount makes GCL’s share price an attractive entry point.
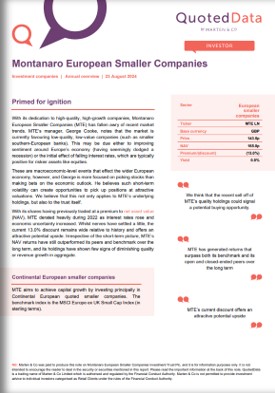
With its dedication to high-quality, high-growth companies, Montanaro European Smaller Companies (MTE) has fallen awry of recent market trends. MTE’s manager, George Cooke, notes that the market is currently favouring low-quality, low-value companies (such as smaller southern-European banks). This may be due either to improving sentiment around Europe’s economy (having seemingly dodged a recession) or the initial effect of falling interest rates, which are typically positive for riskier assets like equities. These are macroeconomic-level events that effect the wider European economy, however, and George is more focused on picking stocks than making bets on the economic outlook. He believes such short-term volatility can create opportunities to pick up positions at attractive valuations. We believe that this not only applies to MTE’s underlying holdings, but also to the trust itself. Whilst nerves have settled a little, the current 13.0% discount remains wide relative to history and offers an attractive potential upside. Irrespective of the short-term picture, MTE’s NAV returns have still outperformed its peers and benchmark over the long term, and its holdings have shown few signs of diminishing quality or revenue growth in aggregate.
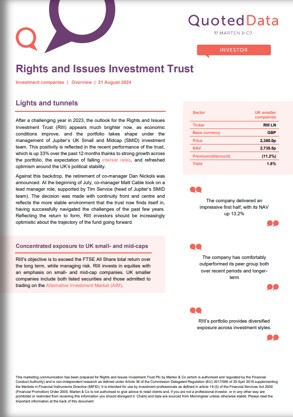
After a challenging year in 2023, the outlook for the Rights and Issues Investment Trust (RIII) appears much brighter now, as economic conditions improve, and the portfolio takes shape under the management of Jupiter’s UK Small and Midcap (SMID) investment team. This positivity is reflected in the recent performance of the trust, which is up 33% over the past 12 months thanks to strong growth across the portfolio, the expectation of falling interest rates, and refreshed optimism around the UK’s political stability.
Against this backdrop, the retirement of co-manager Dan Nickols was announced. At the beginning of July, co-manager Matt Cable took on a lead manager role, supported by Tim Service (head of Jupiter’s SMID team). The decision was made with continuity front and centre and reflects the more stable environment that the trust now finds itself in, having successfully navigated the challenges of the past few years. Reflecting the return to form, RIII investors should be increasingly optimistic about the trajectory of the fund going forward.
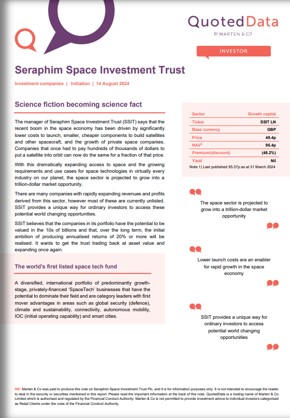
The manager of Seraphim Space Investment Trust (SSIT) says that the recent boom in the space economy has been driven by significantly lower costs to launch, smaller, cheaper components to build satellites and other spacecraft, and the growth of private space companies. Companies that once had to pay hundreds of thousands of dollars to put a satellite into orbit can now do the same for a fraction of that price.
With this dramatically expanding access to space and the growing requirements and use cases for space technologies in virtually every industry on our planet, the space sector is projected to grow into a trillion-dollar market opportunity.There are many companies with rapidly expanding revenues and profits derived from this sector, however most of these are currently unlisted. SSIT provides a unique way for ordinary investors to access these potential world changing opportunities.
Baillie Gifford UK Growth Trust (BGUK) has had a challenging three years, but with interest rates falling, this heavily growth-focused trust could be set for a significant period of outperformance (an environment of higher interest rates tends to be negative for most equities but particularly growth investments which tend to have a higher proportion of their value discounted back from some point in the future – a reversal of this could drive a rerating of growth stocks). The scale of the opportunity and the board’s conviction in the managers to deliver on this is such that, if shareholders approve continuation at this year’s annual general meeting (AGM), the board is proposing that if performance does not turn around, it will offer shareholders an opportunity to realise their investment in full at a price close to NAV in 2029. In addition, they are saying that they will hold an extra continuation vote in 2027.
GInfrastructure Investments Ltd (GCP) had a difficult 2023, as the infrastructure sector dealt with rising interest rates and stubborn inflation. However, 2024 brought an improving economic outlook, the prospect of a reversal in interest rate policy, and – for GCP’s shareholders – a highly attractive dividend yield, solid portfolio execution, and the introduction of a capital recycling programme (where the adviser looks to realise existing assets to fund capital returns and new investment).
So far, this programme has allowed the company to significantly reduce leverage and begin returning capital to shareholders. It has also enabled GCP to start the process of restructuring the portfolio to take advantage of an increasingly attractive investment environment, reduce its exposure to merchant power prices (electricity sold into wholesale markets rather than at fixed prices), and exit some of its legacy positions. GCP remains well positioned to capitalise on this opportunity thanks to the ongoing resilience of its cash flows over the last few years. This has provided the foundation for the current capital programme and leaves the adviser in a strong position to rebalance the portfolio.
The scale of the outperformance delivered by AVI Japan Opportunity Trust (AJOT) versus its MSCI Japan Small Cap benchmark is impressive (38 percentage points since launch) and demonstrates the success of its efforts to promote good corporate governance within the stocks in its portfolio. The manager says that Japanese corporates have become less resistant to change, but there is still a lot to do. It is important to note that AJOT’s success has come despite a weak currency, small-cap underperformance (small caps are AJOT’s hunting ground), and foreign investors still having a substantial underweight exposure to Japanese equities. These factors could swing in AJOT’s favour, but the manager believes that AJOT can thrive regardless. We feel that AJOT’s performance and prospects are such that its shares should be trading at asset value and expanding. Currently it trades on a discount of 4.8%.
Appendix 1 – median performance by sector, ranked by 2024 year to date price total return
| YTD Rank |
Sector | Share price total return YTD (%) | NAV total return YTD (%) |
Discount 31/07/24 (%) |
Discount 31/08/24 (%) |
Change in discount (%) |
Median mkt cap 31/08/24 (£m) |
|---|---|---|---|---|---|---|---|
| 1 | Leasing | 25.3 | 8.7 | (30.9) | (31.5) | (0.5) | 151,341,882 |
| 2 | Debt – Structured Finance | 15.7 | 6.3 | (11.9) | (12.0) | (0.1) | 152,213,235 |
| 3 | Technology & Technology Innovation | 14.1 | 17.7 | (8.5) | (12.4) | (3.8) | 2,431,877,703 |
| 4 | India/Indian Subcontinent | 13.8 | 15.4 | (13.3) | (13.4) | (0.1) | 431,517,001 |
| 5 | UK Smaller Companies | 13.6 | 12.6 | (8.4) | (10.1) | (1.6) | 112,763,788 |
| 6 | UK All Companies | 12.3 | 13.3 | (8.5) | (11.8) | (3.3) | 219,936,368 |
| 7 | UK Equity Income | 11.1 | 12.9 | (7.2) | (8.6) | (1.4) | 413,223,242 |
| 8 | UK Equity & Bond Income | 10.9 | 10.8 | (9.6) | (9.2) | 0.4 | 289,198,056 |
| 9 | Japan | 10.8 | 11.1 | (11.0) | (11.5) | (0.5) | 300,905,094 |
| 10 | Debt – Direct Lending | 9.4 | 2.8 | (16.9) | (16.5) | 0.4 | 120,493,678 |
| 11 | Debt – Loans & Bonds | 8.7 | 6.9 | (0.2) | (1.6) | (1.4) | 133,800,296 |
| 12 | Financials & Financial Innovation | 8.6 | 12.0 | (21.1) | (21.9) | (0.8) | 357,667,188 |
| 13 | European Smaller Companies | 8.5 | 6.2 | (9.4) | (12.6) | (3.3) | 478,622,637 |
| 14 | Asia Pacific Equity Income | 8.3 | 7.4 | (8.1) | (9.5) | (1.4) | 332,013,493 |
| 15 | Global Smaller Companies | 8.2 | 9.5 | (9.2) | (11.6) | (2.5) | 797,024,462 |
| 16 | Japanese Smaller Companies | 8.2 | 8.7 | (9.0) | (9.3) | (0.2) | 261,292,634 |
| 17 | Global | 8.1 | 9.3 | (7.4) | (8.8) | (1.4) | 1,040,917,810 |
| 18 | North America | 7.9 | 9.3 | (11.1) | (12.4) | (1.3) | 483,631,699 |
| 19 | Asia Pacific | 7.5 | 7.6 | (8.7) | (11.1) | (2.4) | 525,721,721 |
| 20 | Biotechnology & Healthcare | 7.5 | 9.7 | (9.3) | (11.0) | (1.7) | 555,624,483 |
| 21 | Hedge Funds | 6.8 | 1.3 | (8.4) | (9.6) | (1.3) | 84,257,502 |
| 22 | Global Emerging Markets | 6.8 | 5.0 | (10.4) | (12.2) | (1.9) | 216,653,136 |
| 23 | Asia Pacific Smaller Companies | 6.8 | 7.2 | (13.7) | (14.1) | (0.4) | 346,593,160 |
| 24 | Europe | 6.7 | 8.4 | (7.8) | (11.6) | (3.8) | 590,074,167 |
| 25 | Growth Capital | 6.0 | 0.0 | (42.3) | (43.4) | (1.0) | 128,087,235 |
| 26 | Global Equity Income | 5.8 | 7.2 | (5.2) | (8.9) | (3.7) | 321,405,094 |
| 27 | Insurance & Reinsurance Strategies | 5.7 | 2.6 | (9.2) | (6.1) | 3.1 | 34,435,490 |
| 28 | Country Specialist | 4.3 | 9.6 | (11.4) | (13.6) | (2.2) | 409,065,689 |
| 29 | Infrastructure Securities | 4.2 | 1.8 | (14.7) | (12.3) | 2.5 | 111,391,403 |
| 30 | Flexible Investment | 3.5 | 3.0 | (21.8) | (19.4) | 2.4 | 91,200,000 |
| 31 | North American Smaller Companies | 3.5 | 4.3 | (6.1) | (10.2) | (4.1) | 207,256,728 |
| YTD Rank |
Share price total return YTD (%) | NAV total return YTD (%) |
Discount 30/06/2024 (%) |
Discount 31/07/24 (%) |
Change in discount (%) |
Median mkt cap 31/07/24 (£m) |
|
|---|---|---|---|---|---|---|---|
| 32 | Property – UK Healthcare | 3.3 | 7.7 | (27.9) | (25.7) | 2.2 | 442,825,624 |
| 33 | Commodities & Natural Resources | 3.0 | 0.0 | (21.7) | (14.7) | 7.1 | 60,009,917 |
| 34 | Private Equity | 2.3 | 1.2 | (30.0) | (33.7) | (3.7) | 493,137,093 |
| 35 | Property – Debt | 1.2 | 1.5 | (22.9) | (26.4) | (3.5) | 48,054,995 |
| 36 | Property – Europe | 1.0 | (5.0) | (38.8) | (38.3) | 0.5 | 251,426,357 |
| 37 | Environmental | (0.9) | 4.6 | (22.7) | (18.1) | 4.7 | 78,036,751 |
| 38 | Infrastructure | (1.1) | 4.1 | (20.6) | (23.0) | (2.3) | 827,527,074 |
| 39 | Property – UK Logistics | (1.9) | 3.3 | (21.9) | (24.7) | (2.8) | 567,314,444 |
| 40 | Property – UK Residential | (1.9) | 0.0 | (56.4) | (55.5) | 0.8 | 176,528,272 |
| 41 | Property – UK Commercial | (2.3) | 4.5 | (19.8) | (17.8) | 2.0 | 212,336,118 |
| 42 | Renewable Energy Infrastructure | (4.5) | 0.2 | (27.2) | (25.5) | 1.7 | 304,459,708 |
| 43 | Property – Rest of World | (9.7) | (3.0) | (69.6) | (69.6) | 0.0 | 20,653,135 |
| 44 | China / Greater China | (10.6) | (8.0) | (11.2) | (12.4) | (1.1) | 158,750,303 |
| 45 | Latin America | (19.7) | (20.7) | (8.9) | (11.2) | (2.3) | 101,303,325 |
| MEDIAN | 6.8 | 6.3 | (11.2) | (12.4) | (1.3) | 261,292,634 |
Source: Morningstar, Marten & Co. Note 1) BlackRock Latin America is the only remaining trust in the Latin America Sector.
Guide

Our independent guide to quoted investment companies is an invaluable tool for anyone who wants to brush up on their knowledge of the investment companies’ sector. Please register on www.quoteddata.com if you would like it emailed to you directly.
IMPORTANT INFORMATION
This note was prepared by Marten & Co (which is authorised and regulated by the Financial Conduct Authority).
This note is for information purposes only and is not intended to encourage the reader to deal in the security or securities mentioned within it. Marten & Co is not authorised to give advice to retail clients. The note does not have regard to the specific investment objectives, financial situation and needs of any specific person who may receive it.
Marten & Co may have or may be seeking a contractual relationship with any of the securities mentioned within the note for activities including the provision of sponsored research, investor access or fundraising services.
This note has been compiled from publicly available information. This note is not directed at any person in any jurisdiction where (by reason of that person’s nationality, residence or otherwise) the publication or availability of this note is prohibited.
Accuracy of Content: Whilst Marten & Co uses reasonable efforts to obtain information from sources which we believe to be reliable and to ensure that the information in this note is up to date and accurate, we make no representation or warranty that the information contained in this note is accurate, reliable or complete. The information contained in this note is provided by Marten & Co for personal use and information purposes generally. You are solely liable for any use you may make of this information. The information is inherently subject to change without notice and may become outdated. You, therefore, should verify any information obtained from this note before you use it.
No Advice: Nothing contained in this note constitutes or should be construed to constitute investment, legal, tax or other advice.
No Representation or Warranty: No representation, warranty or guarantee of any kind, express or implied is given by Marten & Co in respect of any information contained in this note.
Exclusion of Liability: To the fullest extent allowed by law, Marten & Co shall not be liable for any direct or indirect losses, damages, costs or expenses incurred or suffered by you arising out or in connection with the access to, use of or reliance on any information contained in this note. In no circumstance shall Marten & Co and its employees have any liability for consequential or special damages.
Governing Law and Jurisdiction: These terms and conditions and all matters connected with them, are governed by the laws of England and Wales and shall be subject to the exclusive jurisdiction of the English courts. If you access this note from outside the UK, you are responsible for ensuring compliance with any local laws relating to access.
No information contained in this note shall form the basis of, or be relied upon in connection with, any offer or commitment whatsoever in any jurisdiction.
Investment Performance Information: Please remember that past performance is not necessarily a guide to the future and that the value of shares and the income from them can go down as well as up. Exchange rates may also cause the value of underlying overseas investments to go down as well as up. Marten & Co may write on companies that use gearing in a number of forms that can increase volatility and, in some cases, to a complete loss of an investment.