
Doing good, globally?
Launched in September 2024, BNP Paribas Easy ESG Enhanced World UCITS ETF (AWDS) is an active ETF that offers exposure to a portfolio of global developed market equities, while incorporating environmental, social and governance (ESG) criteria into its portfolio construction. The stated aim is to provide incremental improvements in quality, resilience and long-term return potential.
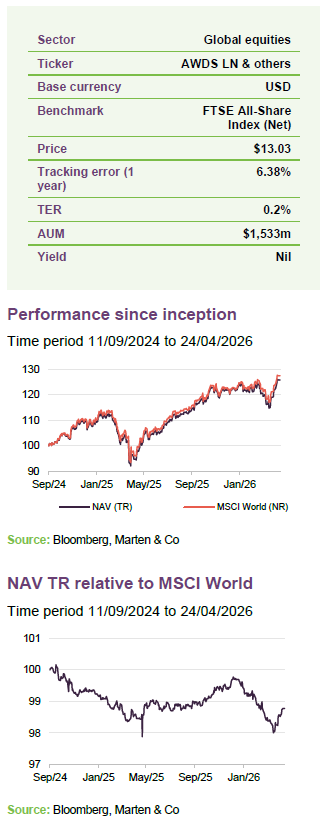
Since launch, AWDS has underperformed its benchmark. While this represents a short period on which to assess performance, the period has also presented challenges for ESG strategies, with factors such as the Trump administration’s rolling back of climate and diversity commitments.
The fund delivered a period of outperformance from the start of May 2025 – when Trump began reversing his Liberation Day tariffs – through to the end of 2025.
The fund may be a candidate for the global equity allocation within investor portfolios. Investors should note that returns are entirely capital-based, with only accumulation share classes (where dividends are reinvested) available.
Global equities with robust ESG process
AWDS provides exposure to global equities with performance that is close to, and potentially ahead of, the MSCI World Index, while systematically incorporating ESG considerations through a robust strategy built around BNP Paribas’s proprietary scoring framework.
| 12 months ended | NAV total return (%) | Benchmark total return (%) |
|---|---|---|
| 31/03/2026 | 15.8 | 16.1 |
AWDS – broad exposure to global equities, with an ESG strategy
Why ESG?
ESG considerations are increasingly being integrated into equity portfolios, as some investors seek to manage long-term risks that may not be captured by traditional financial metrics. Factors such as exposure to the energy transition, labour practices, governance quality and supply chain resilience could affect company performance over time. Incorporating ESG signals into active fund management may move portfolios away from business models that appear structurally weaker and towards companies that may be better positioned to navigate change in a range of relevant areas.
For a global equity strategy like AWDS, ESG integration allows the portfolio to remain closely aligned with the MSCI World Index, while seeking incremental changes in quality, resilience and long-term return potential through ESG-informed stock selection.
Investing in an ESG-badged fund may enhance risk-adjusted returns by systematically favouring companies with stronger ESG profiles relative to peers.
AWDS launched in September 2024 as part of BNP Paribas Easy.
AWDS – an ESG-focused fund
AWDS is a fund launched in September 2024. It forms part of the range of funds offered by BNP Paribas Easy, the ETF and index fund franchise of BNP Paribas Asset Management (see page 10 for information on the manager).
AWDS’s investment objective is to provide exposure to global developed market equities while taking into account ESG criteria.
The fund’s investment universe consists of the securities of the MSCI World (USD Net Total Return) Index, which tracks the performance of large- and mid-cap companies across developed markets. From this universe, the manager applies an active strategy with what it describes as “a binding and significant ESG integration approach”, selecting securities that, according to the manager, enhance AWDS’s ESG profile relative to the index. Specifically, the fund targets:
- an ESG score higher than the index after excluding at least 30% of securities based on ESG scores;
- a greenhouse gas (GHG) intensity lower than that of the index;
- a board gender diversity ratio higher than the index; and
- a minimum of 45% of the portfolio invested in sustainable investments, as defined under Article 2 (17) of the EU Sustainable Finance Disclosure Regulation (SFDR).
Initially, the investment universe is narrowed by excluding companies that do not comply with the manager’s Responsible Business Conduct (RBC) policy. This includes screens such as the UN Global Compact principles and OECD Guidelines for Multinational Enterprises.
After these exclusions, the remaining investment universe is assessed against the three pillars of ESG:
- Environmental: energy efficiency, greenhouse gases emissions reduction, and treatment of waste;
- Social: respect of human rights and workers’ rights, and human resources practices such as health and safety and diversity; and
- Governance: board independence, executive remuneration, and protection of minority shareholders rights.
BNP Paribas’s proprietary scoring framework
BNP’s proprietary scoring framework plays a big part in AWDS’s process.
Part of the assessment of the securities within the investment universe relies on BNP’s proprietary scoring framework, which generates a company-level score based on material ESG issues relative to peers.
Companies are assessed through a four-step process:
- ESG metric selection and weighting, based on the materiality of ESG issues to the business, measurability and insight and data quality and availability;
- ESG assessment versus peers. Each company starts from a “neutral” score of 50 and is scored across each of the three ESG pillars. Companies receive higher scores if they perform above the peer group average, and lower scores if they perform below the average;
- Qualitative review, drawing on third-party data sources, internal research, and direct engagement with companies;
This leads to a final ESG score, ranging from zero to 99.
AWDS’s approach to ESG analysis can result in portfolio weightings that differ materially from the index, and some constituents may be excluded. However, the fund uses tracking-error and sector controls to limit performance divergence, which may result in returns remaining close to those of the MSCI World Index.
If AWDS is able to consistently deliver on its objective, investors may match, or potentially outperform, the index, while also having exposure to a stronger ESG profile than a comparable passive fund.
Structure
There are three versions of the fund available, each with its own ISIN, as outlined in Figure 1.
Figure 1: BNP PARIBAS EASY ESG ENHANCED WORLD UCITS ETF, available versions
| Version | ISIN |
|---|---|
| Euro (AWDSE) | IE0007QB4QS2 |
| Euro hedged (AWDSR) | IE000ATQR3N3 |
| US Dollar (AWDS) | IE000629MKR4 |
The fund is available on multiple European exchanges – London (LN), Euronext Paris (FP), Switzerland (SE), Germany (GR/GY) and Italy (IM) – although not every currency version is available on each exchange. In some cases, the listing is pending. Only accumulation units are available; there are no distribution units (see page 10).
Throughout this note the ticker AWDS has been used for consistency. Performance comparisons and benchmark tracking are calculated using USD NAV, which ensures consistency with the fund’s global investment universe.
Liquidity & spreads
Figure 2: Average daily liquidity and bid-ask spread of share classes, 12 months to 3 March 2026
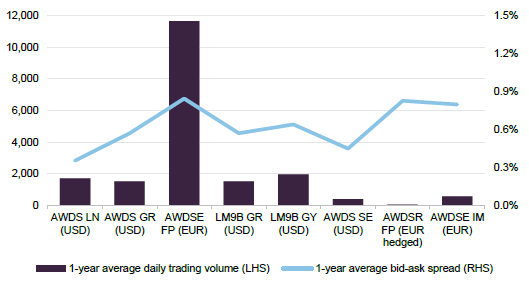
Trading appears to be dominated by the euro line in France, with more volume than the other lines combined. Spreads vary across the exchanges, with the dollar line in London seemingly trading on a comparatively narrow spread.
Tracking error
AWDS’s one-year tracking error to 31 March 2026 was 6.38%, measured as the standard deviation of the difference between AWDS’s returns and those of the benchmark index. This level is seemingly at the upper end of the range typically observed for an active ETF that follows a broadly quantitative approach and a holdings profile similar to the index (see page 7), rather than a more narrowly focused thematic fund, which is more common among smaller funds. This tracking error seemingly indicates the potential for both outperformance and underperformance over time, with a greater degree of divergence compared to a passive ETF.
Fees
AWDS’s total expense ratio (TER) is 0.2%. This covers the management fee, custody and fund administration costs and audit and regulatory compliance expenses. The fee accrues daily and is reflected in the fund’s NAV. It does not include transaction costs from buying and selling underlying securities, nor investor-level costs such as bid-ask spreads or brokerage fees.
AWDS’s TER is in-line with the typical fee range for passive global equity ETFs, which usually charge between 0.12% and 0.22%.
Top 10 holdings
As shown in Figure 3, the top 10 holdings of AWDS appear to match the benchmark.
Figure 3: Top 10 holdings as at 31 March 2026
| Holding | Sector | Country | Allocation 31 March 2026 (%) | MSCI World Index (%) | Relative versus index |
|---|---|---|---|---|---|
| NVIDIA | Information technology | United States | 5.3 | 5.3 | – |
| Apple | Information technology | United States | 4.7 | 4.7 | – |
| Microsoft | Information technology | United States | 3.3 | 3.3 | – |
| Amazon | Consumer discretionary | United States | 2.5 | 2.5 | – |
| Alphabet A | Communication services | United States | 2.1 | 2.1 | – |
| Alphabet C | Communication services | United States | 1.8 | 1.8 | |
| Broadcom | Information technology | United States | 1.8 | 1.8 | – |
| Meta Platforms | Communication services | United States | 1.6 | 1.6 | – |
| Tesla | Consumer discretionary | United States | 1.3 | 1.3 | – |
| JPMorgan | Financials | United States | 1.0 | 1.0 | – |
| Total of top 10 | 25.3 | 25.3 |
Asset allocation
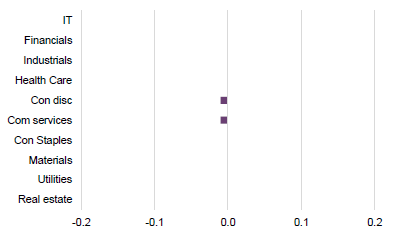
AWDS’s geographic asset allocation appears to match the benchmark closely. The portfolio is dominated by the United States, with the most notable difference being an underweight to the UK. The sector allocation matches the benchmark to within one decimal place (see Figure 7).
Figure 4: AWDS geographic allocation as at 31 March 2026
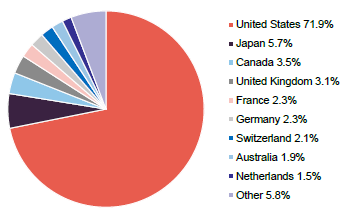
Figure 5: AWDS geographic allocation relative to MSCI World (%)
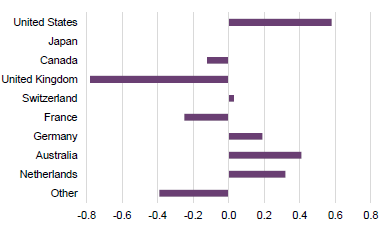
Figure 6: AWDS sector allocation as at 31 March 2026
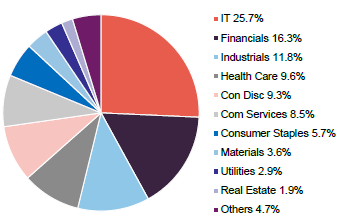
Figure 7: AWDS sector allocation relative to MSCI World (%)
Performance
As illustrated in Figure 9, AWDS has underperformed the index since its launch in September 2024. Figure 8 shows a period of underperformance from launch until the end of April 2024, and then since the start of this year. Figure 8 also shows that AWDS’s performance between April 2024 and the end of 2025 appears to be better.
When global equities were struggling at the beginning of 2025, AWDS underperformed, particularly during the period associated with President Trump’s “Liberation Day” tariff announcements in April. As equities subsequently recovered and then rallied, the relative performance of AWDS also seemingly improved.
Figure 8: AWDS’s NAV total return relative to MSCI World index, rebased to 100, from inception to 24 April 2026
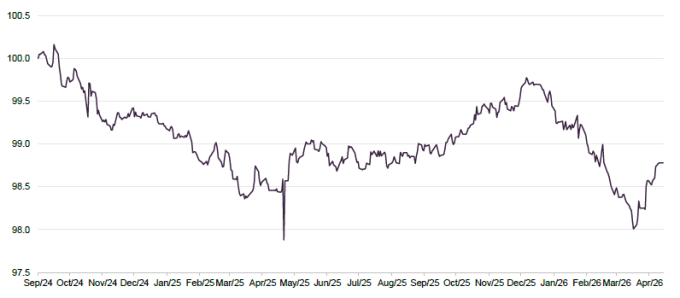
Figure 9: Cumulative total return performance over periods ending 31 March 2026
| 1 month (%) | 3 months(%) | 6 months (%) | 1 year (%) | Since launch (%)1 | |
|---|---|---|---|---|---|
| AWDS NAV | (5.7) | (3.3) | 0.4 | 15.8 | 17.5 |
| MSCI ACWI index | (4.9) | (1.9) | 1.3 | 16.1 | 19.8 |
| Relative performance | (0.8) | (1.4) | (0.9) | (0.3) | (2.3) |
Peer group
Figure 10: Total return NAV performance, AUM, fees & tracking error for selection of large-cap global equity active ETFs, ending 31 March 2026
| 6 months(%) | 1 year(%) | Since launch(%) | AUM (£m) | Total expense ratio (%) | Tracking error (1-year, %) | |
|---|---|---|---|---|---|---|
| BNP Paribas Easy ESG Enhanced World | 0.4 | 15.8 | 17.5 | 1,108 | 0.20 | 6.38 |
| AXA Climate Equity | 2.7 | 17.2 | 23.8 | 18 | 0.50 | 3.80 |
| HSBC Multi Factor Worldwide Equity | 5.1 | 20.3 | 25.7 | 703 | 0.25 | 1.81 |
| Fidelity Global Equity Research Enhanced | 0.0 | 14.1 | 15.5 | 188 | 0.35 | 2.05 |
| First Trust Global Capital Strength ESG Leaders | (2.9) | (1.7) | 3.0 | 32 | 0.75 | 8.3 |
| Invesco Global Active ESG Equity | 5.2 | 19.5 | 23.5 | 1,699 | 0.30 | 2.35 |
| iShares World Equity Enhanced Active | 2.7 | 17.2 | 23.8 | 1,488 | 0.30 | 4.33 |
| JPM Global Research Enhanced Index Equity | 2.7 | 17.2 | 23.8 | 608 | 0.25 | 2.8 |
| Peer group median | 2.0 | 15.0 | 19.6 | 731 | 0.36 | 3.98 |
| AWDS rank | 7/8 | 6/8 | 6/8 | 3/8 | 1/8 | 2/8 |
AWDS has a limited performance history due to its relatively short life. Its six-month and one-year numbers are behind the peer group for this calendar year. This appears to have affected its relative performance versus peers since launch.
AWDS has grown into a significant participant within the active ETF global equities space, even though BNP has a relatively small share within European active ETFs (with an overall share of the market of 3.7% at the end of 2025 versus 45% for JPMorgan). This growth may be influenced in part by the fund’s fees, which, at 20 bps, are the lowest among its peers in Figure 10.
AWDS has one of the highest tracking errors in the sector, which suggests greater potential for returns to deviate from the benchmark, both positively and negatively, over time. Only the First Trust fund has a higher one-year tracking error, but its size and performance may make it an outlier within the peer group.
No regular dividends – accumulating ETF
AWDS only offers accumulation share classes.
AWDS is an accumulating ETF, with any income generated by the underlying holdings reinvested into the fund rather than being distributed to investors. This reinvestment is reflected in the fund’s net asset value, and investors do not receive regular cash distributions.
For comparison purposes only, the yield of the benchmark MSCI World Index is approximately 1.5%.
AWDS only offers accumulation share classes.
Management
AWDS’s named manager is Alban Ribault, a portfolio manager within BNP Paribas Asset Management’s ETF & Index team. He joined the firm in 2007, and, from 2015 to 2021, was a market risk analyst focused on equities and corporate fixed income.
AWDS is managed by BNP Paribas Asset Management, part of the BNP Paribas Group. Established in its modern form in 2000, the firm operates as a global investment manager with a presence across Europe, the Americas and Asia. It manages approximately €500bn in assets on behalf of institutional investors, intermediaries and retail clients, across both active and passive strategies. Its investment teams operate across major asset classes, including equities, fixed income and multi-asset solutions.
The organisation combines centralised investment oversight with regional portfolio management and research. Teams collaborate across geographies, sharing research and risk insights while maintaining local market expertise. Governance is within the wider BNP Paribas group structure, with asset management operating under the group’s global risk, compliance and sustainability frameworks.
Important Information
This note is for information purposes only and is not intended to encourage the reader to deal in the security or securities mentioned within it.
Marten & Co is not authorised to give advice to retail clients. The research does not have regard to the specific investment objectives financial situation and needs of any specific person who may receive it.
The analysts who prepared this note are not constrained from dealing ahead of it but, in practice, and in accordance with our internal code of good conduct, will refrain from doing so for the period from which they first obtained the information necessary to prepare the note until one month after the note’s publication. Nevertheless, they may have an interest in any of the securities mentioned within this note.
This note has been compiled from publicly available information. This note is not directed at any person in any jurisdiction where (by reason of that person’s nationality, residence or otherwise) the publication or availability of this note is prohibited.
Accuracy of Content: Whilst Marten & Co uses reasonable efforts to obtain information from sources which we believe to be reliable and to ensure that the information in this note is up to date and accurate, we make no representation or warranty that the information contained in this note is accurate, reliable or complete. The information contained in this note is provided by Marten & Co for personal use and information purposes generally. You are solely liable for any use you may make of this information. The information is inherently subject to change without notice and may become outdated. You, therefore, should verify any information obtained from this note before you use it.
No Advice: Nothing contained in this note constitutes or should be construed to constitute investment, legal, tax or other advice.
No Representation or Warranty: No representation, warranty or guarantee of any kind, express or implied is given by Marten & Co in respect of any information contained on this note.
Exclusion of Liability: To the fullest extent allowed by law, Marten & Co shall not be liable for any direct or indirect losses, damages, costs or expenses incurred or suffered by you arising out or in connection with the access to, use of or reliance on any information contained on this note. In no circumstance shall Marten & Co and its employees have any liability for consequential or special damages.
Governing Law and Jurisdiction: These terms and conditions and all matters connected with them, are governed by the laws of England and Wales and shall be subject to the exclusive jurisdiction of the English courts. If you access this note from outside the UK, you are responsible for ensuring compliance with any local laws relating to access.
No information contained in this note shall form the basis of, or be relied upon in connection with, any offer or commitment whatsoever in any jurisdiction.
Investment Performance Information: Please remember that past performance is not necessarily a guide to the future and that the value of shares and the income from them can go down as well as up. Exchange rates may also cause the value of underlying overseas investments to go down as well as up. Marten & Co may write on companies that use gearing in a number of forms that can increase volatility and, in some cases, to a complete loss of an investment.