Enriched prospects?
A commitment to quadruple nuclear generating capacity in the US, made by President Donald Trump in a series of executive orders signed at the end of May, has been followed by in a notable increase in activity in the uranium sector, in which Geiger Counter (GCL) invests. A number of uranium stocks rose by double figures in the days following the pledge to “re-establish the US as a global leader in nuclear energy”.
Investor sentiment towards the sector had been declining prior to this, with GCL’s managers highlighting a number of factors that they felt had combined to put downward pressure on GCL’s NAV (which we explore on page 4). This was in contrast to what they see as the fundamentals of the uranium market, which they believe is displaying both demand-side expansion and supply-side constraints. They think that current uranium market conditions make it a potentially opportune time to invest in the company.
Capital growth from a diversified global portfolio of uranium stocks
GCL aims to provide investors with capital growth by investing in a portfolio of securities of companies involved in the exploration, development and production of energy, as well as related service companies. Its main focus is the uranium sector, but up to 30% of assets can be invested in other resource-related companies. These include, but are not limited to, shares, convertibles, fixed-income securities and warrants.
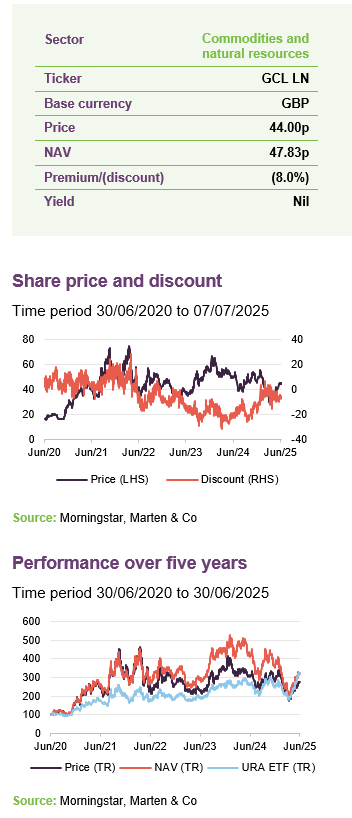
| Year ended | Share price total return (%) | NAV total return (%) | Global X Uranium ETF total return (%) |
|---|---|---|---|
| 30/06/2021 | 140.9 | 159.2 | 75.3 |
| 30/06/2022 | 2.2 | 5.2 | (0.8) |
| 30/06/2023 | (8.2) | 8.8 | 12.0 |
| 30/06/2024 | 35.6 | 42.6 | 34.2 |
| 30/06/2025 | (9.8) | (23.6) | 23.6 |
Market outlook – executive orders deliver shot in the arm for uranium sector
Executive orders set to jumpstart nuclear sector in US
A series of executive orders signed by President Trump on 23 May has been followed by increased activity in the uranium sector. The sector had been showing signs of reduced investor interest over the first few months of 2025, with several factors playing into a disconnect between the share prices of uranium equities and the sector’s underlying market conditions in GCL’s managers’ view. This, they say, was reflected in GCL’s NAV, which had fallen 27.4% over the year to 22 May 2025 before the executive order was announced. GCL’s NAV and share price both jumped over 20% in the weeks following the announcement.
US aims to quadruple nuclear capacity by 2050
The four executive orders have the goal of quadrupling US nuclear energy capacity from 100GW to 400GW by 2050 and “re-establishing the US as the global leader in nuclear energy” and are intended to stimulate the industry. The orders direct the nation’s independent Nuclear Regulatory Commission (NRC) to cut regulations and fast-track new licenses for reactors and power plants (with licence decisions to be taken within a maximum 18 months), which may result in 10 new large reactors under construction by 2030 and a programme of upgrades at existing nuclear reactors rolled out.
The orders seek to:
- tackle an expected surge in US power consumption amid a global race to dominate in artificial intelligence (AI);
- address a growing need for energy independence; and
- provide the US with access to reliable low carbon power.
Power consumption in the US is estimated to reach record highs this year and next having stagnated for nearly two decades. The increased power needed to service what could be an exponential rise of AI through associated data centre infrastructure has put nuclear power (as the only carbon free baseload power generator) high up the agenda in GCL’s managers’ view.
They think that subsidies for other zero carbon forms of renewable energy generation could now be scaled back, thus potentially even enhancing nuclear’s competitive positioning in the US energy mix. They comment that improved clarity could also help remove uncertainty that may have contributed to the recent lack of utility buying activity.
Uranium production and enrichment also to be boosted in US
The orders also aim to reinvigorate uranium production and enrichment in the US to help meet this surging power demand.
The executive orders suggest a strong pro-nuclear stance for the US, building on that of the Biden administration and Trump’s first term. However, the ambitious goals come with a reduction in personnel and funding for the NRC and the Department of Energy, along with changes affecting the NRC’s independence. GCL’s manager believes that any benefit achieved from cutting NRC personnel in terms of reduced bureaucracy may be offset by a skills deficit in delivering projects.
Equities had become disconnected with sector fundamentals
As noted above, prior to the executive order announcement, investor sentiment towards uranium equities had appeared to become disconnected with the sector’s seemingly strong fundamentals. GCL’s managers believe that several factors had combined to negatively impact uranium equities, and GCL’s NAV and share price performance, before the executive order announcement.
Potential Russia-Ukraine ceasefire
First, the prospect of a potential ceasefire between Ukraine and Russia appeared to lead the market to price in two potential post-war developments: a reversal of sanctions against Russian energy exports, including uranium, as well as a lifting of the US ban on importing Russian enriched fuel (under the Prohibiting Russian Uranium Imports Act, which came into effect in the US in August 2024 and was followed by a tit-for-tat export ban announced by Russia in November).
The rationale seems to have been that lifting the ban would have the effect of easing the severe bottleneck in the nuclear fuel supply chain – with Russia controlling 22% of global conversion capacity and around 50% of global enrichment capacity – and would result in more uranium material coming back onto the market, increasing supply and potentially depressing the uranium price.
Impact of a reversal of Russian sanctions misinterpreted by market
GCL’s managers say that this assumption is not supported by current market conditions. Firstly, they argue that freeing up bottlenecks in the supply chain would free up capacity and potentially increase demand from utilities, which would push the term price higher. Secondly, Russian uranium material has remained in the global market throughout the war, with China taking up the lost demand from western nations and utilities.
In any event, GCL’s manager adds that the unwinding of sanctions would be unlikely in the near-term given the global condemnation of Russia’s invasion of Ukraine. In the US, the ban on Russian fuel imports received bi-partisan support and the new executive orders have put energy independence at the forefront of US plans. Even if the ban was to be lifted, it would be hard to imagine utilities not taking a cautious approach towards Russia, given their overexposure prior to the war.
All this suggests a possible overreaction to a potential ceasefire by speculative investors in GCL’s managers’ view. The uranium spot price has now all but recovered its losses over 2025. Figure 1 charts the long-term uranium spot price.
Figure 1: Spot uranium price 2000 – 2025 (US$/lb U3O8)
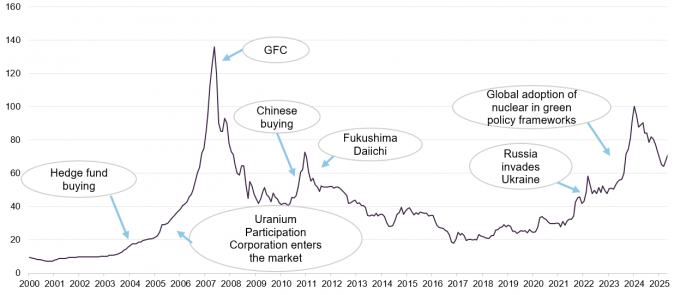
Source: Cameco, Marten & Co
Kazakh dumping physical uranium
Spot and term price diverge on trading of 2.6m lbs of physical uranium
The uranium spot price recovered somewhat in May, at $71.55 per lb, but is still substantially below the term price used to price the majority of longer-term contracts of around $80 per lb. GCL’s manager says that the divergence earlier in the year was likely down to the sale of 2.6m lbs of physical uranium into the market during the closure of the Kazakh Physical Uranium Fund.
They say that, in normal markets, the difference between spot and term prices is largely arbitraged away, but the relationship has shown signs of disruption and broader volumes have slowed, with utilities reluctant to pay higher than spot and sellers unwilling to sell below term. However, they believe that utilities cannot sit on their hands for long. They comment that utility inventory levels are low at around two years – close to “just-in-time” levels, equivalent to the time it takes to produce reactor fuel – compared to traditional levels of between two to three years. The manager says that this may prompt them to contract out for material again.
GCL’s manager believes that the Kazakh sell-off has concluded (although there is no firm information to confirm this), which could see the spot price trend back towards parity with term. This could be supportive of uranium equities share price performance, which is traditionally highly correlated with the spot price.
Global trade war
Although the sector escaped direct US tariffs, with exemptions in place for natural uranium, conversion services, and enrichment services, it did not escape a wider market sell-off in April after the so-called ‘Liberation Day’ caused widespread market disruption. GCL’s manager adds that escalating tensions between the US and Canada – one of the world’s key producers of uranium – has been a major detractor. On top of this, as has been the case traditionally, uncertainty has led utilities to delay signing long-term contracts.
Trade war heightens need to secure independent energy sources
GCL’s managers believe that the trade war could serve to heighten the requirement of governments to secure their energy supplies. The importance of this was cited by the US in the signing of the executive orders, and appears relevant for China, which has a significant new build nuclear reactor pipeline that could be rolled out at a rate of up to 10 per year. GCL’s managers also think that the trade war could also increase the number of life extensions across the existing global reactor fleet in established markets.
DeepSeek sparking concern over demand
The announcement by DeepSeek in January that it had trained its AI model using a fraction of the energy the sector believed possible, may have been another drag on investor sentiment towards the uranium sector. Nuclear power – including an increased number of small modular reactors (SMRs) – had been slated to play a key role in meeting the substantial electricity demands of data centres, which house the specific IT infrastructure needed to train, deploy and deliver AI applications and services.
DeepSeek’s announcement was followed by an energy stock sell-off, with investors seemingly expecting demand for data centres (and the requisite energy requirements) to take a hit. However, GCL’s managers think that the breakthrough could also accelerate the adoption of AI among end-users and increase the number of activities to which AI can be economically applied. This, they believe, could actually increase the demand for compute and the associated infrastructure.
Overreaction to DeepSeek announcement
GCL’s managers comment that with AI still in its infancy, and the infrastructure to support its growth also playing catch-up, the market overreacted to the DeepSeek announcement. According to the manager, there has been no material shift in market fundamentals, and the development of nuclear power and SMRs to support grid capacity is expected to continue.
Market fundamentals strong
International commitment to triple nuclear generating capacity by 2050
GCL’s managers say that market volatility has obscured the positive fundamentals present in the uranium sector. As briefly mentioned earlier, nuclear is seen as an increasingly important component of carbon reduction strategies, with international agreement – now signed by 31 nations including the US, Canada, Japan, France, and the UK – to triple nuclear generating capacity by 2050. They say that it is within this backdrop, and the US’s commitment to the sector, that substantial amounts of investment will be needed to fund a vast number of new projects, including dozens of new reactors (including SMRs) and existing reactor lives being extended globally.
A total of 66 reactors are currently under construction globally, totalling 71.7GW, dominated by activity in China. A further 85 are planned (approved and expected to be in operation within 15 years) and 344 proposed (with timing very uncertain). Figure 2 shows that all of these projects combined would add 518.2GW to the current operating capacity, leaving a shortfall of almost 284GW on the 2050 target of tripling nuclear capacity (to around 1,200GW).
Figure 2: Global nuclear operating capacity (GW)
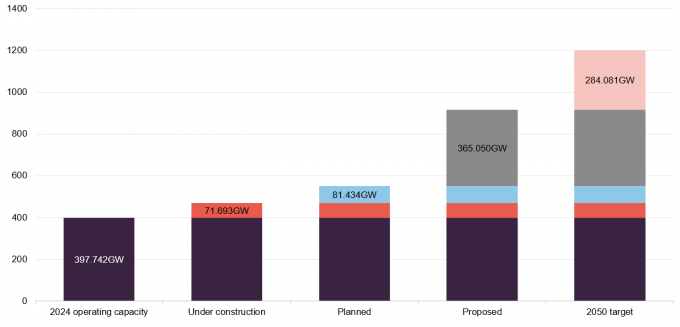
Source: World Nuclear Association, Marten & Co
China represents the majority share of the total number of reactors being built globally and in April announced that it had approved the construction of 10 new reactors for a combined cost of $27bn on top of the 30 reactors it already had under construction. It also has more than 150 additional reactors (with 180GW capacity) in its development pipeline and is targeting nuclear generation capacity of 65GW by the end of 2025 and 200GW by 2040 (by comparison, the EU has 98GW, a similar level to the US). Elsewhere, Japan has plans to switch its fleet of former reactors back on, with nuclear regulators recently approving the first reactor restart in four years at the Hokkaido Electric’s Tomari 3 reactor.
Grid outage in Spain strengthens case for nuclear in the power mix to balance out fluctuations in variable power output
The recent grid collapse in Spain may add pressure for it to reconsider its planned power station closures and GCL’s manager think this could act as a warning to other nations of the grid instability that can result from having too high a reliance on variable power loading within the system. Although Spain’s grid operator has yet to clarify the cause, several prior warnings of grid instability emerged following some localised blackouts in the week prior, while the southern region (from where the cascade was triggered) had a 55% solar loading just before the blackout. GCL’s manager says that the general consensus is that the grid was unable to offset the instability using conventional baseload power sources and argues that this event highlights the potential role of nuclear power as a zero-carbon baseload energy source to support grid stability.
Away from this, general inventory levels across utilities in established western markets, which generate around 20% of their electricity from nuclear power, are approaching very low levels, the manager says. Another round of contracting is likely needed to avoid impacting electricity availability in the near-term in their view.
Figure 3 shows that the uranium market has been in a supply deficit for multiple years. Over the last three years of available data, 2020-2022, supply has met just 74%, 76% and 74% of global demand respectively.
Figure 3: Global U3O8 production and global U3O8 demand 2010-2022 (tonnes)
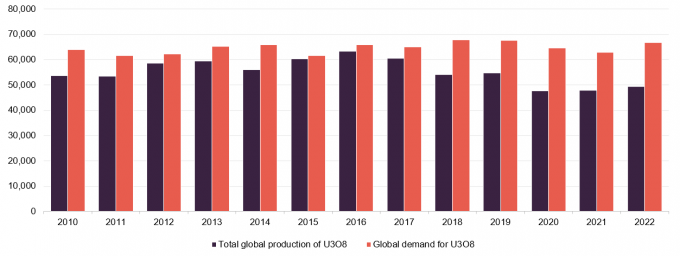
Source: World Nuclear Association – data updated May 2024, Marten & Co
GCL’s managers say that a looming uranium supply crunch exists, with several supply-side issues stacking up. As already mentioned, severe bottlenecks have developed in the conversion and enrichment process (which transforms mined uranium into nuclear reactor fuel) since Russia’s invasion of Ukraine, according to GCL’s managers. Global governments and utilities have increasingly diversified supply away from Russia, which controls almost 50% of the uranium enrichment market, but it will take some time for these to become established, they add.
Meanwhile, the largest global producer of U3O8 Kazatomprom, which controls over 40% of global uranium mining, has cut its production guidance for 2025 due to an ongoing regional shortage of sulphuric acid.
Elsewhere, the ongoing political unrest in Niger continues to add to supply-side complexities, the managers say. The African country – which possesses the continent’s highest-grade uranium ores, is the world’s seventh-largest producer of uranium, and is the second-largest raw uranium exporter to the EU – revoked the uranium mining licences of France’s state-owned Orano, with the Niger government thought to be strengthening ties with Russia.
Given the US commitment to quadruple nuclear generating capacity and global ambitions to triple capacity, the mounting pressure to address the supply and demand deficit should support a step up in the price of uranium, GCL’s managers contend. They believe this presents an opportune time for investors to gain exposure to the sector.
Saba threat lifted
Standstill agreement entered with Saba. US hedge fund’s shareholding in GCL reduced substantially
GCL has entered into a standstill agreement with Saba Capital Investments that will mean the US hedge fund will not requisition the board to call a general meeting, propose or vote for the removal of any director, or vote against any board recommendations. Over recent weeks GCL has repurchased a number of shares from Saba, which has been building large stakes in a number UK investment trusts and agitating for corporate change. At one point Saba owned a circa 13% holding in GCL, but this has been reduced to around 4.3% as at 4 July 2025 and the manager expects Saba will make a full exit by selling the rest of its holding into the market or through further buybacks.
Although GCL was not part of Saba’s failed attempt to take control of seven UK investment trusts earlier this year (read our coverage on that here), it did come under shareholder pressure at its AGM in March. Saba voted its shares against all resolutions including the trust’s annual continuation resolution. GCL survived the vote and its manager says that, given GCL’s large retail investor base, which has a chequered turnout record for AGMs, the result was encouraging.
Saba has reached deals with a number of trusts for tender offers to take place allowing it to extricate its positions including CQS Natural Resources, (which is managed by the same team as GCL and of which Saba holds 29%) and European Smaller Companies. Meanwhile, Middlefield Canadian Income is to be rolled into an ETF.
Investment process
Bulk of managers’ efforts focused on fundamental analysis
GCL’s portfolio is managed using a mixture of top-down and bottom-up investment strategies, although the bulk of the managers’ efforts are focused on fundamental analysis of the risk and return prospects for potential and existing investments – reflecting the concentrated nature of its universe. The portfolio is primarily invested in equity securities, but the managers will consider other instruments where they feel these are appropriate.
The team employs a range of metrics to try and identify undervalued assets, which vary depending on the type of investment (for example, fixed income versus equities) but the team seeks to identify assets that offer superior returns relative to their risk. These should have the potential for capital growth through a rerating of a security. The managers’ analysis, which is conducted in-house, includes assessments of the following:
- The quality of a company’s projects – are the projects in mining-friendly jurisdictions? Do the projects have high-quality deposits? Are there appropriate transport links as well as access to the necessary processing facilities?
- The quality of a company’s management – does the management team have a good track record in developing or managing similar projects? Do they have experience of operating in the relevant mining jurisdiction? Does management have a good track record in managing its obligations? Does management have a strong corporate governance record as well as a record of treating shareholders fairly?
- The free cashflow available from projects and how these flow to the various security holders within a corporate’s capital structure (for example, equity holders, debt holders, preferred stock holders and convertible security holders); and
- The prospect of changes to cashflows (for example, from changes in interest rates or the competitive landscape).
Macro analysis guides managers research efforts
The macro element of the investment process begins with an assessment of the factors driving global demand and supply for uranium. This considers supply-side factors such as exploration success, capacity developments, potential for supply disruptions and technological developments. It also considers demand-side factors such as new applications, the potential for substitution, and technological developments.
The managers look at demand from developed markets, but particular emphasis is placed on developments in the large industrialising emerging markets, as these (China being an example) have significant programmes to develop nuclear power stations and are projected to represent a substantial share of new demand for uranium in coming years (emerging and frontier markets energy demands often rise substantially as they develop). The analysis also takes into consideration inventory levels and how these might develop. This allows the managers to identify areas (for example, sub-sectors and geographies) to focus their attention on when conducting their bottom-up analysis of potential investments.
Portfolio construction – unconstrained by benchmark
GCL’s portfolio is not managed with reference to any benchmark and, whilst the macro overlay acts as a guide by directing the managers’ research efforts, it does not provide specific targets for the geographic and sectoral allocations. Instead, these are a result of the managers’ stock selection decisions, which reflect their assessment of the relative merits of individual investment ideas.
Managers can draw on expertise of wider CQS New City team
The managers, Keith Watson and Robert Crayfourd, make the final decision on what enters GCL’s portfolio, but they are able to draw on the expertise of the wider CQS New City team. Once included in the portfolio, the managers continue to assess stocks to ascertain whether the level remains appropriate.
Investment restrictions
GCL’s main focus is on companies involved in the uranium industry, but up to 30% of gross assets may be invested in other resource-related companies.
GCL does not have a specific gearing limit. Instead, the board sets borrowing limits, which it reviews regularly to ensure that gearing levels are appropriate to market conditions.
Asset allocation
GCL’s portfolio is highly concentrated with inherently low turnover
GCL’s portfolio is highly concentrated, with the top five holdings accounting for 64.2% of the fund (see Figure 6). Figures 4 and 5 show that the portfolio’s geographical allocation is focused on companies in North America. Typically, around a half of GCL’s portfolio is invested in what the managers believe are safer assets; that is, producers or companies backed by physical uranium. Pure exploration plays represent a more limited exposure within the fund.
Figure 4: GCL portfolio split by geography1
Figure 5: GCL portfolio split by sector
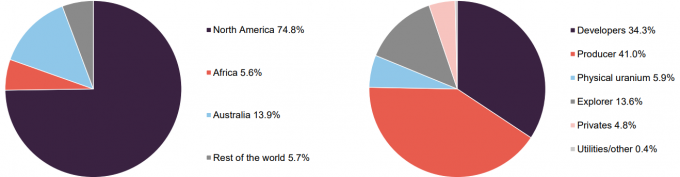
Source: Geiger Counter Limited, Marten & Co. Note 1) as a proportion of gross assets at 31 March 2025.
Source: Geiger Counter Limited, Marten & Co
In part reflecting the managers’ investment style, but also the concentrated nature of the industry, GCL’s portfolio is inherently low-turnover. Changes in the composition of the top five holdings (discussed in more detail below) are frequently driven by differences in near-term relative performance, rather than other considerations. The managers typically expect portfolio turnover to be around 10% per annum, but much of this will be trimming stocks where the managers believe share prices have got ahead of themselves, and adding to holdings where the managers see more value.
As at 31 March 2025, GCL had seven unlisted warrants.
GCL has a significant exposure to physically-backed uranium entities through its holdings in Sprott Uranium Trust (6.1% at 31 March 2025) and Yellow Cake Plc (1.6%). However, in comparison to alternatives such as the URA exchange traded fund (ETF), GCL is underweight Cameco and Kazatomprom.
Top five holdings
Figure 6 shows GCL’s top five holdings at 31 May 2025 and how these have changed over six months.
Figure 6: Top five holdings as at 31 May 2025
| Holding | Sector | Country | Allocation 31 May 2025 (%) | Allocation 30 Nov 2024 (%) | Percentage point change |
|---|---|---|---|---|---|
| NexGen Energy | Exploration and development | Canada | 26.0 | 28.5 | (2.5) |
| Paladin Energy | Uranium mining | Australia | 12.8 | 5.5 | 7.3 |
| UR-Energy | Uranium mining | US | 12.5 | 13.1 | (0.6) |
| Cameco | Uranium mining | Canada | 7.2 | 9.6 | (2.4) |
| IsoEnergy | Exploration and development | Canada | 5.7 | 5.7 | 0.0 |
| Total of top five | 64.2 |
Reflecting both the concentrated nature of the uranium sector and the manager’s long-term, low-turnover approach, the names in the top five portfolio holdings will be familiar to regular followers of GCL’s portfolio announcements and our notes on the company. We provide commentary on the largest holdings in the next few pages. Readers interested in other names in GCL’s portfolio should see our previous notes, where many of these have been discussed (see page 25 of this note for links).
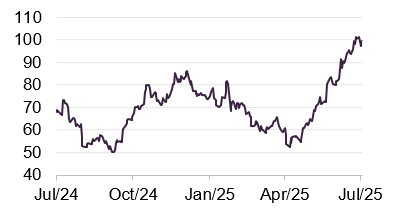
NexGen Energy (26.0%)
Figure 7: NexGen Energy share price (CAD)
Source: Bloomberg
NexGen Energy (www.nexgenenergy.ca) has been GCL’s largest holding, by a significant margin, for some time. It is a uranium exploration and development company with a portfolio of projects that are centred on the Athabasca Basin in Canada, where it holds over 259k hectares of land. NexGen’s southwestern Athabasca Rook 1 property hosts the Arrow Deposit, the South Arrow discovery, the Harpoon discovery, the Bow discovery and the Cannon area. All of these are 100% owned by NexGen. The company also owns a 32.9% interest in exploration-stage company IsoEnergy and continues to hold a strategic uranium inventory of 2.7m lbs of U3O8, valued at CAD$341m.
Following recent share price weakness, which GCL’s managers say can be linked to the delay in gaining final approval for its Rook I project to Q1 2026 at the earliest, NexGen’s share price rebounded 17% in May. GCL’s manager took the opportunity to reduce its exposure in NexGen in order to provide some liquidity flexibility.
The proposed uranium mine and mill development at Rook 1, which is centred around the Arrow deposit (considered by industry observers as one of the world’s leading uranium resources), has been under review for six years having received provincial environmental assessment approval and completed the federal technical review. Court hearings – the final stage in the approval process – have been pushed back by the Canadian Nuclear Safety Commission (CNSC) to 19 November 2025 and 9-13 February 2026, after which approval is expected to be granted.
GCL’s managers say that they do not believe the delay detracts from the strategic value inherent in the project, which is the largest and, in their view, also one of the most advanced development stage uranium mining projects in the world.
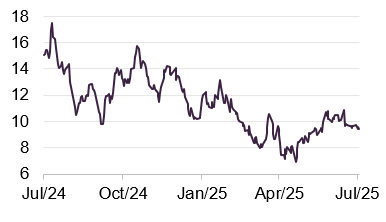
Paladin Energy (12.8%)
Figure 8: Paladin Energy share price (AUD)
Source: Bloomberg
Paladin Energy (www.paladinenergy.com.au) is a Western Australian-based uranium production company that currently has one operating mine – the Langer Heinrich Mine in Namibia (which it owns 75%). At full production, the Langer Heinrich Mine’s annual uranium output is enough to supply more than ten 1,000-MW nuclear power plants for a year. Paladin also holds a portfolio of exploration and development facilities in Canada and Australia.
Paladin reported a 17% increase in uranium production in the first quarter of 2025. The company produced 745,484 lbs of U3O8 at its Langer Heinrich Mine – the highest amount since the mine restarted in March last year.
UR-Energy (12.5%)
Figure 9: UR-Energy share price (CAD)
Source: Bloomberg
Long-time GCL holding UR-Energy (www.ur-energy.com) is a junior uranium mining company that operates an in-situ uranium recovery facility at its Lost Creek property in south-central Wyoming. It also owns the Shirley Basin and Lucky Mc mine sites in the Shirley Basin and Gas Hills mining districts of Wyoming. The company’s tailings facility at the Shirley Basin site is also one of the few remaining facilities in the US that is licensed by the NRC to receive and dispose of by-product waste material from other in-situ uranium mines.
UR-Energy announced that it had gained final approval for the expansion of its Lost Creek project in early May. The expansion is considered a key milestone for the company and is expected to enhance its production capacity, with the company anticipating a significant uplift in revenues. The company also announced expanding operations to Shirley Basin, transforming it into a two-mine operation with active development and construction ongoing. This two-mine approach is expected to increase overall production capacity.
Cameco (7.2%)
Figure 10: Cameco share price (CAD)
Source: Bloomberg
Cameco (www.cameco.com), the world’s largest publicly-traded uranium company, is another long-term holding of GCL. It has been one of GCL’s largest underweight positions relative to the Global X Uranium ETF, which had a 24.1% exposure to Cameco at 3 July 2025. The managers believe that Cameco’s market leading position in the sector justifies its place and weighting within the portfolio. Its share price rose 29% in May following the announcement of the US executive orders.
Cameco’s land holdings, including exploration, span about 1.9 million acres, the majority of which are located in northern Saskatchewan, at the Athabasca Basin. It is home to two of the world’s largest high-grade uranium deposits, in Cigar Lake and McArthur River/Key Lake.
In 2023, Cameco acquired Westinghouse Electric Company, one of the world’s largest nuclear services businesses providing nuclear plant technologies, products and services, which the managers say positions it well for the increasing need for secure, reliable and emissions-free baseload power. Cameco has the licensed capacity to produce more than 30 million pounds of uranium concentrates annually, backed by more than 469 million pounds of proven and probable mineral reserves.
IsoEnergy (5.7%)
Figure 11: IsoEnergy share price (CAD)
Source: Bloomberg
IsoEnergy Limited (www.isoenergy.ca) is listed on the Toronto Stock Exchange and earlier this month commenced trading on the New York Stock Exchange. The uranium exploration and development company has a portfolio of prospective projects that sit in the Athabasca Basin in Saskatchewan, Canada, as well as in the US and Australia at varying stages of development. IsoEnergy was founded by NexGen Energy (GCL’s largest holding), which remains its largest shareholder with a 32.9% interest in the company.
IsoEnergy is currently advancing its Larocque East Project in the Athabasca Basin, which is home to the Hurricane deposit, which has been reported to contain one of the highest-grade indicated uranium mineral resources globally. In addition, IsoEnergy holds over 20 assets covering 220,000 hectares in the eastern Athabasca Basin region.
Performance
For reasons mentioned earlier, the performance of GCL and the broader uranium market had underwhelmed for much of the year. This follows several years of growth as the nuclear sector’s role in contributing to a lower-carbon energy mix was increasingly appreciated and supply-side concerns (which GCL’s managers say continue to persist) put pressure on the price of uranium and drove returns in the sector.
However, subdued market sentiment over much of 2024 (with a brief respite towards the end of the year) hit the share prices of companies in the sector, along with the uranium spot price weakening from its high in January 2024. The Kazakh sell-off of 2.6m lbs of physical uranium has also weighed on the spot price in 2025 in GCL’s managers’ view. However, the recent US executive orders appear to have reinvigorated interest in the sector and, with the managers’ belief that the wider fundamentals remaining supportive, they expect an uptick in performance.
Figure 12: GCL share price and NAV versus the Global X Uranium ETF and Cameco – rebased to 100 over five years to 30 June 2025
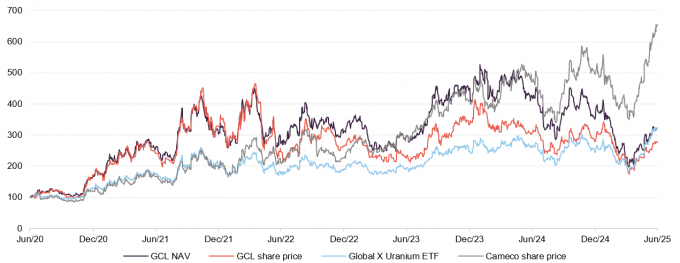
Source: Morningstar, Marten & Co
Particularly weak NAV and share price performance over the past year have dampened GCL’s long term numbers, although it has still performed in line with the Global X Uranium ETF over five years in NAV terms, as shown in Figure 13.
Figure 13: Cumulative total return performance over periods ending 30 June 2025
| 1 month (%) | 3 months(%) | 6 months (%) | 1 year (%) | 3 years(%) | 5 years(%) | 10 years(%) | |
|---|---|---|---|---|---|---|---|
| GCL NAV | 13.2 | 42.7 | (10.8) | (23.6) | 18.6 | 223.4 | 130.7 |
| GCL share price | 11.6 | 32.5 | (1.3) | (9.8) | 12.3 | 176.5 | 141.4 |
| Cameco | 24.9 | 69.7 | 32.0 | 39.2 | 216.9 | 566.7 | 558.5 |
| Global X Uranium ETF | 19.0 | 59.4 | 32.3 | 23.6 | 85.7 | 222.9 | 141.3 |
| Peer group average NAV | 2.5 | 9.6 | 10.0 | 6.2 | 20.7 | 107.1 | 130.9 |
| Peer group average share price | 7.0 | 15.3 | 12.9 | 10.4 | 25.5 | 113.0 | 143.2 |
Figure 14 also illustrates GCL’s NAV performance relative to the Global X Uranium ETF over five years. Its relative performance to Cameco diverged at the start of 2022 as Cameco’s share price took off. Cameco has been a go-to name for uranium exposure for many generalist investors, which may have been a factor in the strong gains it has seen.
Figure 14: GCL NAV performance relative to the Global X Uranium ETF and Cameco – rebased to 100 over five years to 30 June 2025
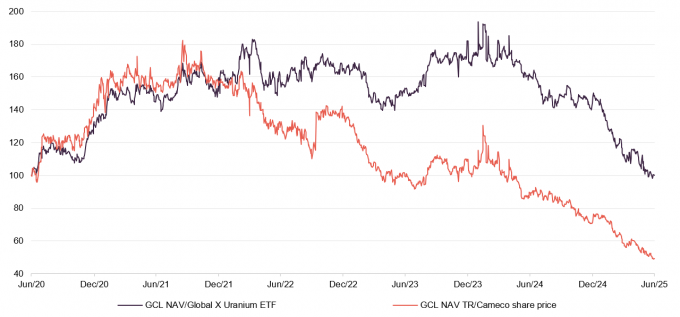
Source: Morningstar, Marten & Co
Peer group
GCL is a member of the AIC’s sector specialist commodities and natural resources sector, which is comprised of nine members. Seven of these are illustrated in Figures 15 to 17. We have excluded Global Resources Investment Trust (GRIT) and Tiger Royalties and Investments (TIR) on size grounds (both sub-£5m market cap). Riverstone Energy, which has a concentrated portfolio of energy companies primarily engaged in oil exploration and production, proposed winding down the company in May.
Click here for a live comparison of the commodities and natural resources peer group
The funds in this peer group are quite diverse, and GCL is the only fund that invests in listed uranium equities. We have added Yellow Cake Plc (YCA) to the peer group, which is focused on uranium, but invests in physical uranium. YCA tends to publish a NAV figure once a month, and as such there is less frequent NAV visibility compared to the remainder of the peer group.
Within the wider peer group, GCL and YCA are not the only funds with a narrow focus – Golden Prospect Precious Metals is focused on gold; and the BlackRock funds are both primarily invested in larger-cap stocks. As such, none of the funds used are direct comparators for GCL.
Figure 15: Peer group cumulative NAV total return performance to 30 June 2025
| 1 month (%) | 3 months(%) | 6 months (%) | 1 year (%) | 3 years(%) | 5 years(%) | 10 years(%) | |
|---|---|---|---|---|---|---|---|
| GCL | 13.2 | 42.7 | (10.8) | (23.6) | 18.6 | 223.4 | 130.7 |
| Baker Steel Resources | 0.0 | 3.1 | 2.8 | 13.8 | 14.7 | 19.4 | 113.9 |
| BlackRock Energy & Res | 3.9 | 1.6 | 0.7 | (1.6) | 18.8 | 120.0 | 169.1 |
| BlackRock World Mining | 3.8 | 4.9 | 9.1 | (0.7) | 9.4 | 65.4 | 195.3 |
| CQS Natural Resources | (0.5) | 5.6 | 12.5 | 4.7 | 16.2 | 155.8 | 163.5 |
| Golden Prospect | (2.7) | 9.2 | 59.4 | 65.9 | 66.5 | 10.5 | 134.3 |
| Riverstone Energy | 0.0 | 0.0 | (3.7) | (15.0) | 1.0 | 155.4 | 9.3 |
| Yellow Cake1 | 0.0 | (7.1) | (17.8) | (28.3) | 28.0 | 76.0 | n/a |
| GCL rank | 1/8 | 1/8 | 7/8 | 7/8 | 4/8 | 1/8 | 5/7 |
| Sector arithmetic avg. | 2.5 | 9.6 | 10.0 | 6.2 | 20.7 | 107.1 | 130.9 |
Figures 15 and 16 display GCL’s NAV and share price struggles in the past year, which has weighed its longer term performance (although its five-year NAV performance is still peer group leading). GCL’s manager say that its 10-year NAV return in the context of a decade-long bear market in uranium following the Fukushima disaster in 2011.
Figure 16: Peer group cumulative share price total return performance to 30 June 2025
| 1 month (%) | 3 months(%) | 6 months (%) | 1 year (%) | 3 years(%) | 5 years(%) | 10 years(%) | |
|---|---|---|---|---|---|---|---|
| GCL | 11.6 | 32.5 | (1.3) | (9.8) | 12.3 | 176.5 | 141.4 |
| Baker Steel Resources | 13.1 | 20.7 | 11.1 | 18.4 | (4.2) | 14.1 | 132.4 |
| BlackRock Energy & Res | 2.7 | 0.9 | 1.0 | 0.2 | 18.0 | 147.5 | 140.7 |
| BlackRock World Mining | 5.4 | 12.5 | 12.5 | (2.8) | 8.9 | 84.3 | 229.0 |
| CQS Natural Resources | (0.7) | 7.4 | 8.9 | 9.3 | 27.7 | 206.7 | 243.3 |
| Golden Prospect | 14.1 | 16.4 | 63.9 | 77.7 | 59.5 | 12.4 | 137.6 |
| Riverstone Energy | 0.3 | 6.7 | 1.8 | (0.5) | 20.1 | 113.3 | (21.6) |
| Yellow Cake | 9.4 | 25.8 | 5.3 | (9.5) | 62.0 | 148.9 | n/a |
| GCL rank | 3/8 | 1/8 | 8/8 | 8/8 | 6/8 | 2/8 | 3/7 |
| Sector arithmetic avg. | 7.0 | 15.3 | 12.9 | 10.4 | 25.5 | 113.0 | 143.2 |
Figure 17 shows that the volatility of GCL’s NAV returns is the highest within the peer group, perhaps reflecting the fact that it has a more concentrated portfolio than a number of the funds in the peer group, as well as having a narrow focus.
GCL’s ongoing charges ratio ranks in the middle of its peer group but slightly above the peer group average. This reflects its relatively small size. If performance improves in line with the manager’s expectations, this could lead to GCL trading at a premium and issuing stock as it has in the past, which should put downward pressure on the ongoing charges ratio. GCL does not pay a dividend, while its net gearing is the highest in the peer group. This means it should benefit if uranium performs well, but the reverse is also true.
Of the two uranium funds, GCL is the more expensive, but GCL has both a much longer track record and a stronger historical performance record over the longer time period.
Figure 17: Peer group comparison – size, fees, discount, yield and gearing as at 7 July 2025
| Market cap (£m) | St. dev. of NAV returns over 5 years | Ongoing charges (%)1 | Perf. fee | Premium/ (discount) (%) | Dividend yield (%) | Gross gearing(%)3 | Net gearing (%)3 | |
|---|---|---|---|---|---|---|---|---|
| GCL | 51.4 | 58.0 | 1.71 | No | (8.0) | Nil | 20.8 | 20.8 |
| Baker Steel Resources | 66.6 | 22.0 | 1.98 | Yes | (31.7) | Nil | Nil | (0.6) |
| BlackRock Energy & Resources | 135.6 | 23.7 | 1.20 | No | (9.0) | 3.8 | 5.9 | 5.9 |
| BlackRock World Mining | 1,004.4 | 27.1 | 0.95 | No | (3.9) | 4.3 | 8.9 | 6.8 |
| CQS Natural Resources | 132.8 | 29.4 | 1.90 | No | (1.5) | 2.4 | 6.6 | 5.1 |
| Golden Prospect | 54.6 | 35.5 | 2.20 | No | (7.1) | Nil | 8.2 | 8.2 |
| Riverstone Energy | 204.6 | 30.6 | 2.50 | Yes | (26.8) | Nil | Nil | (19.9) |
| Yellow Cake | 1,082.6 | n/a | 0.80 | No | (15.1)2 | Nil | Nil | (1.2) |
| GCL rank | 8/8 | 7/7 | 4/8 | 5/8 | 4/8 | 8/8 | 8/8 | |
| Sector arithmetic avg. | 341.6 | 32.3 | 1.66 | (12.6) | 1.3 | 6.3 | 3.1 |
No dividend – capital growth focused
GCL achieves returns primarily through capital growth and therefore does not have a formal dividend policy and has not paid a dividend since its launch. Traditionally, commodities and natural resources have been among the lower-yielding sectors. These industries are capital-intensive, and companies have frequently retained a high proportion of earnings for reinvestment in the business, rather than returning cash to shareholders. In addition, where GCL holds physical commodities, these do not pay dividends. The combined effect is that GCL’s dividend income tends to be a smaller component of its total return. GCL’s accumulated revenue reserve has been growing in recent years and at 31 March 2025 was £5.4m.
Premium/(discount)
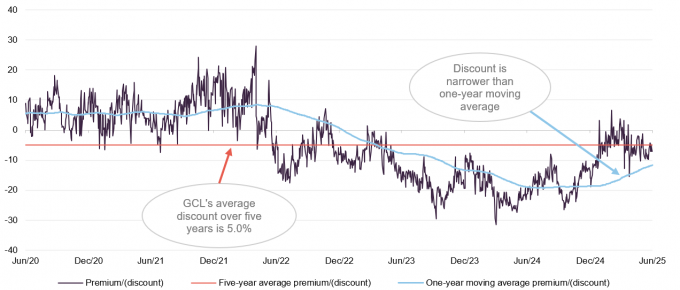
GCL has traded at an average discount of 11.5% over 12 months
GCL’s discount has narrowed to single digits this year and on 7 July 2025 its discount was 8.0%. Over the last year, GCL has traded at an average discount of 11.5%. This is at the cheaper end of its trading range over five years (5.0% average discount, with a range of a 28.0% premium to a 31.5% discount) and three years (12.8% average discount).
Figure 18: GCL premium/(discount) over five years
Source: Morningstar, Marten & Co
GCL does not have an explicit discount management policy, but it is authorised to repurchase up to 14.99% and allot up to 10% of its issued share capital, which gives the board a mechanism with which it can influence the premium/discount. Any shares repurchased may be cancelled or held in treasury and later resold.
As mentioned earlier, GCL has repurchased a large number of shares from Saba over recent weeks. This was on top of an ongoing share buyback programme to reduce discount volatility. During 2025, the company has now repurchased 22,672,102 shares to be held in treasury for a total of just under £9.5m, at an average price of 41.86p.
Fees and costs
Under the terms of the investment management agreement, CQS is entitled to receive a basic management fee of 1.375% per annum of net assets (after adding back any bank borrowings). The management fee is calculated and paid monthly in arrears and the company valued monthly, with assets valued using mid-market prices.
GCL’s management agreement can be terminated on 12 months’ notice by either side.
Fund administration services
GCL has an agreement with R&H Fund Services (Jersey) Limited for R&H to provide administrative, compliance oversight and company secretarial services to GCL.
From 1 January 2022, the fund administration fee increased to £140,000 per annum. R&H’s total fees for the year ended 30 September 2024 were £178,995 (2023: £153,380).
Allocation of fees and costs
The investment management fee, finance costs and costs incurred in relation to the disposal of investments are charged wholly to capital. All other expenses are charged wholly to revenue. We estimate the ongoing charges ratio for the year ended 30 September 2024 at 1.71% (2023: 1.78%).
Capital structure and life
GCL has a simple capital structure consisting of ordinary shares only (of nil par value). As at 7 July 2025, there were 116,663,604 ordinary shares in issue. As at the same date, there were 36,010,645 ordinary shares held in treasury.
Subscription right mechanism
Shareholders approved an annual subscription right document at an EGM in 2021 that enables shareholders to subscribe for one new ordinary share for every five ordinary shares held on 30 April every year at a price equal to the undiluted NAV per share on 1 May one year prior.
The exercise date for the latest subscription right was 1 May 2024, when the price was 74.58p per share. The company received applications for 101,658 new ordinary shares but the board determined that due to the company’s share price at 30 April 2025 (34.4p) it was not in the best interests of the company to issue the new shares. The next subscription rights price is 37.2p per share and the exercise date is 30 April 2026.
Shareholders will have the opportunity to review the subscription right mechanism at the company’s AGM in 2026, and at every fifth subsequent AGM thereafter, where an ordinary resolution will be proposed for the continuation of the subscription right mechanism.
Gearing
GCL is permitted to borrow and has a credit facility with BNP Paribas that incurs interest on any amounts borrowed at the SONIA overnight rate plus 83bps. The facility is flexible, allowing the managers to move money on and off the table when they consider it to be appropriate. The company is restricted by its prospectus to a maximum gearing level of 25%. GCL’s net gearing at 31 May 2025 was 20.8%.
Unlimited life with an annual continuation vote
GCL does not have a fixed winding-up date, but at each annual general meeting (AGM), shareholders are given the opportunity to vote on the continuation of the company. This is an ordinary resolution. If this resolution is not passed, the board is required to put forward proposals to shareholders within four months, to liquidate or otherwise reconstruct or reorganise the company. As mentioned earlier, the company passed its most recent continuation vote, despite the efforts of Saba to the contrary.
Major shareholders
Figure 19: Major shareholders as at 4 July 2025
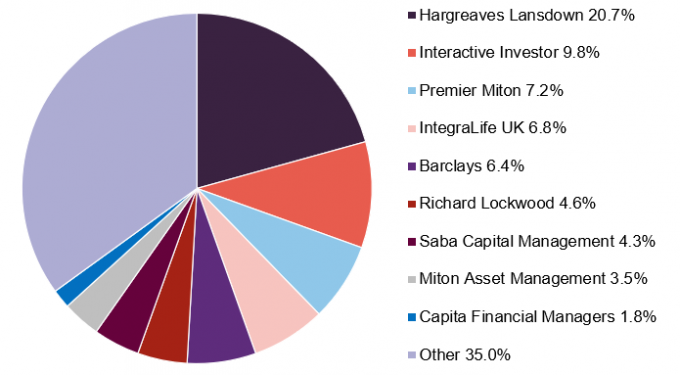
Source: Bloomberg
Financial calendar
The trust’s year-end is 30 September. The annual results are usually released in December (interims in June) and its AGMs are usually held in March of each year.
Corporate history
GCL is a Jersey-domiciled closed-ended investment company incorporated on 6 June 2006. The company’s shares were listed on the International Stock Exchange (formerly the Channel Islands Stock Exchange) and traded on the London Stock Exchange SETS QX Electronic Trading Service, until 28 November 2024, when it delisted from the International Stock Exchange and listed on the main market of the London Stock Exchange.
Fund profile
Further information can be found at: ncim.co.uk/geiger-counter-ltd
GCL aims to provide investors with attractive returns, primarily in the form of capital growth, by investing in a portfolio of securities of companies involved in the exploration, development and production of energy and related service companies. Its main focus is uranium, but to allow diversification beyond this highly concentrated sector, up to 30% of assets can be invested in other resource-related companies.
GCL does not have a formal benchmark and is not managed with the aim of providing outperformance relative to an index. Instead, the portfolio is managed with a more absolute return mindset, with the managers selecting securities that they believe will provide the best risk-adjusted returns over the longer term. Although the managers consider uranium a beneficiary of long-term structural growth drivers, the portfolio is focused on securities that the managers believe are undervalued. The expectation is that such securities will re-rate over time, and therefore provide the scope for capital appreciation beyond what the market expects.
GCL has a global remit, but its portfolio tends to be biased towards North American- and Australian-listed equities. The portfolio is predominantly invested in equities, but it is not restricted to these and can also invest in convertible securities, fixed-income securities and warrants.
CQS Group and New City Investment Managers
NCIM has managed GCL since its launch in July 2006
New City Investment Managers (NCIM) has been GCL’s investment manager since its launch in July 2006. On 1 October 2007, NCIM joined the CQS Group, a global diversified asset manager running multiple strategies. In November 2023, CQS was acquired by Manulife Investment Management, which has US$1.0trn in AUM. Keith Watson and Rob Crayfourd are responsible for the day-to-day management of GCL’s portfolio.
No formal benchmark index
Reflecting both its specialist investment proposition and a relatively small universe, GCL does not have a formal benchmark. However, for the purpose of performance evaluation, the manager has traditionally made comparisons against the price of Cameco and the spot price of triuranium octoxide (U3O8 – the most stable uranium compound and consequently one of the more popular forms of the product).
This note includes comparisons against Cameco…
Cameco is the largest listed uranium producer in the world and the second-largest uranium producer globally. It also provides the processing services needed to produce fuel for nuclear power plants. Cameco has a Canadian listing and its share price and the associated total return series are readily available, so they have been included in this report. Comparisons against the spot price of U3O8 have not been included, due to reduced visibility of the U3O8 spot price and the fact that the majority of market practitioners cannot invest directly in this commodity.
… and the Global X Uranium ETF
Finally, the Global X Uranium ETF (URA) has also been used as a comparator in this note. This is a large (net assets of around US$3.39bn) and liquid ETF that provides investors with access to a broad range of companies involved in uranium mining and the production of nuclear components (this includes companies involved in extraction, refining, exploration, or manufacturing of equipment for the uranium and nuclear industries). Its objective is to provide investment results that correspond generally to the price and yield performance, before fees and expenses, of the Solactive Global Uranium & Nuclear Components Total Return Index.
Management team
GCL is co-managed by Keith Watson and Rob Crayfourd. Keith and Rob are able to draw on the experience of the wider team at CQS. This includes Ian “Franco” Francis, who with over 35 years’ investment experience – primarily in the fixed interest and convertible spheres – can assist with the small number of fixed income investments that GCL may hold from time to time (Ian manages the CQS New City High Yield Fund). Ian, Keith and Rob also manage CQS Natural Resources Growth & Income Plc.
Keith Watson
Keith joined the NCIM team in 2013, initially as a dedicated natural resources analyst. Prior to NCIM, he worked for Mirabaud Securities, where he was a senior natural resource analyst; Evolution Securities, where he was director of mining research; Dresdner Kleinwort Wasserstein, where he was a top-ranked business services analyst; Commerzbank; and Credit Suisse/BZW. Keith began his career in 1992 as a portfolio manager and research analyst at Scottish Amicable Investment Managers. He has a BSc (Hons) in Applied Physics from Durham University.
Rob Crayfourd
Rob joined the NCIM team in 2011. He has 20 years’ experience of investing in resources, having previously worked for the Universities Superannuation Scheme and HSBC Global Asset Management, where he focused on the resources sector. Rob holds a BSc in Geological Sciences from the University of Leeds and is a CFA charterholder.
Board
GCL’s board comprises three directors, all of whom are non-executive and considered to be independent of the investment manager. Other than GCL’s board, its directors do not have any other shared directorships. Board policy is that all of GCL’s board members retire and offer themselves for re-election annually.
Figure 20: The board
| Director | Position | Appointed | Length of service (years) | Annual fee (£) | Ordinary shares held |
|---|---|---|---|---|---|
| Ian Reeves CBE | Chairman | 13 December 2021 | 3.4 | 45,000 | – |
| Gary Clark | Director | 14 October 2015 | 9.6 | 40,000 | 250,102 |
| James Leahy | Director | 1 October 2014 | 10.6 | 35,000 | 114,194 |
Ian Reeves CBE (chairman)
Ian has many years of boardroom experience and holds several director roles. He was chairman of GCP Infrastructure Investments Limited until October 2022, and is currently senior independent director of Social Housing REIT Plc and chairman of The Estates and Infrastructure Exchange (EIE). Ian is chief executive and co-founder of Synaps International Ltd, an international business advisory firm. He is visiting professor of infrastructure investment and construction at The Alliance Manchester Business School and founded and chaired High-Point Rendel Group Plc, a management and engineering consultancy company. Ian has been president and chief executive of Cleveland Bridge, chairman of McGee Group, chairman of Constructing Excellence and chairman of the London regional council of the CBI. He was awarded a CBE in 2003 for services to business and charity.
Gary Clark (chairman of the audit and risk committee)
Gary is a chartered accountant with considerable experience in the investment fund industry. He is a non-executive director on a number of boards that cover investment funds, fund managers and investment management for a variety of financial services businesses. These include Emirates, Blackstone and ICG.
Gary served as chairman of the Jersey Fund Association from 2004 to 2007 and was managing director at AIB Fund Administrators Limited when it was acquired by Mourant in 2006. This business was sold to State Street in 2010, and until 1 March 2011, Gary was a managing director at State Street and its head of hedge fund services in the Channel Islands. Prior to his time at State Street, he was managing director of the futures broker GNI (Channel Islands) Limited in Jersey.
Gary was one of the practitioners involved in a number of significant changes to the regulatory regime for funds in Jersey. This included the move to function-based regulation and introduction of both Jersey’s expert funds and unregulated funds regimes. Gary is resident in Jersey. He graduated with a degree in mining engineering from Nottingham University in 1986.
James Leahy (director)
James has over 35 years’ experience in the mining sector as a senior mining analyst and as a specialist corporate broker with expertise in international institutional and hedge funds, foreign capital and private equity markets. He has previously worked at James Capel, Credit Lyonnais, Nedbank and Canaccord, and he was the founding partner of Mirabaud Securities. During his career, James has raised funds for a wide range of projects worldwide that include industrial minerals, precious metals, copper, diamonds, coal, iron ore, uranium and lithium (he was involved in more than 30 IPOs and a large number of primary and secondary placings).
Since 2010, James has been a director of a number of mining and exploration companies. His former roles include: non-executive director of Continental Coal Limited (between May 2011 and July 2013); a director of African Power Corporation (between May 2011 and May 2014); non-executive director of Bacanora Lithium Plc (between July 2011 and May 2017 – this also included a stint as interim chairman between July and November 2016); non-executive director of Forte Energy NL (between April 2012 and August 2015); non-executive director of BOS GLOBAL Holdings Limited (between April 2012 and August 2015); independent non-executive director of Mineral Commodities Limited (between December 2012 and May 2015); and independent non-executive director of Bellzone Mining Plc (Between November 2014 and May 2015).
James currently serves as a non-executive director on the boards of Capital Metals Plc, European Green Transitions Plc and Active Energy Group Plc.
Previous publications
Readers interested in further information about GCL may wish to read our previous notes. You can read the notes by clicking on the links below or by visiting our website.
Figure 21: QuotedData’s previously published notes on GCL
IMPORTANT INFORMATION
Marten & Co (which is authorised and regulated by the Financial Conduct Authority) was paid to produce this note on Geiger Counter Limited.
This note is for information purposes only and is not intended to encourage the reader to deal in the security or securities mentioned within it. Marten & Co is not authorised to give advice to retail clients. The research does not have regard to the specific investment objectives financial situation and needs of any specific person who may receive it.
The analysts who prepared this note are not constrained from dealing ahead of it but, in practice, and in accordance with our internal code of good conduct, will refrain from doing so for the period from which they first obtained the information necessary to prepare the note until one month after the note’s publication. Nevertheless, they may have an interest in any of the securities mentioned within this note.
This note has been compiled from publicly available information. This note is not directed at any person in any jurisdiction where (by reason of that person’s nationality, residence or otherwise) the publication or availability of this note is prohibited.
Accuracy of Content: Whilst Marten & Co uses reasonable efforts to obtain information from sources which we believe to be reliable and to ensure that the information in this note is up to date and accurate, we make no representation or warranty that the information contained in this note is accurate, reliable or complete. The information contained in this note is provided by Marten & Co for personal use and information purposes generally. You are solely liable for any use you may make of this information. The information is inherently subject to change without notice and may become outdated. You, therefore, should verify any information obtained from this note before you use it.
No Advice: Nothing contained in this note constitutes or should be construed to constitute investment, legal, tax or other advice.
No Representation or Warranty: No representation, warranty or guarantee of any kind, express or implied is given by Marten & Co in respect of any information contained on this note.
Exclusion of Liability: To the fullest extent allowed by law, Marten & Co shall not be liable for any direct or indirect losses, damages, costs or expenses incurred or suffered by you arising out or in connection with the access to, use of or reliance on any information contained on this note. In no circumstance shall Marten & Co and its employees have any liability for consequential or special damages.
Governing Law and Jurisdiction: These terms and conditions and all matters connected with them, are governed by the laws of England and Wales and shall be subject to the exclusive jurisdiction of the English courts. If you access this note from outside the UK, you are responsible for ensuring compliance with any local laws relating to access.
No information contained in this note shall form the basis of, or be relied upon in connection with, any offer or commitment whatsoever in any jurisdiction.
Investment Performance Information: Please remember that past performance is not necessarily a guide to the future and that the value of shares and the income from them can go down as well as up. Exchange rates may also cause the value of underlying overseas investments to go down as well as up. Marten & Co may write on companies that use gearing in a number of forms that can increase volatility and, in some cases, to a complete loss of an investment.