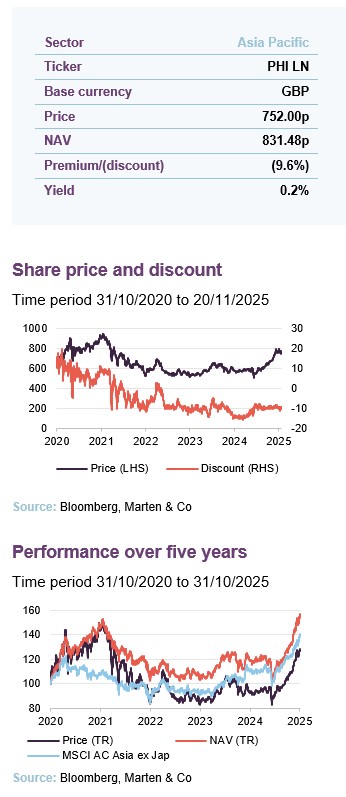
Top performer as Asia regains momentum
Pacific Horizon (PHI) has bounced back strongly over the past year, outpacing both its benchmark and its peers as sentiment towards Asia has improved. The trust’s growth-focused approach, which had been out of favour during the period of rising global interest rates, is once again delivering results.
Despite the obvious challenges, Asian markets have benefitted from resilient domestic demand, easing trade tensions, and renewed confidence in technology-led growth. With valuations across much of the region still undemanding and PHI’s managers maintaining exposure to world-class companies at the forefront of structural trends such as semiconductors and artificial intelligence, we think there could be more to come.
Focused on Asia ex-Japan growth stocks
PHI invests in the Asia-Pacific region (excluding Japan) and in the Indian subcontinent in order to achieve capital growth. The company is prepared to move freely between the markets of the region as opportunities for growth vary. The portfolio will normally consist mostly of quoted securities, although it may hold up to 15% of total assets in unlisted investment opportunities, measured at the time of initial investment.
| Year ended | Share price total return (%) | NAV total return (%) | MSCI AC Asia ex-Japan total return (%) | MSCI AC World total return (%) |
|---|---|---|---|---|
| 31/10/2021 | 43.2 | 44.8 | 7.1 | 29.9 |
| 31/10/2022 | (41.4) | (29.5) | (21.0) | (4.6) |
| 31/10/2023 | (1.5) | 0.8 | 7.5 | 4.3 |
| 31/10/2024 | 12.4 | 16.4 | 21.4 | 25.4 |
| 31/10/2025 | 36.9 | 30.2 | 26.4 | 20.1 |
Fund profile
Additional information is available at the manager’s website: www.bailliegifford.com
Pacific Horizon (PHI) is an investment trust that specialises in investing in growth companies in Asia ex-Japan. Baillie Gifford & Co (Baillie Gifford) has been appointed to manage PHI’s portfolio on behalf of Baillie Gifford & Co Limited, the trust’s alternative investment fund manager. Baillie Gifford has managed PHI since 1992. Baillie Gifford is a long-term growth investor, and it believes that there is a significant opportunity to outperform markets over the long term using this approach. Pacific Horizon was promoted to the FTSE 250 index in January 2023.
About the manager
Well-resourced investment team.
Baillie Gifford has 145 investors/analysts based in its Edinburgh office, with a further three in the US and five in China (these exclude ESG analysts). It is structured as a partnership and encourages a collegiate approach to managing money, although it allows its portfolio managers the freedom to have the final say about their portfolios. It managed or advised on about £213.1bn at the end of September 2025. PHI and the Baillie Gifford Pacific Fund (its open-ended equivalent) had combined total assets of roughly £3.4bn as at 30 September 2025.
PHI is managed by Roderick Snell (lead manager) and Ben Durrant (deputy manager).
Roderick Snell, who is the senior fund manager for Baillie Gifford’s Asia ex-Japan strategies, is the lead manager of PHI’s portfolio. He is supported by Ben Durrant, who was appointed as deputy manager in January 2023 (please see page 18 for more information on the managers). Roderick says that the team’s natural inclination is to be cognisant of political and macro influences in Asia and that thematic considerations are always in the back of their minds. However, he thinks that you only really get to see the big picture by being a bottom-up stock picker.
PHI is a stock-picking fund that bears little resemblance to the MSCI All Country Asia ex Japan Index comparative index.
This is very much a stock-picking fund, and the portfolio can vary materially from its comparative index, the MSCI All Country Asia ex-Japan Index (the active share of PHI’s portfolio at the end of December 2024 was 74%).
The pair spend most of their time in meeting companies and undertaking stock-specific research. The process and philosophy that is used to manage PHI has been the same for the last 30 years.
Market roundup – Asian valuations remain undemanding
Since we last published in March 2025, there has been considerable upheaval in global equity markets. These were marked by weakness in the run-up to and immediate aftermath of “Liberation Day” but have recovered since as the most onerous measures have been rolled back, lifting investor confidence in the process. Against this backdrop, Asia – and China in particular – has performed well, supported by resilient domestic activity and improved risk appetite.
The region’s equity markets have also continued to attract capital into areas exposed to structural growth themes – most notably artificial intelligence and its broader enabling technologies, where Pacific Horizon maintains meaningful exposure through holdings in semiconductor, software, and automation-related businesses. Korean semiconductor names have done well, for example.
As illustrated in Figure 1, Asia and emerging markets more generally have narrowed the performance gap with the US in recent months, and valuations have picked up across the board and are slightly above their five-year averages, although they are still way off their five-year highs.
Figure 1: Index total return performance over five years, rebased to 100
Figure 2: Index F12m P/E ratios over five years
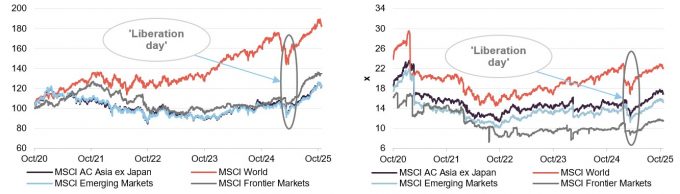
Source: Bloomberg, Marten & Co
Source: Bloomberg, Marten & Co
Managers’ view – Asia remains well-placed to perform
When we published in March, we commented how against the backdrop of a new and vocal administration in the US, higher market volatility and elevated uncertainty more generally, it was quite easy to overlook the advantages Asia offers both in the short and long term – specifically, low inflation across the board, economies run in a very orthodox manner, low debt levels and (after a decade of outflows) little hot money left in the region. This raised the broader question as to why, given the region’s superior growth prospects, did Asia equities trade at such a marked discount to global equities – a feature we still see today.
PHI’s managers identified two primary factors: China’s economic woes and ongoing US dollar strength (the greenback was close to decade high levels versus the Chinese yuan), arguing that there was much to suggest the tide was starting to turn in Asia’s favour and that we could be close to an inflection point.
Fast-forward to today, and much has changed. The US dollar has weakened – a clear objective of the current US administration – and China is recovering, aided by renewed domestic policy support (the government has spent billions on measures such as subsidies, higher wages, and discounts to try and stimulate the domestic economy) and booming exports (some of which, ironically, has been spending brought forward to build inventories in the hope of beating tariffs) that has helped offset weak domestic spending. However, while geopolitical uncertainties continue to persist, PHI’s managers observe that most Asian markets have appeared resilient in the face of the tariff storm.
On Trump and tariffs
Cost differentials mean large-scale reshoring is not viable.
The announcement of Trump’s “Liberation day” tariffs initially triggered a period of volatility across Asian equity markets, with a sharp sell-off, as investors reassessed the potential implications for regional trade flows and supply chains. However, PHI’s managers say that the longer-term impact now appears limited. Whilst the measures temporarily disrupted sentiment, underlying cost differentials remain a decisive factor: average manufacturing wages in the US are roughly 10 times those in Southeast Asia, implying that tariffs of 100–150% or more would be required to render large-scale reshoring economically viable.
Despite tariffs, manufacturing unlikely to relocate outside Asia in any meaningful way.
In practice, this means labour intensive manufacturing is unlikely to return to the US or relocate outside Asia in any meaningful way. Instead, the effect has been one of intra-Asian diversification, with supply chains adjusting at the margin. Countries such as Malaysia and Vietnam have seen incremental investment as companies seek to reduce reliance on China while maintaining access to competitive labour and established logistics networks. India initially appeared well-positioned to benefit from this reordering, but the imposition of 50% reciprocal tariffs in the wake of a row about the import of Russian oil has eroded expectations of that. As an aside, PHI’s managers are comfortable with the macro backdrop in India, noting that both India and China have large domestic economies and neither is dependent on their exports to the US. However, they have been avoiding Indian IT outsourcers because of economic headwinds in the US, as well as uncertainty around their long-term prospects in the face of AI.
Ultimately, the greater burden of the tariff regime has fallen on the US consumer, through higher import costs and a squeeze on real purchasing power. PHI’s managers acknowledge that this has left domestic demand in the US more vulnerable to broader economic slowing, which will weigh on Asian exports at the margin, particularly while inventories revert to more normal levels. The one clear area of structural change has been at the higher end of the manufacturing spectrum, where production is more portable. Companies such as TSMC and Samsung Electronics have committed to building new semiconductor fabrication plants in the US, partly in response to policy incentives and strategic considerations. Nevertheless, PHI’s managers believe that these projects represent targeted exceptions rather than a broader shift, and Asia’s role at the heart of global manufacturing remains fundamentally intact.
When we last published, markets were focusing on the reflationary aspects of Trump’s policies, with higher nominal US GDP growth and higher interest rates expected. However, whilst tariffs have pushed prices up in the US and elsewhere, the growth outlook has deteriorated, making interest rate cuts more likely in the US, which tends to be good for Asia and growth stocks.
PHI’s managers say that despite the recent uptick in performance, valuations in Asia remain compelling. However, the real opportunity lies in PHI’s underlying portfolio companies, in their view. They comment that PHI owns world-class companies that are shaping industries such as batteries, semiconductors, fintech, gaming, e-commerce, and social networks. The world is becoming increasingly multi-polar, and they believe that Asia will be a long-term beneficiary of this.
Investment philosophy and process
The underlying approach
Baillie Gifford believes that markets are inefficient at pricing long-term growth, especially over a time horizon of at least five years, and that this creates an opportunity to generate alpha. For this reason, it aims to encourage a culture of long-term thinking within the firm. Baillie Gifford believes there is persistence of good company management, business models and stock prices. This translates into a culture of “sticking with the winners”.
The company uses proprietary research. The team undertakes much of this, but will often commission research from local research teams, academics, and industry experts. Baillie Gifford also subjects some companies to forensic analysis, using the services of investigative journalists and forensic accountants. When it is talking to companies, the conversations with their management teams focus on the long-term prospects of the business.
The managers are able to draw on the resources of the whole investment team when analysing companies, and can sit in on meetings with companies outside their geographic remit. This is especially beneficial when they are trying to identify how their companies compare with competitors domiciled in other markets.
Each member of the team is assigned a geographical focus for research, and these responsibilities are rotated every few years. Investment ideas are presented to the group, but the lead portfolio manager makes the final decision. Roderick and Ben usually spend four to five weeks visiting Asia each year.
The open-ended investment company (OEIC) and PHI are run in parallel, with some exceptions; a key driver being the need to keep the OEIC’s portfolio relatively liquid to allow for inflows and the funding of redemptions. There is an internal limit of holding no more than 10% of the portfolio in illiquid holdings, but within this constraint, PHI has greater freedom to hold more illiquid investments than the OEIC. The OEIC has ended up with more of a large-cap bias as a result, while PHI has more exposure to small-cap names. There is considerable commonality in the stocks held, although the individual weightings may differ. PHI, unlike the OEIC, also has the option of using gearing and invests in unlisted companies.
Building the portfolio
Baillie Gifford is an active investor and does not hold stocks just because they are large constituents of any benchmark. Consequently, there are few limits on country, sector or stock weightings imposed on managers. The initial size of a position will reflect the strength of the managers’ belief in the potential risks and rewards of the investment. One of the guiding principles of investing at Baillie Gifford is to “run the winners” (reflecting the belief in the persistency of good business models). The managers look at the shape of the overall portfolio to ensure that it does not have too many companies exposed to similar thematic dynamics.
The mandate allows PHI’s managers to use derivatives to control risk and to alter the portfolio’s exposure to markets. In practice, the managers are not undertaking such activity. The managers have no plans to use hedging to alter the portfolio’s currency exposure.
Sell discipline
Loss of faith in a company’s management is an instant trigger for a sale. Roderick and Ben will also sell if they feel that the business model is not working, or if the market has caught up with their expectations.
Portfolio allocation
As at 30 September 2025, PHI held 64 companies in the portfolio, up from 62 as at 31 December 2024. PHI believes that it can achieve an appropriate level of diversification for its strategy by holding 40–120 companies.
In normal market conditions, the managers consider that if a position is below half a percent, they need to have a strong view if it is to remain in the portfolio. As at the 30 September 2025, there were 10 positions that fell below this threshold. During the last financial year, positions in 15 new names were initiated, while complete also sales numbered 15.
Portfolio activity
There has been no significant change in the themes represented in PHI’s portfolio since we last published, although the exposure to India has continued to fall in favour of China (in part, reflecting relative performance) – these being the two major shifts in geographical allocations – see Figures 3 and 4. However, while PHI’s managers had been actively increasing the exposure to China, they have also been trimming some Chinese names recently, taking advantage of the market movements to broaden the stock selection in China.
The managers have added to Vietnam – which they still consider to be Asia’s best long-term growth story – increasing Vietnamese banks in particular, following new pro-growth reforms. They say that Vietnam has been weak for the last four years as the government pursued a corruption clampdown (a real estate crisis led to a banking crisis that caused a gridlock in approvals, with officials reluctant to sign off on new projects), but Tô Lâm, the new general secretary of the communist party of Vietnam, is much more pro-economic growth and development than his predecessor. He has set ambitious targets for GDP growth and is making reforms to achieve these.
Figure 3: Geographic allocation as at 30 September 20251
Figure 4: Geographic allocation as at 31 January 20251
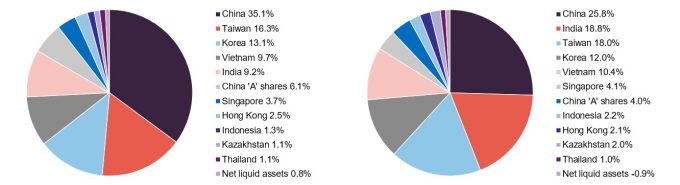
Source: Pacific Horizon Investment Trust. Note: 1) As a proportion of gross assets.
Source: Pacific Horizon Investment Trust. Note: 1) As a proportion of gross assets.
Figure 5: Industry sector allocation at 31 July 20251
Figure 6: Industry sector allocation at 31 July 20241
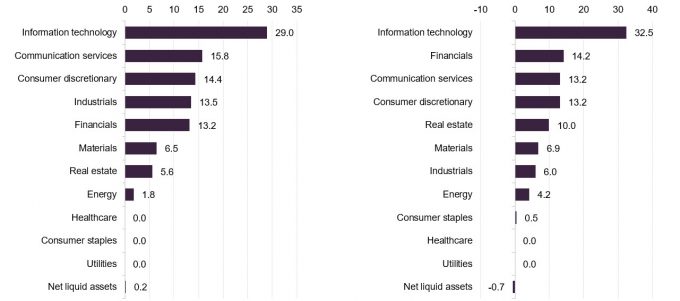
Source: Pacific Horizon Investment Trust. Note: 1) As a proportion of gross assets.
Source: Pacific Horizon Investment Trust. Note: 1) As a proportion of gross assets.
Korean semiconductor names have also performed well as AI has continued to show strong momentum. The manager comment that Korean IHT laws have kept valuations low, but say that work is now being done to address this problem.
A comparison of the sector allocations shows that the most significant change is the increased exposure to industrials (up 7.5 percentage points), a notable increase in communication services (2.6 percentage points), and a smaller rise in consumer discretionary (1.2 percentage points). Real estate (-4.4 percentage points) and information technology (-3.5 percentage points) have seen the largest reductions, and there have also been meaningful reductions in energy (-2.4 percentage points), financials (-1.0 percentage points). All other changes are less than one percentage point.
Top 10 holdings
Figure 7: Top 10 holdings as at 30 September 2025
| Holding | Sector | Business focus | Country | Allocation 30 September 2025 (%) | Allocation 31 January 2025 (%) | Percentage point change |
|---|---|---|---|---|---|---|
| TSMC | Technology | Internet services | China | 11.3 | 10.8 | 0.5 |
| Tencent | Technology | Online gaming/social networking | China | 8.2 | 4.9 | 3.3 |
| Samsung Electronics | Technology | Electrical equipment manufacturer | Korea | 5.7 | 5.6 | 0.1 |
| SK Square | Technology | Electronic components | Korea | 4.2 | – | 4.2 |
| Zijin Mining | Materials | Gold and copper miner | China | 3.5 | 2.7 | 0.8 |
| ByteDance | Communications | Owner of TikTok | China | 3.3 | 3.1 | 0.2 |
| Sea Limited | Communication services | Online gaming/ecommerce | Singapore | 3.3 | 3.4 | (0.1) |
| Alibaba | Technology | E-commerce | China | 3.3 | – | 3.3 |
| MMG | Materials | Chinese copper miner | HK/China | 3.0 | 2.2 | 0.8 |
| EO Technics | Technology | Semiconductor laser markers | Korea | 2.2 | 2.0 | 0.2 |
| Total of top 5 | 32.9 | 28.1 | 4.8 | |||
| Total of top 10 | 48.0 | 42.3 | 5.7 |
Figure 7 shows PHI’s top 10 holdings as at 30 September 2025 and how these have changed since 31 January 2025 – this being the most recently available data when we last published. Holdings that have moved into the top 10 are SK Square, Alibaba, MMG and EO Technics.
Names that have moved out of the top 10 are Equinox India Developments, Daily Hunt, Accton Technology and PDD Holdings. The manager has also continued to increase portfolio concentration since we last published, as Figure 7 illustrates.
We discuss some of the more interesting developments below. Many of PHI’s other holdings have been discussed in detail in our previous notes – see page 23 of this note.
As explored further in the performance section on page 11, PHI exposure to AI and technology holdings have helped driving performance in recent months. In the semiconductor space, PHI has benefitted from its significant holdings in the likes of TSMC, Samsung. SK Hynix (which it also has exposure to through SK Square, which is a holding company for SK Hynix; the managers have shifted PHI’s exposure more into SK Square, reflecting the significant discount to NAV that it trades at) and EO Technics.
In the tech space, holdings such as Tencent, ByteDance (TikTok) and Alibaba have shown strong momentum. Alibaba was added back into the portfolio as the managers felt that the Chinese government’s previously negative approach to tech companies had reversed and they consider that Alibaba’s cloud and AI businesses have strong potential.
Both MMG and Zijin Mining have moved up the ranks on the back of strong copper prices.
Equinox India Developments was reduced as the manager narrowed the exposure to India to fund the increased allocation to China. Daily Hunt (part of VerSe Innovation) is a private holding whose valuation was written down as its “Josh” short-form video app – similar to TikTok – has not scaled as expected. However, the company has undergone restructuring, including layoffs to improve efficiency, with the aim of achieving profitability.
Other holdings
PHI’s managers comment that Meituan, the Chinese food delivery company, has struggled recently as the market has become concerned about the prospect of stronger competition, with Alibaba and JD.com expanding into the food delivery space. However, the managers note that Meituan remains the dominant food delivery business in China, with around 70% market share and very strong utilisation. The managers think the next 18 months could be challenging, but view Meituan as a very well-funded, cash-rich business that is well-placed to fend off the increased competition and could emerge stronger as a result.
PHI’s managers have added to CATL, via its IPO on the Hong Kong Stock Exchange, which they view as a global leader in battery production. They say that battery production is becoming increasingly commoditised but believe CATL has scale (it has around a 40-50% market share) and can fund R&D to sustain its technological advantage (its new Shenxing Pro battery can charge to a 478km range in just 10 minutes). Reflecting this, CATL makes decent profits while many peers are still loss-making. The manager recently sold CATL H-shares which were at a premium, and switched into the A-shares.
Baidu (China’s equivalent of Google) has been sold. PHI’s managers say that the business has been stagnant for some time, and they are concerned that its core search advertising business is under threat from AI. They say that the company has been investing heavily in areas such as AI models and infrastructure, AI cloud services, and autonomous driving, but is not leading in any of these, with companies such as Tencent and Alibaba in better positions. They replaced the position with a holding in Pony AI, an autonomous driving specialist which they think is better placed.
Tech conglomerate and longstanding PHI holding Sea Limited has performed strongly on the back of robust growth in all three of its core businesses: e-commerce (Shopee), digital entertainment (Garena), and digital finance (SeaMoney/Monee). Key factors include improved advertising revenue from Shopee (the e-commerce business is now profitable and significantly derisked); growth in the fintech business; and a strong performance of the mobile game Free Fire. The company is also expanding successfully into Brazil. The managers questioned whether it could compete effectively against Mercadolibre, but observe that it is generating US$250m of EBITDA per quarter. They say the market is not ascribing any value to this business, which could ultimately be the most valuable part of the entire enterprise. They view it as the strongest consumer-focused stock in Southeast Asia.
Performance – now benefitting from rotation away from India into China
As we have highlighted in our previous notes, PHI has a good long-term record of outperformance of both its MSCI AC Asia Pacific ex Japan benchmark and the MSCI AC World Index, which is illustrated in Figure 9 (see our previous notes for further explanation of PHI’s longer-term performance record). However, following a particularly strong run of performance in recent months, PHI can not only boast outperformance over more recent time frames but its performance relative to peers has also improved markedly such that it is the best performing fund in its peer group for all of the time periods in Figure 9 (see Figure 10 on page 13). PHI is also the best-performing fund in share price total return terms over most periods.
Figure 8: PHI’s total return NAV performance relative to its comparative benchmark (MSCI AC Asia ex Japan) and the MSCI AC World, over five years to 31 October 2025
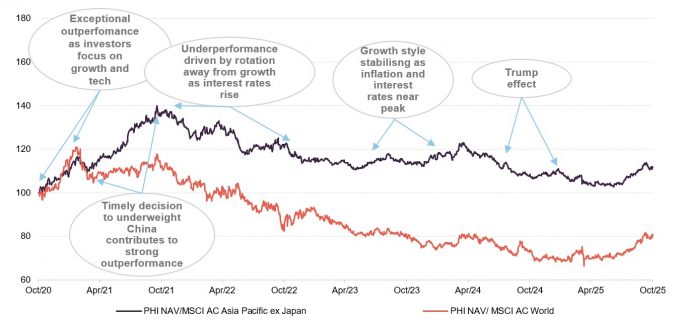
Source: Bloomberg, Marten & Co
PHI’s performance was aided by timely decisions to decrease the exposure to China in 2021 in favour of India, and – as we discussed in our last note – to reallocate away from India into China in 2024. The latter move reflected a view that the Indian market was increasingly priced for perfection, while valuations in the Chinese market looked overly negative, even allowing for the challenges that the Chinese market was facing. This, along with a similarly early decision to increase exposure to semiconductors, has contributed significantly to PHI’s performance during the last year.
Trump’s tariff announcements in early 2025 hurt growth-orientated positions, but have been followed by a strong rebound from May onwards. China has performed strongly and Korean semiconductor names have also done well.
PHI’s managers continue to think that there is still volatility to come, but believe that, over the long term, the performance of PHI’s holdings should ultimately outpace the returns of structurally-challenged companies with lower or no growth prospects. Therefore, while the portfolio has been rationalised and concentrated, the fundamental approach remains unchanged.
Figure 9: Cumulative total return performance over periods ending 31 October 2025
| 1 month (%) | 3 months (%) | 6 months (%) | 1 year (%) | 3 years (%) | 5 years (%) | 10 years (%) | Manager tenure1 (%) | |
|---|---|---|---|---|---|---|---|---|
| PHI NAV | 7.4 | 22.3 | 42.0 | 30.2 | 52.8 | 55.9 | 374.7 | 402.8 |
| PHI share price | 5.7 | 21.1 | 40.1 | 36.9 | 51.7 | 27.2 | 360.6 | 406.2 |
| MSCI AC Asia Pacific ex Japan | 7.1 | 13.9 | 31.9 | 26.4 | 65.1 | 39.6 | 166.8 | 179.8 |
| MSCI AC World | 4.8 | 9.3 | 23.6 | 20.1 | 57.2 | 94.9 | 243.5 | 296.2 |
| Peer group NAV2 | 6.7 | 13.9 | 29.3 | 17.9 | 47.8 | 47.8 | 243.4 | 282.2 |
| Peer group share price2 | 5.7 | 13.5 | 30.4 | 23.3 | 48.3 | 37.4 | 237.7 | 279.1 |
Peer group comparison – Asia Pacific sector
PHI is a member of the AIC’s Asia Pacific sector, which comprises four members, all of which are illustrated in Figures 10 and 11. All four were members of the peer group when we last published. Members of the Asia Pacific sector will typically have:
- over 80% invested in quoted Asia Pacific shares;
- less than 80% in any single geographic area;
- an investment objective/policy to invest in Asia Pacific shares;
- a majority of investments in medium to giant cap companies; and
- an Asia Pacific benchmark.
Please click here for an up-to-date peer group comparison of PHI versus its Asia Pacific peers.
It is worth noting that, whilst the peer group is fundamentally capital-growth-focused, the Baillie Gifford approach has traditionally been characterised by a particularly strong emphasis on growth.
Peer group performance
In previous notes (see page 23), we have highlighted how PHI’s strong bias towards growth has served it well over the long term, though it became a notable headwind when interest rates began to rise in 2022 in response to inflationary pressures. This year, however, sentiment towards growth companies has improved. Trump’s “Liberation Day” tariff announcement initially spurred a short-term boost in activity as businesses moved to stockpile ahead of expected cost increases. However, markets now anticipate that the resulting drag on global growth will prompt central banks to cut rates, providing renewed support for growth-focused stocks. PHI has prospered in this environment and ranks first out of four in terms of its NAV total return performance for all of the time periods provided in Figure 10, with the exception of the three-year period, which captures a significant part of the previous growth sell-off.
We think that longer-term periods are generally better suited to assessing a long-term strategy such as PHI’s. It is worth remembering that PHI’s managers want to be invested in top 20% of the best growth companies in the Asia Pacific region and say that they explicitly look for companies that they believe can double their earnings over a five-year time horizon.
Figure 10: Peer group cumulative NAV total return performance to 31 October 2025
| 1 month (%) | 3 months (%) | 6 months (%) | 1 year (%) | 3 years (%) | 5 years (%) | 10 years (%) | |
|---|---|---|---|---|---|---|---|
| PHI | 7.4 | 22.3 | 42.0 | 30.2 | 52.8 | 55.9 | 374.7 |
| Pacific Assets | 5.9 | 6.2 | 12.0 | (1.1) | 15.0 | 41.5 | 145.6 |
| Schroder Asia Total Return | 6.6 | 12.8 | 30.7 | 18.1 | 61.7 | 50.7 | 250.9 |
| Schroder AsiaPacific | 7.1 | 14.2 | 32.6 | 24.5 | 61.6 | 43.1 | 202.5 |
| PHI rank | 1/4 | 1/4 | 1/4 | 1/4 | 3/4 | 1/4 | 1/4 |
| Sector arithmetic avg. | 6.7 | 13.9 | 29.3 | 17.9 | 47.8 | 47.8 | 243.4 |
The average market cap for the peer group at £620.3m, which is around 17% higher than when we last published (£530.2m). PHI remains the second-largest fund in terms of market capitalisation.
As discussed on page 17, while PHI’s ongoing charges ratio has seen a small uptick for the last two financial years, it was previously on a declining trend for a number of years and remains the lowest in the sector by a margin at 0.75% (the next-lowest being Schroder Asia Total Return at 0.88%). The average ongoing charges ratio for the peer group as a whole has also increased fractionally – from 0.90% to 0.91%.
All members of the peer group continue to trade at a discount, although the sector average discount has narrowed marginally from 9.7% to 9.6% (as at 20 November 2025). PHI has tended to trade at a small premium to the sector average historically, which we think reflects its peer-group-beating performance over the longer term, as well the board’s efforts at repurchasing PHI stock. PHI’s discount is currently 1.1 percentage points above the sector average – offering an additional opportunity, in our view.
As we have previously noted, it is little surprise that, given its focus on capital growth, PHI’s dividend yield remains the lowest in the sector (PHI pays dividends to the extent required to maintain its investment trust status – see below – and whilst one is being proposed for the year ended 31 July 2025, there have been years where it has not paid a dividend).
Figure 11: Peer group comparison – size, fees, discount, yield and gearing as at 20 November 2025
| Market cap (£m) | St. dev. of NAV over 5 years | Ongoing charges (%) | Perf. fee | Premium/ (discount) (%) | Dividend yield (%) | Gross gearing (%)2 | Net gearing (%)2 | |
|---|---|---|---|---|---|---|---|---|
| PHI | 626.2 | 17.80 | 0.75 | No | (9.6) | 0.20 | 7.4 | 7.4 |
| Pacific Assets | 425.1 | 12.99 | 1.10 | No | (10.0) | 1.08 | Nil | (4.4) |
| Schroder Asia Total Return | 527.5 | 15.16 | 0.90/1.501 | Yes | (0.7) | 2.04 | 6.5 | 5.3 |
| Schroder AsiaPacific | 868.3 | 14.17 | 0.88 | No | (11.0) | 1.89 | 4.0 | 4.2 |
| PHI rank3 | 2/4 | 4/4 | 1/4 | 3/4 | 4/4 | 4/4 | 4/4 | |
| Sector arithmetic avg. | 611.8 | 15.03 | 0.91/1.061 | (7.8) | 1.30 | 4.5 | 3.1 |
In terms of net gearing levels, whereas PHI previously had one of the lowest levels in the sector, it has moved up and is now the highest, reflecting the managers’ conviction in the scale of the opportunity. Nonetheless, at 6.8%, PHI’s gearing level is still quite modest. PHI’s NAV returns continue to exhibit the greatest volatility within the peer group, but as we have previously commented, this is by no means high, and we think it is more than compensated for by its superior long-term performance.
Dividend
Capital-growth-focused; any dividend is the minimum required to maintain PHI’s investment trust status.
PHI’s primary objective is to generate capital growth. Any dividend paid is by way of one final payment per year, following approval at the AGM. For the avoidance of doubt, PHI’s board has made it clear that investors should not consider investing in the company if they require income from their investment (in four of the last 10 years – 2017, 2018, 2019 and 2021 – PHI did not pay a dividend at all). In years of a revenue deficit, PHI is not required to pay a dividend and the board has also said that it does not intend to draw on PHI’s revenue reserve to pay or maintain dividends.
For the year ended 31 July 2025, PHI generated a revenue surplus of £2.1m, equivalent to 2.34p per share (2024: a revenue surplus of £3.6m, equivalent to 3.82p per share), which is a 38.7% decrease over the prior year. Reflecting this, the board proposed a final dividend of 1.50p per share (payable on 1 December 2025) for the 2025 financial year. The 1.50p, which is a dividend yield of 0.20% on PHI’s share price of 752.0p as at 20 November 2025, represents a decrease of 53.8% over the prior year.
Figure 12: PHI ordinary dividends over the last five financial years (ended 31 July)
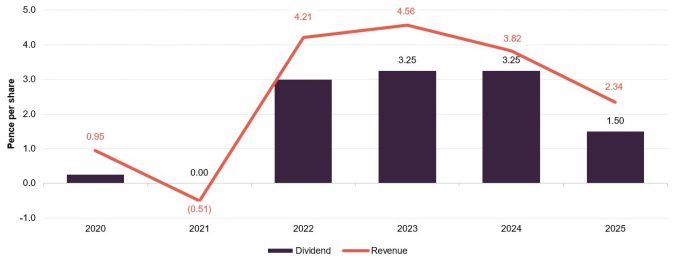
Source: Pacific Horizon Investment Trust, Marten & Co
Premium/(discount)
PHI aiming to maintaining discount in single digits
For some years, PHI has used share repurchases to help moderate its discount. However, when PHI announced the introduction of a five-year performance-related tender (see below) in April this year, it said that it would continue to repurchase shares but with the ambition of maintaining the discount to NAV in single digits, on a sustainable basis, in normal market conditions. As is illustrated in Figure 13, this policy has been successful with the discount averaging 9.6% since the announcement with a peak of 11.1%.
Reflecting this, as at 20 November 2025, PHI was trading at a discount of 9.6%, which is narrower than its one-year average off 11.1%, broadly in line with its three-year average of 9.7% and markedly wider than its five-year average of 4.9%. PHI’s one-year trading range is between discounts of 7.8% and 15.9%.
As discussed in previous notes (see page 23), macro factors have typically outweighed stock-specific ones in driving PHI’s rating in recent years, with its premium/(discount) sensitive to shifts in market expectations for inflation and interest rates – derating when higher rates are anticipated, as these tend to weigh on growth stocks, and recovering when sentiment improves. The discount has also widened during periods of broader risk aversion, particularly when concerns over Asia’s outlook have intensified. The new discount policy should now limit the extent of any widening when sentiment deteriorates.
Many of the events highlighted in Figure 13 have been discussed in our previous notes (see page 23 of this note) but we would highlight that in our last note, we commented that we could see significant discount narrowing potential, particularly if Trump’s tariffs turn out to be less onerous than expected and we saw an improvement in China’s and Asia’s performance. Broadly speaking, Trump has been forced to roll back the worst of his tariff policies and the outlook for China and Asia has continued to improve, with PHI’s discount and that of its peers narrowing as their performance and sentiment towards Asia has improved. With signs that US interest rates may need to fall to prop up its faltering economy, there should be more to come. PHI, with its strong growth bias, is the best-positioned of its peers to benefit from this. We think this should lead to further discount compression, and if China and Asia are able to outperform in the way PHI’s managers expect, we believe PHI could return to a premium rating and once again issue stock.
Figure 13: PHI premium/(discount) over five years
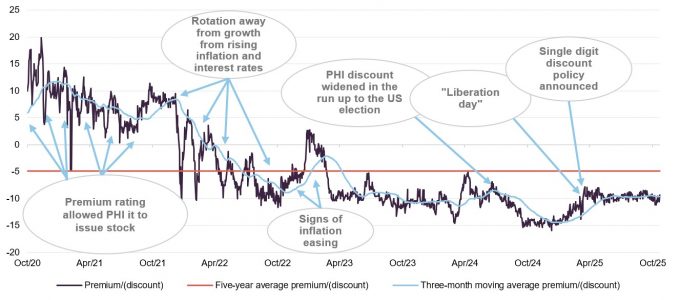
Source: Morningstar, Marten & Co
Performance-related conditional tender offer in 2030
On 16 April 2025, PHI announced that it would provide shareholders with a 25% tender offer in 2030, if the trust underperforms its reference index – the MSCI All Country Asia ex Japan Index (total return in sterling) – over the five-year period from 31 March 2025 to 31 March 2030. We think the conditional tender should help to focus the managers’ attention on driving outperformance and also gives shareholders comfort that there is a route to a partial exit, close to NAV, if relative performance disappoints over the next five years.
Structure
Fees and costs
Baillie Gifford & Co Limited acts as PHI’s alternative investment fund manager and has delegated portfolio management services to Baillie Gifford & Co. PHI has a tiered management fee that is 0.75% on the first £50m of net assets, 0.65% on the next £200m of net assets and 0.55% on the remaining net assets.
Management fees are calculated and paid quarterly in arrears and there is no performance fee. The managers may terminate the management agreement on six months’ notice and the company may terminate it on three months’ notice. Baillie Gifford & Co Limited also provides company secretarial services to PHI, which are included as part of the management agreement.
Figure 14: Ongoing charges ratio (%)1
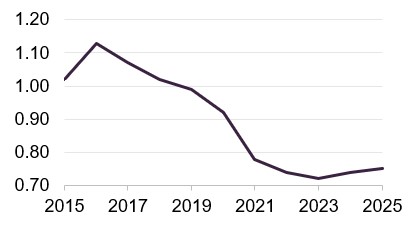
Source: Pacific Horizon Investment Trust Note: 1) For financial years ended 31 July.
Reflecting both its tiered fee structure, a reduction in the management fee and strong share issuance up until the end of 2021, PHI’s ongoing charges ratio was on a declining trend, but as illustrated in Figure 14, it has ticked up by 3bp over the last two years (from 0.72% for FY 2023, to 0.74% for FY2024 and 0.75% for FY2025). However, PHI’s net assets have seen a strong recovery during the last six months, which should put downward pressure on its ongoing charges ratio again.
Regardless, PHI continues to have the lowest ongoing charges ratio in its peer group (see Figure 14 in the peer group comparison on page 14) with its ongoing charges ratio being 16bp below the sector average).
Capital structure
PHI has a simple capital structure with one class of ordinary share in issue.
PHI has a simple capital structure with just one class of ordinary share in issue. Its ordinary shares have a premium main market listing on the London Stock Exchange and, as at 20 November 2025, there were 92,074,961 of these in issue, of which 8,892,711 were held in treasury. The number of shares in issue with voting rights was 83,182,250.
Each year, the company takes powers to buy back up to 14.99% of its shares at a discount to NAV. It also asks for permission to issue up to 10% of its issued share capital at a premium to NAV. As discussed on page 15, these authorities give the board a means by which they can manage PHI’s premium/discount.
Gearing
PHI has a £60m multi-currency revolving credit facility.
PHI has a £60m multi-currency revolving credit facility (RCF) with The Royal Bank of Scotland International Limited that expires in March 2026. Gearing parameters are set by the board and the managers operate within these, currently the range is set at -15% (i.e. a net cash position) to +15%.
At the end of October 2025, PHI had gross gearing of 7.4% and net gearing of 7.4%, which is higher than when we last published (5.2% and 3.1% as at the end of February 2025). The main covenants relating to the RCF are that PHI’s borrowings should not exceed 30% of its adjusted net asset value, and its net asset value should be at least £300m. The facility has a non-utilisation fee of 0.4%.
Major shareholders
Figure 15 illustrates that PHI has a significant retail presence within its share register, reflected by the prominence of the major platforms, which account for over 40%. Wealth managers are also a significant element, accounting for over 20%. Since we last published, J. Safra Sarasin, a Swiss private bank that has a strong focus on sustainability, has continued to add to its position.
Figure 15: Major shareholders as at 30 October 2025
Figure 16: Percentage point changes in shareholdings since 12 March 20251
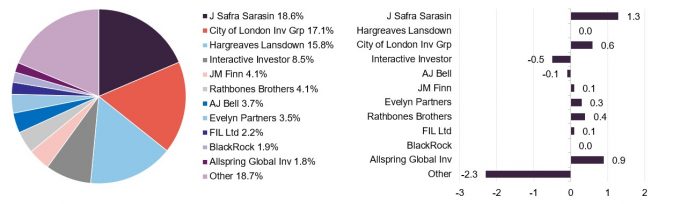
Source: Bloomberg, Marten & Co
Source: Bloomberg, Marten & Co. Note: 1) The date of the shareholder data used when we last published on PHI.
Five-yearly continuation votes
The next continuation vote is due at the 2026 AGM.
Shareholders are given the opportunity to vote on the continuation of the company every five years. Shareholders approved PHI’s continuation at the trust’s 2021 AGM. The next continuation vote is due at the 2026 AGM.
Financial calendar
PHI’s financial year-end is 31 July. It usually publishes its annual results in September (interims in March) and holds its AGMs in November. Where applicable, it pays its annual dividend shortly after its AGM.
Management team
Roderick Snell joined Baillie Gifford in 2006 and became a partner in 2023. He has managed the Baillie Gifford Pacific Fund OEIC since 2010 and has been lead manager of PHI’s portfolio since June 2021, having been its deputy manager since September 2013. Prior to joining Baillie Gifford’s emerging markets team, Roderick spent time in its UK and European equity teams. He is a co-manager of the emerging markets leading companies strategy. Roderick graduated from the University of Edinburgh in 2006 with a BSc (Hons.) in Medical Biology.
Ben Durrant joined Baillie Gifford in 2017 and, prior to joining the emerging markets team, spent time in Baillie Gifford’s UK, global discovery and private markets teams. Prior to joining Baillie Gifford, he worked for RBS in their group strategy and corporate finance team. Ben is a chartered accountant and a CFA charterholder. He graduated from the University of Edinburgh in 2012 with a BSc (Hons.) in Mathematics, and has co-managed the Baillie Gifford Pacific Fund since 2021.
Board
All directors submit themselves for re-election annually.
PHI’s board comprises five directors, all of which are non-executive, considered to be independent of the investment manager and do not sit together on other boards. The directors put themselves forward for re-election at the first AGM following their appointment. Thereafter, directors submit themselves annually for re-election.
Angela Lane is the longest-serving director, with just seven years of service under her belt, while the average length of director service is 5.3 years.
Directors’ fees
There is a limit of £200,000 for the aggregate of fees paid to directors, which forms part of the company’s articles of association, and shareholders would have to vote to approve any change to this limit. For the current financial year, the fee rates for the directors have been increased by 3.5% over the prior year. At these fee rates, the total directors’ fees amount to £178,540, which is comfortably within the £200,000 limit.
Figure 17: Board member – length of service and shareholdings
| Director | Position | Date of appointment | Length of service (years) | Annual fee (£)1 | Share-holding 2 | Years of fee invested3 |
| Roger Yates | Chairman | 13 March 2024 | 1.7 | 46,580 | 15,000 | 2.4 |
| Angela Lane | Audit committee chairman and senior independent director | 1 October 2018 | 7.1 | 38,810 | 8,923 | 1.7 |
| Sir Robert Chote | Director | 25 November 2020 | 5.0 | 31,050 | 500 | 0.1 |
| Wee-Li Hee | Director | 1 June 2020 | 5.5 | 31,050 | 10,000 | 2.4 |
| Joe Studwell | Director | 9 November 2018 | 7.0 | 31,050 | 5,000 | 1.2 |
| Average (service length, annual fee, shareholding, years of fee invested) | 5.3 | 35,708 | 7,885 | 1.6 | ||
Recent share purchase activity by directors
Since we last published in March 2025, all directors’ holdings have remained the same. All of the directors have personal investments in the trust and the average level of fees invested is 1.6 years; both of which are favourable in our view, as it shows commitment to PHI and helps to align directors’ interests with those of shareholders.
Roger Yates (chairman)
Roger was chief executive of Henderson Global Investors from 1999 to 2008, prior to which he had fund management roles at Invesco/LGT and Morgan Grenfell Asset Management. He is currently the senior independent director of Mitie Group Plc, the chair of British Biotech Trust and non-executive director of Jupiter Fund Management Plc. Roger was previously the senior independent director of both St James’s Place and IG Group Plc. He was also previously the chair for Electra Private Equity Plc and was a non-executive director of JP Morgan Elect Plc.
Angela Lane (audit committee chair and senior independent director)
Angela became both PHI’s audit committee chair and senior independent director on 10 November 2020. She is a qualified accountant and previously spent 18 years working as a private equity investor for 3i Plc. Angela has held several non-executive and advisory roles for small and medium capitalised companies across a range of industries. She is a non-executive director and chair of the audit committee of BlackRock Throgmorton Trust Plc and Seraphim Space Investment Trust Plc. Previously, Angela was non-executive chairman of Huntswood CTC and a non-executive director of Dunedin Enterprise Investment Trust Plc where she was chair of the audit committee.
Sir Robert Chote (director)
Sir Robert is an economist, journalist and academic. He became chairman of the Northern Ireland Fiscal Council in 2021 and will begin his tenure as President of Trinity College, Oxford, in November 2025. He became chairman of the UK Statistics Authority in 2022 and is stepping down in September 2025. He served as chairman of the Office for Budget Responsibility from 2010 to 2020. Sir Robert served as director of the Institute for Fiscal Studies from 2002 to 2010, as an advisor to the International Monetary Fund from 1999 to 2002, and as economics editor of the Financial Times from 1995 to 1999. He is a visiting professor at the Department of Political Economy, Kings College London. Sir Robert also serves on advisory boards at the Warwick Manufacturing Group and the Centre for Economic Performance at the London School of Economics.
Wee-Li Hee (director)
Wee-Li is an experienced Asian analyst, fund manager and CFA Charterholder. Brought up in Singapore, she speaks fluent Mandarin and studied in the UK at the University of Leeds and the London School of Economics and Political Science. After graduation in 2002, she joined First State Investments in Singapore as an analyst, subsequently moving to the firm’s Edinburgh office in 2005. Having co-managed Scottish Oriental Smaller Companies Trust Plc, Wee-Li became lead manager in 2014, stepping back due to family commitments to return to a co-manager role in 2017 and retiring at the end of 2019. She is a director of Melville Paisley Investments.
Joe Studwell (director)
Richard Frank (“Joe”) Studwell has spent over 25 years working in East Asia as a journalist, independent researcher at Dragonomics, and author under the name of Joe Studwell. His published works include Asian Godfathers: Money and Power in Hong Kong and South East Asia and How Asia Works: Success and Failure in the World’s Most Dynamic Region.
SWOT analysis
Figure 18: SWOT analysis for PHI

| A sharp focus on growth investing within the Asia ex-Japan region, providing investors with exposure to high-quality growing companies. The managers take a long-term view and do not waver even if market conditions are unfavourable. |
| The board and the managers have demonstrated a clear prioritising of shareholder interests, such as through the five-year performance-related tender offer in 2030 and the single-digit discount control policy. |

| PHI suffers from periods when absolute and/or relative performance is difficult, particularly when the market backdrop is unhelpful for growth investors, such as the period of higher inflation and interest rates from late 2021. Asia tends to suffer when interest rates rise in the US, for example. |
| Low income yield, although this should be well understood by shareholders. |

| There are increasing signs that growth investing is coming back into favour, against a backdrop of interest rate cuts, both in the US and globally. |
| Investors appear to be looking more favourably at Asia and at growth investing more generally. After a difficult couple of years, China is recovering, while policy and fiscal uncertainty in the US has been driving a rotation away from that market to other regions. |

| The market could once again turn against growth investing, particularly if inflation re-emerges as a threat and nominal GDP growth picks up. However, there is a risk of stagflation in more developed markets. This could limit the capacity for interest rate rises, and Asia would likely benefit from this scenario. |
| Single stock issues could hurt performance, given the unapologetically bottom-up nature of the fund. |
Bull vs bear case
Figure 19: Bull vs bear case for PHI


| Performance | Absolute performance has been positive over all time periods and PHI’s NAV total returns are top of its peer group for all periods, with the exception of three years – a period where inflation and interest rates have been elevated, particularly in developed markets. Inflation is edging up in the US, but the growth outlook has also deteriorated, limiting the capacity to raise interest rates, while China has also been recovering. PHI looks well-placed for further outperformance. | PHI has had a difficult few years of relative underperformance. This has largely been due to growth investing being out of favour against a backdrop of rising inflation and interest rates. Decisions to increase the exposure to China and semiconductors early in 2024 also weighed on PHI’s performance last year, but this has since reversed. |
| Dividends | PHI focuses on capital growth rather than income and the annual dividend is paid purely to maintains its investment trust status. | PHI’s board has made it clear that investors should not consider investing in the company if they require income from their investment. |
| Outlook | Asia and growth investing appear to be coming into favour with investors, which should suit PHI. | Growth investing generally benefits from subdued inflation and interest rates, while capital flows in and out of Asia tend to be sensitive to US interest rates. Although US inflation has been edging up, the direction of interest rates still looks to be down for now. |
| Discount | The board has a control mechanism to keep the discount in single figures, which has already had a material impact. The current discount could narrow or even move to a premium if the market environment is positive for PHI and its stock picks look like making a comeback. | The discount could widen further and the control mechanism come under pressure if inflation picks up, pushes up interest rates, and this leads to a renewed period of underperformance for growth investing. |
Previous publications
Readers interested in further information about PHI may wish to read our previous notes (details are provided in Figure 20 below). You can read the notes by clicking on them in Figure 20 or by visiting our website.
Figure 20: QuotedData’s previously published notes on PHI
| Title | Note type | Publication date |
|---|---|---|
| Invest in Asian growth | Initiation | 21 March 2016 |
| Brave new world | Update | 10 October 2016 |
| Top of the pops! | Annual overview | 30 October 2017 |
| Pause for breath? | Annual overview | 8 November 2018 |
| 2018 re-calibration paying off | Annual overview | 8 November 2019 |
| Powered by technology | Annual overview | 20 January 2021 |
| Blistering performance | Annual overview | 25 November 2021 |
| Convergence opportunity | Annual overview | 8 December 2022 |
| Consistent growth and quality bias | Annual overview | 6 December 2023 |
| Inflection point approaching? | Annual overview | 19 March 2025 |
IMPORTANT INFORMATION
This marketing communication has been prepared for Pacific Horizon Investment Trust Plc by Marten & Co (which is authorised and regulated by the Financial Conduct Authority) and is non-independent research as defined under Article 36 of the Commission Delegated Regulation (EU) 2017/565 of 25 April 2016 supplementing the Markets in Financial Instruments Directive (MIFID). It is intended for use by investment professionals as defined in article 19 (5) of the Financial Services Act 2000 (Financial Promotion) Order 2005. Marten & Co is not authorised to give advice to retail clients and, if you are not a professional investor, or in any other way are prohibited or restricted from receiving this information, you should disregard it. The note does not have regard to the specific investment objectives, financial situation and needs of any specific person who may receive it.
The note has not been prepared in accordance with legal requirements designed to promote the independence of investment research and as such is considered to be a marketing communication. The analysts who prepared this note are not constrained from dealing ahead of it, but in practice, and in accordance with our internal code of good conduct, will refrain from doing so for the period from which they first obtained the information necessary to prepare the note until one month after the note’s publication. Nevertheless, they may have an interest in any of the securities mentioned within this note.
This note has been compiled from publicly available information. This note is not directed at any person in any jurisdiction where (by reason of that person’s nationality, residence or otherwise) the publication or availability of this note is prohibited.
Accuracy of Content: Whilst Marten & Co uses reasonable efforts to obtain information from sources which we believe to be reliable and to ensure that the information in this note is up to date and accurate, we make no representation or warranty that the information contained in this note is accurate, reliable or complete. The information contained in this note is provided by Marten & Co for personal use and information purposes generally. You are solely liable for any use you may make of this information. The information is inherently subject to change without notice and may become outdated. You, therefore, should verify any information obtained from this note before you use it.
No Advice: Nothing contained in this note constitutes or should be construed to constitute investment, legal, tax or other advice.
No Representation or Warranty: No representation, warranty or guarantee of any kind, express or implied is given by Marten & Co in respect of any information contained on this note.
Exclusion of Liability: To the fullest extent allowed by law, Marten & Co shall not be liable for any direct or indirect losses, damages, costs or expenses incurred or suffered by you arising out or in connection with the access to, use of or reliance on any information contained on this note. In no circumstance shall Marten & Co and its employees have any liability for consequential or special damages.
Governing Law and Jurisdiction: These terms and conditions and all matters connected with them, are governed by the laws of England and Wales and shall be subject to the exclusive jurisdiction of the English courts. If you access this note from outside the UK, you are responsible for ensuring compliance with any local laws relating to access.
No information contained in this note shall form the basis of, or be relied upon in connection with, any offer or commitment whatsoever in any jurisdiction.
Investment Performance Information: Please remember that past performance is not necessarily a guide to the future and that the value of shares and the income from them can go down as well as up. Exchange rates may also cause the value of underlying overseas investments to go down as well as up. Marten & Co may write on companies that use gearing in a number of forms that can increase volatility and, in some cases, to a complete loss of an investment.