Firing up the cylinders
RIT Capital Partners’ (RIT’s) performance appears to have improved following a reshuffle of its leadership team last year and the adoption of a more concentrated approach. All three investment pillars – quoted equities, private investments and uncorrelated strategies – have delivered positive returns.
RIT’s private portfolio, which had previously weighed on performance, has generated some profitable exits this year as M&A and IPO activity has increased after several years of lower activity. The company expects further realisations in the near term.
According to the company, high-conviction thematic exposure in its more concentrated quoted equities pillar has produced positive results from China and Japan, as well as European defence and aerospace. The uncorrelated strategies portfolio provides diversification and potential downside protection. RIT states that as diversification becomes a greater focus across markets, its multi-asset structure may position it to benefit from renewed demand for broader exposure.
Access growth while managing risk
RIT aims to deliver long-term capital growth, providing shareholders with access to growth opportunities typically inaccessible to individual investors and equity-like returns with lower risk than equity markets. RIT invests in a widely-diversified, global portfolio across a range of asset classes, both quoted and unquoted. It allocates part of the portfolio to exceptional managers to ensure access to the best external talent available.
| 12 months ended | Share price total return (%) | NAV total return (%) | MSCI ACWI3 total return (%) | CPI +3% per annum (%) |
|---|---|---|---|---|
| 31/10/2021 | 44.4 | 37.1 | 33.2 | 6.1 |
| 31/10/2022 | (13.3) | (9.7) | (10.6) | 13.1 |
| 31/10/2023 | (19.2) | (0.8) | 6.6 | 9.7 |
| 31/10/2024 | 6.9 | 11.8 | 28.7 | 4.7 |
| 31/10/2025 | 19.5 | 13.4 | 21.2 | 6.8 |
Market backdrop
Global investment markets have shown resilience amid macroeconomic uncertainty, including trade tensions, increasing government debt, and subdued GDP growth. Inflation has been gradually receding in many economies, and interest rates have also trended downwards, although the pace of future cuts remains uncertain, particularly in the US. The rotation out of US equities into globally diversified strategies may align with RIT’s approach.
Equity markets are at record highs, while in private markets, M&A activity has rebounded and IPOs appear to be back on the agenda. Against this backdrop, RIT has reported strong performance across its three investment pillars. Its private portfolio has seen a number of realisations (with the potential for more to come); thematic equity investments are ongoing; and its uncorrelated strategies have been a continued source of diversified returns. This report examines the drivers of performance in RIT’s private and quoted equities portfolios.
Harvest time in private portfolio
Activity has picked up in private markets
After a period of two or three years with limited realisations, exit activity in private markets has increased in 2025, with the US recording 109 IPOs in the first half of the year, which EY states is the highest half-year total since 2021. M&A activity has also increased, and the combination has contributed to RIT’s NAV returns this year.
Figure 1: Realisations in RIT’s private portfolio in 2025
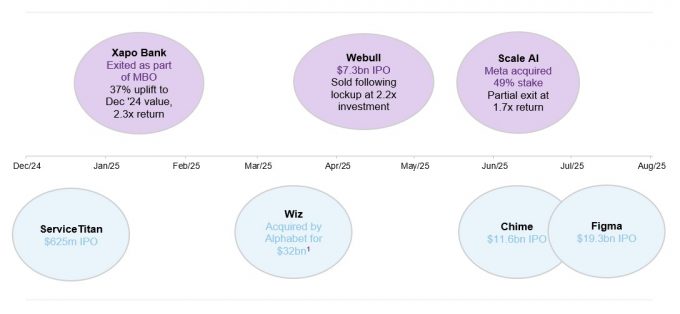
Source: RIT Capital Partners, Marten & Co. Note 1) subject to regulatory approval.
Around 60% of its directly held private portfolio was realised in the first half of this year, with further activity announced in the funds it invests in. Figure 1 illustrates the timeline of realisations in RIT’s portfolio so far in 2025, with the purple bubbles indicating realisations in RIT’s direct holdings and blue bubbles showing exits among its funds.
Three realisations from RIT’s direct private portfolio in 2025 so far, at large premiums to carrying values
In January, RIT exited its position in fintech company Xapo Bank, which was among the first regulated cryptocurrency banks globally, as part of a management buyout at a 37% uplift to book value. Its investment generated a 2.3x return and a 28% IRR. Webull, the commission-free trading platform, went public in April, transitioning to RIT’s quoted equities portfolio. Following a six-month lock up period, RIT sold its shares in Webull, achieving an investment multiple of 2.2x. Scale AI was the next corporate activity in its private portfolio, where Meta’s acquisition of a 49% stake valued the company at $29bn, which was 109% above the value held on RIT’s books at the end of 2024.
There have been two IPOs across the private equity funds in which RIT invests, plus ServiceTitan’s listing in December 2024. The two most recent were digital banking company Chime and website design app Figma. Alphabet’s proposed $32bn acquisition of cloud security company Wiz, which is subject to regulatory approval and is expected to close in 2026, would be the largest in the hyperscaler’s history and could represent a significant increase to the company’s previous valuation.
Returns from RIT’s private investment pillar back in line with long-term trend
This combined activity contributed to a 9.0% return for the RIT’s private portfolio in the first half of 2025, bringing the pillar in line with its longer-term annualised performance of 19% over five years and 15% over 10 years.
Two of RIT’s largest directly held private holdings appear to be moving closer to listing. Motive, which is its largest direct private holding at 2.2% of NAV, has hired banks and is planning an IPO by the end of the year. Kraken, a cryptocurrency exchange that accounts for 0.6% of NAV, is reportedly considering a listing early next year. Both companies are profiled in more detail on pages 10 and 11.
RIT’s private portfolio accounted for 32% of the trust at the end of October, a reduction from 40.7% at the end of 2022, and within the 25%-33% range guided by the board. With two potential IPOs and planned trimming of the portfolio at the margins, RIT’s manager states that it intends to reduce exposure further. The realised capital has been used to fund share buybacks, with the company having repurchased £66.5m of its shares in the year to date, and some capital has been selectively redeployed into quoted equities and private assets.
These realised uplifts to the book value may reflect the conservative valuations applied across the private equity sector, as well as the mature nature of RIT’s private portfolio (with 65% of the portfolio invested in vintages pre-2020 – as shown in Figure 2) and the type of business it invests in. Figure 3 shows the sector focus of RIT’s private exposure (across both direct positions and underlying positions in the funds it invests in).
The sector focus is weighted towards technology and healthcare/life sciences, with significant exposure to the US. The companies in which it invests appear to share similar characteristics, including later-stage investments with low levels of financial leverage, which may suggest lower default risk. Early-stage venture capital investments have seemed to be a difficult market with very few exits, and this segment represents less than 10% of RIT’s overall private portfolio (and less than 3% of NAV).
Figure 2: Private fund NAV by vintage year at 30 June 2025
Figure 3: Private investments by sector at 30 June 2025
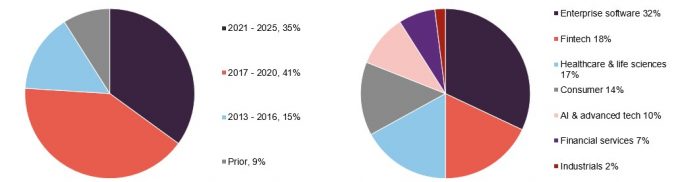
Source: RIT Capital Partners
Source: RIT Capital Partners
After several years of limited activity, RIT’s manager states that the recent uptick in realisations demonstrates that its approach to the private portfolio has been effective. Although RIT’s manager is reducing its private portfolio to the lower end of the board’s preferred range, supported by the recent exits, the manager believes that companies such as Kraken, Motive, and SpaceX have strong potential. SpaceX is not accessible to most investors, which the manager identifies as another characteristic of RIT’s private portfolio.
The manager states that it has unique access to a range of fund managers, which it believes provides exposure to a variety of funds and diversified vintages, as well as co-investment opportunities with these fund managers.
Concentration of equities portfolio
RIT’s quoted equities portfolio weighted towards manager’s high conviction themes, such as a multipolar world
RIT’s private portfolio has significant exposure to technology, while its public portfolio is weighted towards high-conviction themes. Whilst the US remains a key market for the company, RIT continues to diversify into Europe and Asia, citing an ongoing shift towards a multipolar world. The company states that it aims to capture these opportunities through specialist managers.
A key priority for Maggie Fanari since taking over at RIT in 2024 has been to concentrate the portfolio across all three pillars. In the quoted equities pillar, the company reports making progress in reducing the number of stocks it holds. According to the company, it aims to make higher-conviction investments by leveraging its network in an effort to gain a competitive advantage. This approach applies to several of its portfolio companies, including Coupang, the Korean e-commerce company that was held in RIT’s private portfolio before listing in 2021 (it remains the only name retained after transitioning from private to public holdings); Galderma, a Swiss pharmaceutical company that RIT had exposure to prior to its public listing in 2024 through its relationship with private equity house EQT; and Seibu, a Japanese transportation company that was a co-investment with hedge fund manager 3D Opportunity.
The manager is also looking to grow exposure to two other investment themes – aerospace and defence in Europe (with Russian aggression appearing to prompt many nations to commit to increased spending on defence) and European sovereignty (with recent US policy highlighting what the manager sees as a need for nations to become more independent in a multipolar world where economic influence may be increasingly geographically dispersed, which could reshape supply chains and capital flows across many sectors, including AI, construction, and material procurement).
RIT has exited positions in prominent names including Visa and Mastercard
RIT’s move to concentrate its equities portfolio to reflect key thematic trends saw it sell out of some prominent names. It exited positions in global payments companies Visa and Mastercard as well as London Stock Exchange Group (LSEG) earlier this year after all three performed strongly relative to wider markets following “Liberation Day”. RIT’s manager states that both Visa and Mastercard have valuable data and management teams and that if they were to derate, the manager would not exclude buying back in.
RIT’s other themes include corporate governance reform in Japan, value in China, and growth of the biotech and life sciences sector. These themes are largely accounted for through investment in external managers (see page 9 for more detail on RIT’s hedge fund manager exposure).
Figure 4: Quoted equities by theme at 30 June 2025
Figure 5: Quoted equities by region at 30 June 2025
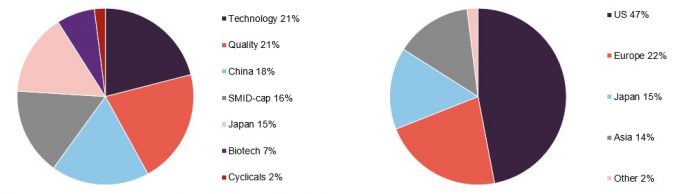
Source: RIT Capital Partners
Source: RIT Capital Partners
The manager believes that corporate governance reforms in Japan are still in their early stages, and that further developments could unlock additional value. The manager also states that its conviction regarding China being undervalued increased following the release of the DeepSeek AI model earlier this year, which it says demonstrated that China is competing or leading in several technology areas. According to the manager, recent trade negotiations with the US suggested that China may have stronger negotiating positions than previously assumed.
The manager states that despite a difficult first half of 2025, the biotech and life sciences sector appears to be picking up. Funding to the industry slowed following a spike after COVID, and the manager believes that this decreased further after Trump’s inauguration as policy and funding cuts may have caused uncertainty and a lack of visibility for investors. Deal volumes appear to have increased since the summer, and clinical trial data has improved. According to RIT’s manager, the performance of its biotech and life science managers has rebounded after a difficult period.
Asset allocation
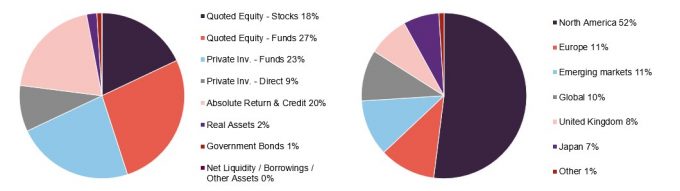
Figure 6: Asset allocation by asset type at 31 October 2025
Figure 7: Asset allocation by geography at 31 October 2025
Source: RIT Capital Partners
Source: RIT Capital Partners
Quoted equities remains RIT’s largest allocation at 45% (through direct holdings – 18%, and in funds – 27%) as shown in Figure 6. Its 32% allocation to private investments was mainly through funds (23%), with 9% held directly at the end of October 2025, down from 35.9% at the end of 2023 after a number of recent realisations. The manager expects this will fall further to the high-20% region, as and when further exits materialise. The manager labels its third investment pillar uncorrelated strategies, which is mainly made up of absolute return and credit investments accessed through specialist external hedge fund managers (20% of NAV), plus real assets (such as gold) and government bonds. According to the manager, these investments have low return correlation to equity markets and add diversification to the portfolio. The three-pillar design – quoted equities, private investments, and uncorrelated strategies – is described by the manager as underpinning RIT’s aim of creating a diversified and resilient portfolio intended to compound returns through cycles.
Largest holdings
Figure 8: Five largest direct quoted equity positions at 30 June 2025
| Country | Industry | Value £m | Percentage of NAV (%) | |
|---|---|---|---|---|
| Microsoft | United States | Software & services | 75.3 | 2.0 |
| Webull1 | United States | Retail securities brokerage | 69.6 | 1.9 |
| National Grid | United Kingdom | Utilities | 60.3 | 1.6 |
| Somnigroup | United States | Home furnishings | 56.0 | 1.5 |
| Amazon | United States | E-commerce | 53.6 | 1.4 |
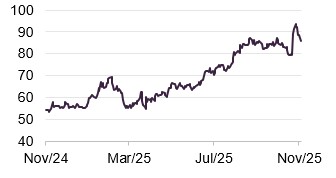
Microsoft
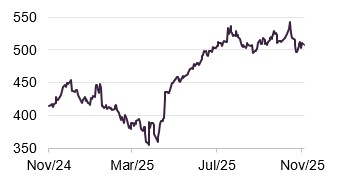
Figure 9: Microsoft share price (USD)
Source: Bloomberg
Microsoft was RIT’s largest direct equity holding at the end of June, accounting for 2.0% of NAV. The company’s stock price is around all-time highs and is up 22.3% over the past 12 months. The company has made significant investments in AI, including in AI infrastructure, and plans an $80bn data centre build-out in 2025, which it states is intended to address potential capacity constraints as AI usage increases. There are concerns that the heavy investment may dampen near-term margins and cash flow. In an earnings update, the company reported that revenue increased 15% to $281.7bn in the year to the end of June 2025, with Azure cloud sales up 34%.
Webull
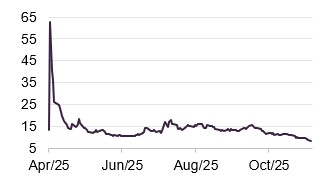
Figure 10: Webull share price (USD)
Source: Bloomberg
RIT had held Webull – a stock and fund brokerage platform that combines traditional investor services on a unified platform – in its private portfolio until Webull listed earlier this year. Following its IPO in April 2025, the share price settled at around $14, after reaching over $60 in the days following its listing at $13.25. RIT’s investment included listed Class A ordinary shares (which were subject to a six-month lock-up provision), as well as other positions in Webull’s capital structure, and had an estimated value at the time of IPO of around $121m or £93m. The investment was valued at a discount on RIT’s books due to the illiquid nature of its shares subject to the lock-up provision. After the end of the lockup provision in October, RIT fully exited its position in Webull at a cash return of around 2x on its investment. Since then, the share price has fallen to just above $8.
National Grid
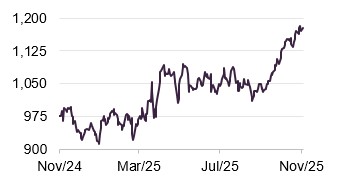
Figure 11: National Grid share price (GBp)
Source: Bloomberg
RIT took a significant position in energy operator National Grid in 2024. The company’s government-regulated cashflows and potential for growth from energy infrastructure investment were cited as factors in this decision. Shares in the company, which operates electricity transmission and distribution in the northeastern US as well as the UK, are up 24.0% in 2025 as it embarks on a £60bn, five-year grid investment programme that may translate into increased regulated returns and growth. In annual results, National Grid posted a 12% rise in underlying operating profit to £5.4bn and stated that it expects earnings per share to grow by 6% to 8% next year.
Somnigroup
Figure 12: Somnigroup share price (USD)
Source: Bloomberg
Formerly named Tempur Sealy International, Somnigroup is a global bedding company that manufactures and sells mattresses and bedding products. Earlier this year it acquired the largest mattress specialty retailer in the US, Mattress Firm, in a $5bn deal – at which point it also changed its name. It owns brands including Tempur-Pedic, Sealy, and Stearns & Foster, and operates online and from retail outlets such as Mattress Firm and Dreams. In August, the company made an equity investment into AI-sleep technology company Fullpower-AI. The 10-year agreement will provide it with the exclusive rights to embed Fullpower-AI’s Sleeptracker technology into its mattresses. The company believes that this partnership will provide unique consumer sleep insights, enable the development of more targeted product solutions, and reinforce its position in bedding innovation.
Figure 13: Five largest long-only and hedge fund positions at 30 June 2025
| Country | Industry | Value £m | Percentage of NAV (%) | |
|---|---|---|---|---|
| Discerene | Global | All cap, value bias | 189.8 | 5.1 |
| 3D Opportunity | Japan | All cap, diversified | 151.8 | 4.0 |
| Blackrock Strategic Equity | Global | All cap, diversified | 135.4 | 3.6 |
| Springs Opportunities | China | All-cap, diversified | 85.2 | 2.3 |
| HCIF Offshore | United States | All-cap, healthcare | 72.0 | 1.9 |
Discerene
Founded in 2017, Discerene is a Connecticut-based long-only investor focused on fundamental research employing value-investing principles with a long-term approach. The team invests in businesses that appear to be protected by structural barriers to entry or hard assets, at entry prices that the firm considers attractive when these businesses are out of favour, aiming to provide margins of safety. Discerene seeks private equity-like structures to make long-term investments in public companies. The firm states that it has built close relationships with its capital providers, with whom it shares philosophy, values, and investment horizons.
3D Opportunity
3D Opportunity Fund is a hedge fund managed by 3D Investment Partners, a Japan-focused value investor that makes opportunistic investments with a focus on quality. The manager, which was founded in 2015, engages with the management teams of its investee companies with the stated aim of releasing value that it believes is locked up in certain Japanese corporate entities. Following developments over recent years – including a new corporate governance code, increased focus from the government, shareholder activism and private equity interest – Japanese equity markets may have further upside potential.
Figure 14: Five largest direct private positions at 30 June 2025
| Country | Industry | Value £m | Percentage of NAV (%) | |
|---|---|---|---|---|
| Motive | United States | Enterprise software | 80.9 | 2.2 |
| SpaceX | United States | AI & advanced technologies | 31.4 | 0.8 |
| Epic Systems | United States | Healthcare & life sciences | 29.3 | 0.8 |
| Kraken | United States | Fintech | 21.6 | 0.6 |
| Blueground | United States | Consumer | 21.5 | 0.6 |
Motive
RIT’s largest private holding, Motive, is reportedly targeting an IPO before the end of the year (although this may have been delayed by the US government shutdown) and has appointed banks including JPMorgan and Jefferies to facilitate this. The company operates in the transportation logistics sector and provides fleet management services to businesses with the use of AI. Services include financing, maintenance, fuel management, telematics, and driver safety training. Motive’s fleet management software provides real-time data on vehicle performance, driver behaviour, and fuel consumption, which may enable customers to make informed decisions, optimise operations, and improve safety and compliance. The majority of RIT’s underlying investment is in the form of a convertible note that may provide downside protection for shareholder capital while retaining potential equity upside through the conversion feature.
SpaceX
RIT increased its investment in space exploration company SpaceX earlier this year, having first invested in 2024. The manager believes the company’s monopolistic characteristics provide the potential for substantial valuation uplifts. SpaceX’s valuation reached $425bn in September 2025 after it issued shares to EchoStar as part of a $17bn acquisition of the company. According to the manager, that deal could be transformative, potentially securing long-term access to S-band spectrum and global Mobile Satellite Service licences for SpaceX’s Starlink network, which may help it to deliver performance comparable to standard 5G mobile services and potentially increase its presence in the direct-to-device satellite market. RIT’s manager states that it expects SpaceX to become a competitor to traditional telecoms companies, and that its monopolistic position could lead to pricing power.
Kraken
Kraken, a San Francisco-based cryptocurrency exchange, has been preparing for a planned IPO next year with several recent acquisitions and product launches. In October, it acquired Small Exchange, which may allow it to launch its own derivatives products within the US, and in May bought NinjaTrader, whose FCM licence allows Kraken to offer and trade crypto features in the US. Additionally, an SEC lawsuit initially filed in November 2023 was dropped in March this year, which removed a legal obstacle to a Kraken IPO. The company’s value reached $15bn after a funding round in September.
Figure 15: Five largest private fund positions at 30 June 2025
| Country | Industry | Value £m | Percentage of NAV (%) | |
|---|---|---|---|---|
| Thrive funds | United States | Growth equity | 130.0 | 3.5 |
| Greenoaks Capital funds | United States | Growth equity | 126.4 | 3.4 |
| Iconiq funds | United States | Growth equity | 108.0 | 2.9 |
| Ribbit Capital funds | United States | Growth equity | 91.5 | 2.4 |
| BDT Capital funds | United States | Private equity | 67.8 | 1.8 |
Thrive funds
Thrive Capital is a New York-based venture capital firm founded in 2011 that specialises in investments in technology companies, particularly those in the consumer, software, and financial services sectors. The firm focuses on companies that may disrupt traditional industries and create new markets. Thrive invests in companies with leadership teams and a stated vision for the future, and works with them to provide resources and guidance to develop their businesses. RIT invested in Thrive in 2012 and has participated in each of their flagship funds since then. Thrive has partnered with several companies such as Instagram, Stripe, Spotify, OpenAI, Wiz, GitHub, and Oscar Health, and has become difficult to access for other investors.
Greenoaks Capital
Venture capital firm Greenoaks, which was formed in 2012, has a broad investment mandate and can invest across asset classes, industries, sectors and geographies. However, it typically targets technology companies, with a focus on mid-stage venture to early growth stage. It manages $12.6bn (as at the end of 2024) across a range of funds. Its funds are generally concentrated, with around 15 portfolio companies backed per fund, and initial investments ranging from $25m to $75m. Portfolio companies have included Coupang, Databricks, Stripe and Wiz. The upturn in private markets M&A activity appears to have contributed to Greenoaks’ recent performance, including in the case of Wiz. Greenoaks first participated at the Series B round in 2021 and co-led subsequent rounds, committing $300m overall. Earlier this year, Wiz was acquired by Alphabet for $32bn (subject to regulatory approval), which could result in Greenoaks receiving a reported $2bn from the sale. Greenoaks invested in Scale AI, in which Meta acquired a 49% stake at a valuation of $29bn in June. This transaction allowed RIT to partially exit its position at a 109% uplift to book value.
Figure 16: Five largest absolute return and credit positions at 30 June 2025
| Country | Industry | Value £m | Percentage of NAV (%) | |
|---|---|---|---|---|
| Tresidor funds | Europe | Credit | 168.9 | 4.5 |
| Attestor Value | Global | Credit | 106.6 | 2.8 |
| Atos corporate bond | Europe | Credit | 43.1 | 1.1 |
| ARCM | Asia | Credit | 38.1 | 1.0 |
| Liontree Advisory loan note | United States | Credit | 29.2 | 0.8 |
Tresidor funds
Tresidor is managed by Tresidor Investment Management LLP, a London-based alternative investment manager that uses a fundamental research process to invest across a range of tradeable European credit opportunities, including distressed debt and special situations investments. The firm focuses on credit from companies that it assesses to have a low probability of impairment, based on factors such as collateral, asset value, business characteristics, liquidity, cashflows, structural, and legal features.
Attestor Value
Attestor Value is a circa €8.5bn fund managed by Attestor Capital, a private investment firm that was founded in 2012 in London. The firm specialises in distressed debt and special situations investments, focusing on opportunities in the European market. The manager states that it has expertise in complex, illiquid investments, and an ability to create value through active management and operational improvements. According to the firm, its investment philosophy is centred around a disciplined, value-oriented approach. It works closely with management teams of its investee companies to seek to unlock value and generate returns, especially through balance sheet actions.
Performance
Five-year track record
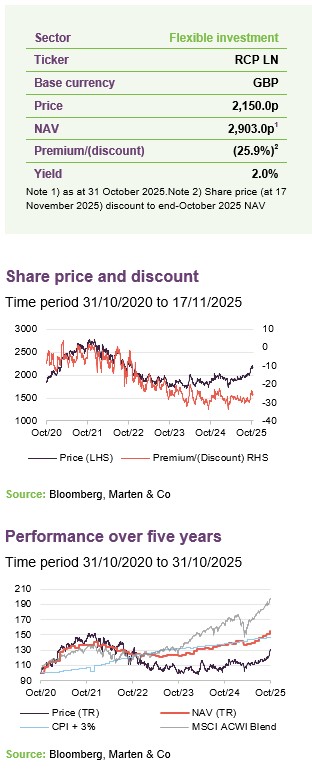
Figure 17 shows RIT’s NAV performance relative to its two relevant indices. It has outpaced CPI inflation +3% over the past five years – a period in which inflation increased after COVID and has remained above central banks’ 2% target – but has remained below that of the blended MSCI ACWI benchmark (which is 100% equities and has a significant weighting in US mega-cap tech stocks). Turmoil in the markets earlier this year appeared to coincide with an increase in RIT’s relative performance versus the blended MSCI ACWI benchmark, which may reflect the diversified multi-asset composition of RIT’s portfolio. The recent broadening of returns across asset classes suggests that RIT’s diversified portfolio could participate in rallies while potentially reducing volatility.
Figure 17: RIT versus benchmarks over five years ended 31 October 2025
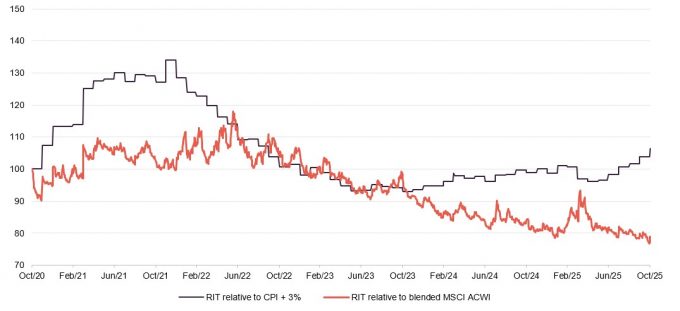
Source: Bloomberg, Marten & Co
Figure 18: Total return cumulative performance over various time periods to 31 October 2025
| 6 months (%) | 1 year (%) | 3 years (%) | 5 years (%) | |
|---|---|---|---|---|
| RIT Capital Partners share price | 16.3 | 19.5 | 3.3 | 29.3 |
| RIT Capital Partners NAV | 12.7 | 13.4 | 25.7 | 55.6 |
| CPI + 3% | 3.4 | 6.8 | 20.3 | 47.0 |
| Blended MSCI ACWI | 22.8 | 21.2 | 66.4 | 97.5 |
| Peer group1 median NAV | 7.0 | 10.1 | 20.1 | 40.9 |
RIT’s NAV returns have outpaced inflation over five years and have exceeded its peer group average NAV return over all time periods, as illustrated in Figure 18 (more detail on the peer group follows). RIT’s performance should be considered in the context of its core aim, which is to target long-term capital growth, through the cycles, with a degree of downside protection.
Peer group
Up-to-date information on RIT and its peer group is available on the QuotedData website
RIT is a constituent of the AIC’s Flexible Investment sector. These funds have investment objectives and/or policies that allow them to invest in a range of different asset types. The sector includes a variety of funds with different performance objectives, and therefore the full AIC sector may not provide a direct comparison for RIT, so a number of companies have been excluded.
RIT is the largest trust within the selected peer group, as shown in Figure 19, with assets exceeding its next-largest peer by more than £1bn. RIT’s dividend yield is towards the lower end among its peers, and its share price appears to be among the least volatile in the group. Its discount is at the wider end of funds in this peer group.
RIT has an ongoing charges figure in the top quarter of its peers, even though complexity of its investment process may contribute to a higher cost, given the increased resources needed in its execution.
Figure 19: RIT peer group comparison at 17 November 2025
| Market cap (£m) | Discount (%) | Dividend yield (%) | Ongoing charge (%) | 1-year standard deviation of share price | |
|---|---|---|---|---|---|
| RIT Capital Partners | 3,003 | (25.9) | 2.0 | 0.76 | 9.5 |
| Aberdeen Diversified | 83 | (29.4) | 12.4 | 2.36 | 15.6 |
| Caledonia | 1,994 | (33.5) | 1.9 | 0.87 | 14.1 |
| Capital Gearing | 800 | (2.0) | 2.1 | 0.56 | 2.8 |
| CT Managed Portfolio Growth | 94 | (2.7) | 0.0 | 2.02 | 10.5 |
| CT Managed Portfolio Income | 64 | (2.9) | 6.4 | 2.17 | 11.5 |
| Global Opportunities | 96 | (17.8) | 3.0 | 0.68 | 11.0 |
| Majedie | 130 | (18.9) | 3.4 | 1.40 | 23.8 |
| MIGO Opportunities | 68 | (2.9) | 0.9 | 1.70 | 11.6 |
| Personal Assets | 1,681 | 0.5 | 1.0 | 0.67 | 4.2 |
| Ruffer | 875 | (3.0) | 2.1 | 1.07 | 5.0 |
| Median | 130 | (3.0) | 2.1 | 1.07 | 11.0 |
| RIT rank | 1/11 | 9/11 | 7/11 | 4/11 | 4/11 |
RIT has a long-term track record that appears to be among the strongest compared to these peers, which may be due to the trust’s flexibility to invest across a range of asset classes and RIT’s network of connections within the private equity and debt markets. RIT’s performance ranks in the top quarter in all time periods up to five years.
Figure 20: Cumulative NAV total return performance over periods ending 31 October 2025
| 6 months (%) | 1 year (%) | 3 years (%) | 5 years (%) | |
|---|---|---|---|---|
| RIT Capital Partners | 12.7 | 13.4 | 25.7 | 55.6 |
| Aberdeen Diversified | (8.9) | (8.4) | (7.7) | 0.0 |
| Caledonia | 7.0 | 6.6 | 18.4 | 80.6 |
| Capital Gearing | 5.1 | 6.5 | 11.1 | 24.7 |
| CT Managed Portfolio Growth | 19.2 | 16.6 | 32.1 | 30.8 |
| CT Managed Portfolio Income | 15.8 | 16.1 | 25.8 | 40.9 |
| Global Opportunities | 6.9 | 12.3 | 18.7 | 60.0 |
| Majedie | 16.5 | 10.1 | 48.1 | 54.0 |
| MIGO Opportunities | 16.3 | 10.6 | 23.4 | 57.1 |
| Personal Assets | 5.6 | 9.8 | 20.1 | 31.4 |
| Ruffer | 6.1 | 8.3 | 6.0 | 35.0 |
| Median | 7.0 | 10.1 | 20.1 | 40.9 |
| RIT rank | 5/11 | 3/11 | 4/11 | 4/11 |
Premium/(discount)
Figure 21: RIT’s premium/(discount) over the five years ending 31 October 2025
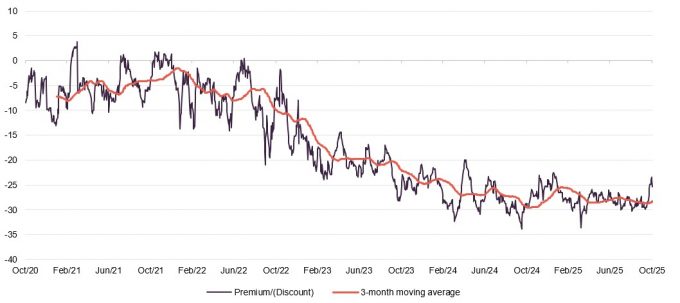
Source: Bloomberg, Marten & Co
Over the 12-month period ending 31 October 2025, RIT’s shares traded between a 33.7% and a 22.5% discount. Over this period, the average discount was 27.6%. On 17 November 2025, the discount (to the end-October NAV) was 25.9% – just below the 12-month average.
RIT’s buyback programme, which commenced in early 2023, has seen it repurchase just over £300m of shares (as of the end of October).
Fund profile
More info at the trust’s website www.ritcap.com
RIT aims to deliver long-term capital growth, while managing risk. It invests without the constraints of a formal benchmark, and aims to deliver increases in capital value in excess of relevant indices over time.
In practice, RIT aims to participate in up markets and seeks to provide some protection in down markets. Over time, this approach may allow it to compound its asset value ahead of index benchmarks through market cycles.
The board establishes and oversees risk tolerances for the manager to work within. RIT does not seek to be an absolute return fund and does not perform like one.
There are periods – such as 2022 – where the asset value falls. Over the medium term, the trust’s performance appears to compare favourably to some of the top-performing absolute return funds in the market.
The manager
RIT is a self-managed UK-domiciled investment trust. It evolved from the Rothschild Investment Trust, which was originally associated with the family bank, NM Rothschild & Sons. Lord Rothschild was appointed chairman of the Rothschild Investment Trust in 1971. The trust took on its current listed form as RIT Capital Partners Plc in August 1988.
J. Rothschild Capital Management (JRCM), a wholly-owned subsidiary of RIT, acts as RIT’s manager. According to the manager, its global network provides access to deal flow across asset classes and geographies, tracing its origins to the Rothschild family. At June 2025, JRCM employed 52 people, comprising a mix of investment professionals and support staff.
Widely diversified, hard to replicate portfolio
RIT invests in a diversified, international portfolio across a range of asset classes, both quoted and unquoted. Its closed-end structure enables investment in less-liquid assets such as unquoted companies, and allows for a longer-term investment approach that is less influenced by sentiment swings and short-term trends associated with listed equity markets and analysts. Unquoted (private) investments also provide RIT with access to a broader range of opportunities.
Tapping into outside expertise…
Part of the portfolio is allocated to external managers in order to provide access to external talent. Many of these managers may not be accessible to retail investors, and some are closed to new investment by all types of investors.
…helped by an extensive network of connections
The Rothschild name may provide access to certain opportunities, and RIT appears able to invest in areas that may not be accessible to others, due to the network of connections established by the family and the management team over the years. This network is also described as a source of intellectual capital and co-investment opportunities.
RIT’s investment approach includes risk management as a core component. JRCM measures both quantitative and qualitative aspects of risk, and reports these to the board. The company seeks to hedge factor exposures, macroeconomic risk, and manage currency positions.
RIT measures its investment performance against an absolute comparator (inflation, as measured by UK CPI, plus three percentage points per annum) and an equity comparator calculated as 50% of the MSCI ACWI return in local currencies translated back into sterling and 50% of the sterling-hedged MSCI ACWI.
Previous publications
QuotedData has published three previous notes on RIT. You can read the notes by clicking on the links below or by visiting our website.
Figure 24: QuotedData’s previously published notes on RIT
| Title | Note type | Publication date |
|---|---|---|
| A rare opportunity to buy a unique trust? | Initiation | 6 April 2023 |
| Change in fortunes on the horizon | Update | 19 June 2024 |
| Riding out the tariff storm | Annual overview | 14 May 2025 |
IMPORTANT INFORMATION
Marten & Co (which is authorised and regulated by the Financial Conduct Authority) was paid to produce this note on RIT Capital Partners Plc.
This note is for information purposes only and is not intended to encourage the reader to deal in the security or securities mentioned within it. Marten & Co is not authorised to give advice to retail clients. The research does not have regard to the specific investment objectives financial situation and needs of any specific person who may receive it.
The analysts who prepared this note are not constrained from dealing ahead of it but, in practice, and in accordance with our internal code of good conduct, will refrain from doing so for the period from which they first obtained the information necessary to prepare the note until one month after the note’s publication. Nevertheless, they may have an interest in any of the securities mentioned within this note.
This note has been compiled from publicly available information. This note is not directed at any person in any jurisdiction where (by reason of that person’s nationality, residence or otherwise) the publication or availability of this note is prohibited.
Accuracy of Content: Whilst Marten & Co uses reasonable efforts to obtain information from sources which we believe to be reliable and to ensure that the information in this note is up to date and accurate, we make no representation or warranty that the information contained in this note is accurate, reliable or complete. The information contained in this note is provided by Marten & Co for personal use and information purposes generally. You are solely liable for any use you may make of this information. The information is inherently subject to change without notice and may become outdated. You, therefore, should verify any information obtained from this note before you use it.
No Advice: Nothing contained in this note constitutes or should be construed to constitute investment, legal, tax or other advice.
No Representation or Warranty: No representation, warranty or guarantee of any kind, express or implied is given by Marten & Co in respect of any information contained on this note.
Exclusion of Liability: To the fullest extent allowed by law, Marten & Co shall not be liable for any direct or indirect losses, damages, costs or expenses incurred or suffered by you arising out or in connection with the access to, use of or reliance on any information contained on this note. In no circumstance shall Marten & Co and its employees have any liability for consequential or special damages.
Governing Law and Jurisdiction: These terms and conditions and all matters connected with them, are governed by the laws of England and Wales and shall be subject to the exclusive jurisdiction of the English courts. If you access this note from outside the UK, you are responsible for ensuring compliance with any local laws relating to access.
No information contained in this note shall form the basis of, or be relied upon in connection with, any offer or commitment whatsoever in any jurisdiction.
Investment Performance Information: Please remember that past performance is not necessarily a guide to the future and that the value of shares and the income from them can go down as well as up. Exchange rates may also cause the value of underlying overseas investments to go down as well as up. Marten & Co may write on companies that use gearing in a number of forms that can increase volatility and, in some cases, to a complete loss of an investment.