
Henderson Opportunities Trust (HOT) has published its annual results for the year ended 31 October 2022, which its chairman, Wendy Colquhoun, describes as a very difficult year for absolute and relative performance for HOT’s portfolio. She comments that, during periods of growing investor caution, it is often smaller companies that fall quickest and most steeply and this year was no exception. During the year, HOT provided NAV and share price total returns of -26.4% and -24.7% respectively. In comparison, it says that its All-Share benchmark lost 2.8% in total return and so HOT has drastically underperformed its benchmark although HOT also says that its peer group lost an average of 24.6% in NAV total return terms, which is much more comparable to HOT’s own performance.
Difficult year for a multi-cap strategy
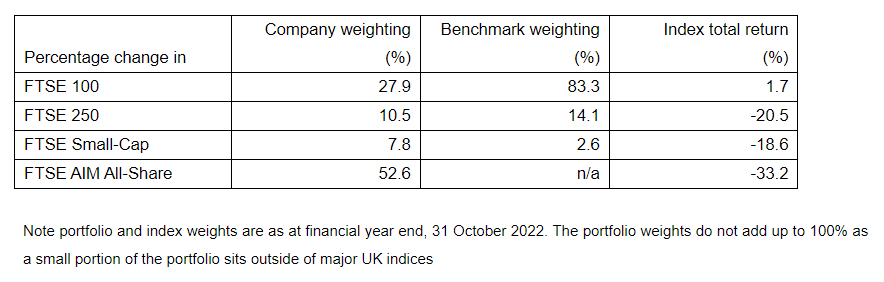
HOT has always looked across the whole of the UK market for the best return opportunities. However, its managers (James Henderson and Laura Foll) comment that the year under review was a very difficult one for managing a multi-cap fund relative to a concentrated index made up of predominantly large companies. As is illustrated in the table below (reproduced from HOT’s announcement), larger companies significantly outperformed smaller companies, with a difference in relative returns of more than 20% between those in the top 100 and small/ medium sized companies (and more than 30% underperformance in the case of AIM stocks).
The managers say that the key reason for the size differential in performance was the make-up of the top 100 stocks, with its significant weighting in natural resources stocks that benefited from rising commodity prices, as well as more defensive sectors such as consumer staples, utilities and pharmaceuticals (where there are significant economies of scale therefore these types of defensive companies tend mostly to exist as very large companies). In contrast, HOT’s portfolio, with its significant weighting in smaller companies and particularly those on AIM, the size distribution of the portfolio was a significant headwind to performance. On the managers’ estimates, the size of the companies held within the portfolio drove the majority of HOT’s underperformance relative to its benchmark (the All-Share) this year.
Gearing was also a detractor
On the managers’ estimates, gearing detracted 3.0% from HOT’s NAV total return during the period and therefore drove a notable, though minority, portion of the underperformance. However, from a longer-term perspective, gearing has been a positive contributor to returns and the managers say that they continue to see its use as one of the key advantages of the investment trust structure.
Strong recovery in income
While it was a challenging year in capital terms, HOT has continued to benefit from a strong recovery in investment income. Revenue return per share rose 64% to 40.6p, which compares to 24.7p from the prior year. It is also above the 29.9p achieved in 2019 pre the pandemic. The 40.6p revenue return per share comfortably covers HOT’s full year dividend of 34.0p, allowing the trust to add £523,000 to its revenue reserves.
The managers say that the rise in investment income was helped by material special dividends received during the year, the largest of which was NatWest as it chose to distribute a portion of its excess capital. Excluding special dividends, the earnings per share figure was 37.1p. Stock lending also continued to be a good contributor to income, providing £197,000 income (net of fees) during the year (which compares to £267,000 last year).
Lack of performance fee brings HOT’s ongoing charges down
The ongoing charge for the year was 0.90%, which is markedly lower than the 1.85% of the prior year. The fall in HOT’s ongoing charges is due to no performance fee being paid for the year. HOT’s investment management agreement has a clause that says that no performance fee will be paid if either the share price or net asset value is lower than their value at the preceding financial year end.
Discount to NAV and share buybacks
HOT traded at a discount to net asset value throughout the year, with the discount ranging from 8.6% to 20.5% and finishing the year at 13.3%. This reflects the broader experience of HOT’s peer group – the AIC UK All Companies sector finished the year at an average discount of 10.0%, and the AIC UK Smaller Companies sector finished at an average discount of 14.5%. HOT’s managers comment that it is frustrating for the shares to be trading at a persistent (albeit fluctuating) discount, but this reflects weak sentiment towards UK equities (and in particular smaller companies).
Continuation vote at next AGM
Following its three-yearly cycle, shareholders will be offered a continuation vote at this year’s Annual General Meeting. While HOT’s performance over the last 12 months has been disappointing, its NAV total return over the last three years has been 8.0%. This is ahead of both its All-Share benchmark, which provided a total return of 7.1%, and its peer group, the AIC’s UK All Companies sector, which returned -2.2%. The dividend per share over the last three years has grown 30.8%, equivalent to compound annual growth of 9.3%. In support of continuation, the managers’ view, which is shared by the Board, is that the valuations of the stocks held within the portfolio are low, and that there is an attractive return opportunity particularly within UK smaller companies. The board is recommending that shareholders vote in favour of continuation and the Directors and Fund Managers will be voting their shares accordingly. If shareholders vote in favour, the next continuation vote will be in Spring 2026.
Key contributors to performance
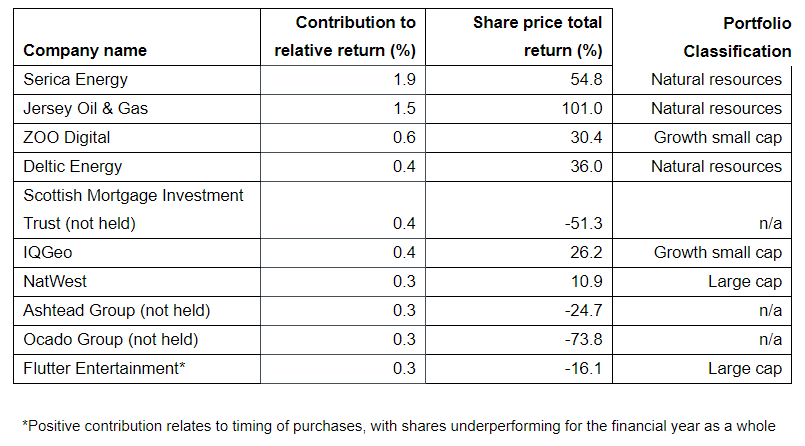
It is perhaps not surprising that three of the top five performers came from the natural resources sector as energy prices (and particularly natural gas) prices rose. The managers say that, outside of this, the best performers were companies with stock-specific drivers of earnings growth. For example, ZOO Digital, which provides subtitling and dubbing services to content producers such as Disney, grew sales and earnings materially as the market for global content continues to grow. IQGeo also grew sales substantially (both organically and via acquisitions) and this allowed it to become EBITDA (earnings before interest, taxes, depreciation, and amortisation) positive in the first half of this year.
The top 10 contributors to relative return during the financial year were:
The top 10 detractors from relative return during the financial year were:
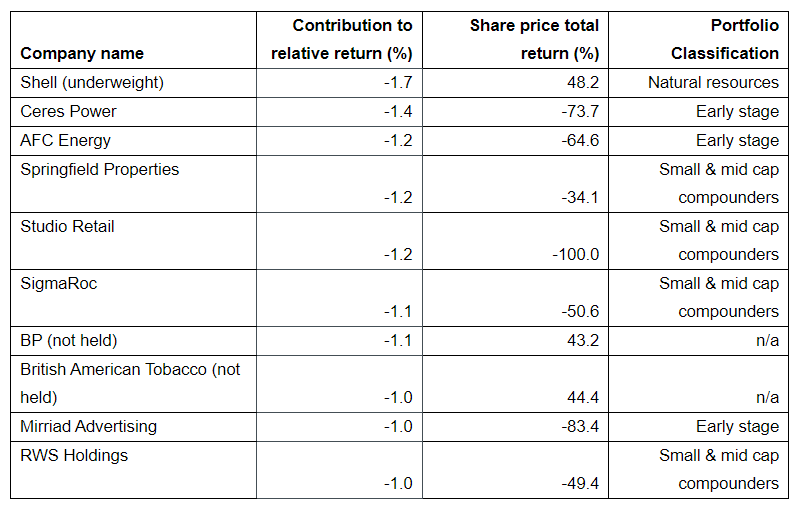
In contrast to the strong performance of companies in the natural resources sector and specifically traditional thermal energy, a number of the largest underperformers were in the alternative energy area such as fuel cell companies Ceres Power and AFC Energy. The managers comments that neither company has had material operational disappointments (Ceres has had some licence fee revenue from a joint venture deferred to early 2023 rather than late 2022, but this is a timing issue rather than a permanent loss of sales). The reason for the share price falls this year has been related to a broader reduction in risk appetite in the market at the same time as a rise in interest rates, which is shifting investor focus towards companies producing cash today rather than those potentially capable of producing sizeable amounts of cash in the future. The alternative energy sector (which sits within the Company’s ‘early stage’ allocation) is now a less than 2% aggregate weight in the portfolio. The managers believe that there will, for example, be a role for hydrogen to play in the energy transition in ‘hard to electrify’ areas such as heavy transportation and continue to think it is right to have a foothold in the area with companies that have the potential to become market leaders across different sectors (for example AFC Energy could become one of the market leaders in a fuel cell replacement for diesel generators).
The managers say that, outside of alternative energy, the underperformers during the year tended to be cyclically exposed companies such as Scottish housebuilder Springfield Properties and European building materials company SigmaRoc. In both cases they think the businesses have good scope to grow sales and earnings over the medium term driven by, in Springfield’s case, a sizeable landbank to work through and in SigmaRoc’s case rising infrastructure spend (as well as the potential for further acquisitions). In the short term, however, the share prices of both have fallen materially on concerns of an economic slowdown impacting demand for their products.
Portfolio review
HOT’s managers have, for a number of years, divided its portfolio into the classifications in the table below. However, at the beginning of this financial year, they decided to split the portfolio into two broader classifications of ‘tomorrow’s leaders’ and ‘stabilisers’. Tomorrow’s leaders are companies which, in their view, have the capacity to grow sales and earnings materially over the long term. These companies exist across all stages of the company lifecycle, spanning from early-stage businesses operating in nascent but structurally growing end markets to companies which have existed for a long time but which the managers think have the potential to recover (whether through their own ‘self-help’ or an end market recovery). Stabilisers, on the other hand, span large companies and natural resource businesses. These are held with the aim of smoothing volatility in the overall portfolio (as well as generating an attractive total return), as the managers recognise that smaller companies, while on average good performers over the long term, go through periods of large drawdowns. The stabilisers should therefore provide exposure to different end markets, whether it is more defensive exposure as is often the case with larger companies or commodity-price exposure with the natural resource companies. The current split of the portfolio across classifications is shown below:
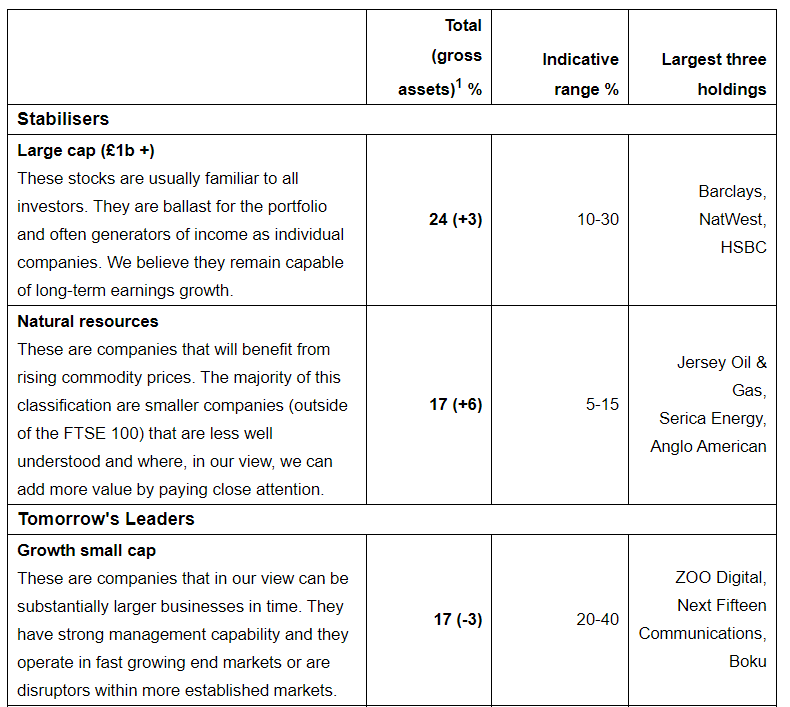
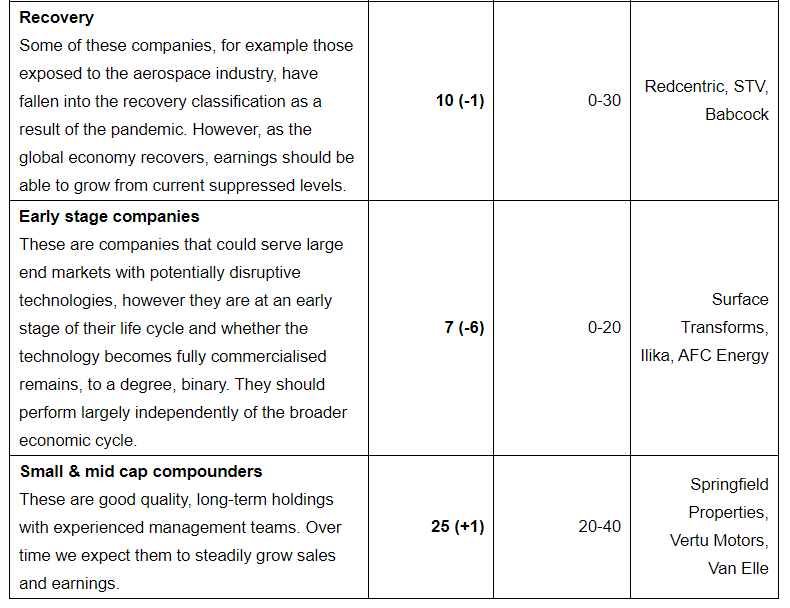
Note: 1 The number in brackets is the change in percentage compared to the previous financial year end
During the year under review, the stabilisers substantially outperformed tomorrow’s leaders. While the position in stabilisers provided some cushion to the Company’s performance relative to, for example, the AIM All-Share Index, the managers say that the exposure was not enough to offset HOT’s significantly larger than benchmark holding in smaller companies (which tend to fall within tomorrow’s leaders from the Company’s portfolio perspective).
During the previous financial year, the managers added to the holdings in stabilisers, which consisted largely of adding to holdings in large banks such as Barclays as well as a number of natural resource companies such as Jersey Oil & Gas. While these additions were helpful for relative performance in the year under review, with the benefit of hindsight the managers say that they should have gone further in this portfolio rotation. In the year under review, the managers have, given the scale of performance difference between the two broader classifications, made additions largely focused in the opposite direction (in other words adding to tomorrow’s leaders) given the scale of de-rating we have seen in this area.
Managers’ comments on portfolio activity
“During the year we were modest net sellers, purchasing £15.8m in aggregate and selling £20.6m. As a result of the fall in the Company’s net asset value, this kept gearing approximately flat during the year, ending at 13.9% net assets relative to 13.2% at the previous year end. Purchasing activity was modest relative to the previous year (when we purchased £35.5m). This was partly a result of very subdued IPO activity in the UK, with the Company participating in only one IPO during the year in domestic appliance retailer Marks Electrical.
“Unusually for this portfolio, which has a low average turnover, the largest new purchase for the year was also among the largest sales. Shell was purchased in December 2021 at approximately £17 per share and sold between March and September 2022 at between £19 and £22 per share. The purchase was driven by a combination of attractive cash generation and thinking the Shell integrated portfolio looked well placed during the period of energy transition. While both of these attributes still exist, the scale of the de-rating seen elsewhere in the UK equity market means that (in our view) there are better opportunities available. We also trimmed the natural resources exposure elsewhere, with Serica Energy being the largest individual sale during the year (despite this it remained a top five holding at the year end). As can be seen in the attribution tables set out earlier in this report, while Shell was a good performer in absolute terms for the portfolio, from a relative perspective it was the single largest detractor. This is because Shell forms such a significant weight in the FTSE All-Share Index, averaging 6.6% during the financial year and serves to highlight the challenge in managing a broad multi-cap fund relative to a concentrated benchmark.
“Outside of Shell and Marks Electrical, the other new positions established during the year were Finsbury Food, Flutter Entertainment, Haleon (which was inherited from the holding in GlaxoSmithKline), Halfords, i3 Energy, Reckitt Benckiser and Renold. There were also sizable additions to existing positions such as Morgan Advanced Materials and Springfield Properties. Of these, all but two of the active additions were outside of larger companies (the exceptions being Flutter Entertainment and Reckitt Benckiser), as we sought to take advantage of the sharp underperformance and subsequent de-rating in the smaller company area. While these additions have no common attributes in terms of their end markets (they span areas as broad as food production, housebuilding, retailing and industrial components), what they share is having a degree of ‘self help’ that can help to offset often challenging end markets and a path to becoming substantially larger businesses in time.
“Including Shell, six positions were sold in full during the year (the other five being Blue Prism, Franchise Brands, Sensyne Health, Lloyds Banking and Quixant). Of these the largest individual sale was Blue Prism which was sold following a bid approach from US peer SS&C. We also took profits in some long held smaller company positions such as transportation software provider Tracsis and utilities/telecommunications software provider IQGeo. In both cases we continue to see a visible pathway to future sales and earnings growth but they had performed strongly so were reduced for portfolio balance reasons.”
Dear quoteddata.com administrator, You always provide great resources and references.