October 2024
Monthly | Investment companies
Kindly sponsored by abrdn
Winners and losers in September 2024
The Dow Jones and S&P 500 hit record levels over September, whilst the price of gold reached its all time high, with a 28% increase since the start of the year. Against optimism from Jerome Powell on the state of the US economy, the Federal Reserve maintained its main interest rate of 4.75%, yet indicated that this could be lowered soon. A weaker dollar relative to the pound has impacted valuations of US investments – this shows up in the declines of sectors such as growth capital and financials as well as more directly-affected sectors.
In terms of the best performing sectors, Chinese equities were uplifted by interest rate cuts that saw government support for the banking and real estate sectors. This came at the end of the month, just a week before the country’s 75th anniversary of communist rule and was likely to be part of the government’s efforts to make sure that it fulfils target of 5% annual growth. Reflecting the Chinese market’s reaction, the CSI 300, the broad-based index of China’s largest companies, shot up 27% from its mid-September lows. This also helped drive improved returns in pan-Asian trusts.
The UK’s post-election stability has seen gradual improvement for equities and falling borrowing costs have also been helping. When coupled with heightened mergers and acquisitions activity, this drove prices higher in the real estate sectors too.
Best performing sectors in September 2024 by total price return
| Median share price total return (%) |
Median NAV total return (%) |
Median discount 30/09/24 (%) |
Median sector market cap 30/09/24 (£m) | Number of companies in the sector | |
|---|---|---|---|---|---|
| China/Greater China | 22.4 | 22.2 | (12.7) | 197.6 | 3 |
| Property – UK commercial | 6.5 | 0.0 | (16.7) | 220.4 | 11 |
| Property – Europe | 6.1 | 0.0 | (33.2) | 251.4 | 5 |
| Property – UK healthcare | 5.9 | 0.0 | (21.9) | 470.4 | 2 |
| Asia Pacific smaller companies | 4.1 | 5.9 | (15.5) | 359.7 | 3 |
Source: Morningstar, Marten & Co. Note: inclusive of sectors with at least two companies. Note: many alternative asset sector funds release NAV performance on a quarterly basis
On the downside, investors took profits from trusts and stocks in the biotechnology and healthcare sector – switching money into sectors perceived as less defensive. While advances in technology mean that the opportunity in the sector is as exciting as ever, companies both large and small have been cutting their budgets to protect themselves from a challenging macro environment.
UK small cap prices may be adjusting to fears of higher taxes in the upcoming budget, with the possibility of inheritance tax exemptions for AIM stocks being withdrawn a likely factor in price declines in this part of the market.
With the Japanese yen reaching its highest point against the dollar in over a year, Japanese stocks fell over September. The Bank of Japan decided to hold its interest rates in mid-September, possibly waiting until the Federal Reserve made a policy change. On 30 September, the Nikkei 225 fell by 4%, reacting to the somewhat surprise appointment of a new prime minister Shigeru Ishiba. With Ishiba in charge, the yen rose further as the new leader has previously expressed his favour for raising interest rates, which could affect the earnings of exporters.
Worst performing sectors in September 2024 by total price return
| Median share price total return (%) |
Median NAV total return (%) |
Median discount 30/09/24 (%) |
Median sector market cap 30/09/24 (£m) | Number of companies in the sector | |
|---|---|---|---|---|---|
| Biotechnology & healthcare | (4.6) | (3.2) | (9.1) | 520.5 | 6 |
| UK smaller companies | (2.7) | (2.5) | (11.6) | 108.2 | 24 |
| Growth capital | (2.5) | 0.0 | (38.2) | 127.4 | 7 |
| Japan | (2.3) | (1.7) | (12.3) | 292.8 | 5 |
| Financials & financial innovation | (2.1) | (0.9) | (22.4) | 354.1 | 2 |
Source: Morningstar, Marten & Co. Note: inclusive of sectors with at least two companies. Note: many alternative asset sector funds release NAV performance on a quarterly basis
Best performing
Chinese focused trusts such as JPMorgan China Growth & Income, Fidelity China Special and Baillie Gifford China Growth produced substantial rises by NAV, driven by the rally of Chinese stocks following government stimulus boosts. All three funds saw their share price surge by more than 22%, with all three holding Tencent and Alibaba, two technology stocks that have emerged as major benefactors of the Chinese rally. Both Baillie Gifford China Growth Trust and JPMorgan China Growth and Income have China Merchants Bank among their holdings, whose stock reached a year high, with JPMorgan China Growth adding to its original investment. With investments diversified across Asia but with considerable allocations towards China, several funds in the Asia Pacific sectors and the global emerging markets sector (such as Templeton Emerging Markets) had their share prices uplifted by the Chinese rally, particularly Invesco Asia, which allocates 25% of its investments to Chinese companies.
Best performing funds in total NAV (LHS) and share price (RHS) terms over September 2024
| Fund | Sector | (%) | Fund | Sector | (%) |
|---|---|---|---|---|---|
| JPMorgan China Growth & Income | China/Greater China | 24.5 | JPMorgan China Growth & Income | China/Greater China | 26.0 |
| Fidelity China Special | China/Greater China | 22.4 | Baillie Gifford China Growth | China/Greater China | 22.2 |
| Baillie Gifford China Growth | China/Greater China | 21.9 | Fidelity China Special | China/Greater China | 22.1 |
| Chrysalis Investments | Growth capital | 16.8 | Invesco Asia | Asia Pacific | 9.7 |
| Life Science REIT | Property – UK commercial | 14.7 | Geiger Counter | Commodities and natural resources | 9.3 |
| Menhaden Resource Efficiency | Environmental | 11.1 | BlackRock World Mining | Commodities and natural resources | 7.8 |
| EJF Investments | Debt – structured finance | 10.6 | Fidelity Asian Values | Asia Pacific | 6.7 |
| Golden Prospect Precious Metal | Commodities and natural resources | 10.4 | JPMorgan Asia Growth & Income | Asia Pacific | 6.1 |
| Balanced Commercial Property | Property – UK commercial | 10.2 | Scottish Oriental Smaller Cos | Asia Pacific smaller companies | 5.9 |
| Pantheon Infrastructure | Infrastructure | 9.9 | Templeton Emerging Markets | Global emerging markets | 5.6 |
Source: Morningstar, Marten & Co. Note: excludes trusts with market caps below £15m at 30/09/24
Second to the jumps in NAV from Chinese funds, was Chrysalis’ NAV increase of 16.8%, propelled by the sale of Featurespace to Visa. The fund expects that it will receive around £89m, which represents a 20% premium to Chrysalis’ carrying value of Featurespace of £74.2m as of 30th June 2024.
Life Science REIT’s chair said that it was willing to take any action necessary to address its steep discount to NAV. The launch of a strategic review by Menhaden Resource Efficiency, ahead of its continuation vote next year, caused the company’s NAV to rise by 11.1%. EJF’s interim results were well received by investors.
For commodities and natural resources funds, the all-time high price of gold on 26 September boosted the share price of BlackRock World Mining and the NAV of Golden Prospect Precious Metal. Drivers for this record were the escalating conflicts in the Middle East and concerns of a potential recession, as some investors sought to protect the value of their wealth. In the case of Geiger Counter, the arrival of Japanese prime minister Shigeru Ishiba has fostered hope for a Japanese nuclear revival, as Ishiba has voiced support for restoring the country’s reactors.
Balanced Commercial Property Trust is being taken over by Starwood.
A contributing factor to Pantheon Infrastructure’s increase in NAV was a series of share buybacks, totalling £2.75m. Within the same time frame, the trust raised its dividend target by 5%, with its first interim dividend to be paid in late October. The growth in NAV has been built on a NAV total return of 8.5% in the six months ended to 30th June 2024. Among its best-performing investments over September was Calpine, which has benefited from a favourable trading environment for energy companies.
Worst performing
In terms of the worst performing trusts, Phoenix Spree Deutschland reported a 7.1% fall in its net tangible assets. Although rate cuts by the European Central Bank should have helped ease the impact of lowered demand, heightened building costs have contributed to Europe’s largest economy’s property issues, which has also been affected by a lack of foreign investment. Sticking with investments on the continent, European Opportunities Trust’s disposal of certain securities has coincided with a substantial decrease in its revenue return per share.
As mentioned above, budget concerns may be weighing on UK small cap share prices.
Worst performing funds in total NAV (LHS) and share price (RHS) terms over September 2024
| Fund | Sector | (%) | Fund | Sector | (%) |
| Phoenix Spree Deutschland | Property – Europe | (8.0) | Ecofin US Renewables Infrastructure | Renewable energy infrastructure | (36.3) |
| River UK Micro Cap | UK smaller companies | (7.3) | Digital 9 Infrastructure | Infrastructure | (19.2) |
| NB Distressed Debt Inv Extended Life | Debt – loans & bonds | (6.7) | HydrogenOne Capital Growth | Renewable energy infrastructure | (16.5) |
| Worldwide Healthcare | Biotechnology & healthcare | (6.4) | Schiehallion Fund | Growth capital | (14.5) |
| European Opportunities | Europe | (6.2) | JPMorgan Emerg Eur, ME & Africa Sec | Global emerging markets | (12.0) |
| Strategic Equity Capital | UK smaller companies | (6.2) | Gresham House Energy Storage | Renewable energy infrastructure | (9.3) |
| Life Science REIT | Property – UK commercial | (5.6) | Ground Rents Income Fund | Property – UK residential | (9.1) |
| JPMorgan UK Small Cap Growth & Income | UK smaller companies | (5.1) | Riverstone Credit Opportunities Income | Debt – direct lending | (9.1) |
| Invesco Perpetual UK Smaller | UK smaller companies | (4.8) | Schroders Capital Global Innovation | Growth capital | (8.5) |
| Bellevue Healthcare | Biotechnology & healthcare | (4.5) | Ceiba Investments | Property – rest of World | (7.1) |
Source: Morningstar, Marten & Co. Note: excludes trusts with market caps below £15m at 30/09/24
Worldwide Healthcare’s NAV fell by 6.4%, partly caused by a hit to Novo Nordisk’s share price. Life Science REIT delivered less than impressive half year results, as investors continue to be wary of the office sector.
Following the conclusion of its strategic review, a buyer could not be identified for the assets of Ecofin US Renewables Infrastructure, with the news plummeting its share price by over 36%. The board has decided to wind up the trust. Also in the renewable energy infrastructure sector, Gresham House Energy Storage revealed in its half year results that its operational revenues fell by 12.8% year on year, reflecting the issues that the battery sector has had in benefitting from the capacity market.
Digital 9 continues to look for buyers for its assets. A reassessment of the impact of its inability to finance growth in its portfolio led to a significant drop in NAV. HydrogenOne’s discount widened for no good reason and it looks oversold.
Schiehallion Fund’s fall in share price may have been connected to the potential legal battle that ByteDance, the parent company of TikTok, may be facing amid calls for a ban of the popular social media app in the US. Carrying on from previous months, JPMorgan Emerging Europe, Middle East and Africa’s share price has continued to suffer from its legacy Russian holdings.
The value of Ground Rents Income Fund continued to fall, as a result of reforms within the leasehold sector, meanwhile Ceiba Investments’ share price has persisted to drop due to a combination of factors. There is a big section on Cuba in the latest economic and political roundup.
Moves in discounts and premiums
More expensive (LHS) and cheaper (RHS) relative to NAV over September 2024
| Fund | Sector | Disc/ Prem 31/08/24 (%) |
Disc/ Prem 30/09/24 (%) |
Fund | Sector | Disc/ Prem 31/08/24 (%) |
Disc/ Prem 30/09/24 (%) |
|---|---|---|---|---|---|---|---|
| Phoenix Spree Deutschland | Property – Europe | (46.1) | (35.5) | JPMorgan Emerg E, ME & Africa Sec Plc | Global emerging markets | 141.8 | 113.0 |
| Chrysalis Investments | Growth capital | (45.0) | (35.8) | Ecofin US Renewables Infrastructure | Renewable energy infrastructure | (22.6) | (48.8) |
| Life Science REIT | Property – UK commercial | (58.3) | (49.3) | Schiehallion Fund | Growth capital | (22.7) | (32.6) |
| Balanced Commercial Property | Property – UK commercial | (17.8) | (9.8) | Digital 9 Infrastructure | Infrastructure | (55.7) | (64.2) |
| Menhaden Resource Efficiency | Environmental | (40.7) | (33.6) | HydrogenOne Capital Growth | Renewable energy infrastructure | (57.1) | (64.2) |
Source: Morningstar, Marten & Co
As discussed, Phoenix Spree Deutschland’s discount has been affected by a difficult German property market, whilst Chrysalis’ sale of Featurespace gave its share price a boost. Life Science REIT’s comments on its discount have had some effect. While Balanced Commercial Property’s closure will have been prompted by the recommendation by the trust’s board to accept a cash offer from Starwood Capital for the company, and Menhaden’s strategic review has helped narrow that discount.
In terms of widening discounts, JPMorgan Emerging Europe, Middle East and Africa’s discount was further impacted by its Russian legacy holdings. Ecofin US Renewables Infrastructure’s share price falls discussed above led to a more than doubling of its discount and Digital 9 Infrastructure’s disappointing news further undermined confidence in the company.
Money raised and returned
Money raised (LHS) and returned (RHS) over September 2024 in £m
| Fund | Sector | £m raised | Fund | Sector | £m returned |
|---|---|---|---|---|---|
| TwentyFour Select Monthly Income | Debt – loans & bonds | 3.8 | Scottish Mortgage | Global | (134.4) |
| CQS New City High Yield | Debt – loans & bonds | 3.4 | JPMorgan European Discovery | European smaller companies | (99.4) |
| Castelnau Group | Flexible investment | 3.4 | F&C Investment | Global | (38.8) |
| Invesco Bond Income Plus | Debt – loans & bonds | 2.6 | Monks | Global | (38.8) |
| Ashoka India Equity Investment | India/Indian Subcontinent | 2.3 | Smithson Investment | Global smaller companies | (37.6) |
Source: Morningstar, Marten & Co. Note: excludes trusts with market caps below £15m at 30/09/24. Note: based on the approximate value of shares at 30/09/24
Higher returns, associated with prevailing higher interest rates, have been attracting investors to the debt – loans and bonds sector. Castelnau issued shares in connection with its purchase of an additional stake Cambium International – paying for this with shares rather than cash..
Scottish Mortgage topped the money returned table by some distance, adding to its buyback programme, now totalling over £1bn. More than £30m behind Scottish Mortgage but still £60m ahead of F&C Investment Trust, JPMorgan European Discovery made a tender offer for 15% of its shares, with cash being distributed to its shareholders during September.

Major news stories and QuotedData views over September 2024
Visit www.quoteddata.com for more on these and other stories plus in-depth analysis on some funds, the tools to compare similar funds and basic information, key documents and regulatory news announcements/ on every investment company quoted in London
Portfolio developments
- Downing Renewables & Infrastructure acquires three Swedish hydropower plants
- Grit Real Estate agrees further sales
- Oakley Capital sells Ocean Technologies Group
- Aquila European sells stake in Norwegian wind farm
- HydrogenOne Capital Growth continues to make progress
- Weak China and not enough TSMC hold back Pacific Horizon
- Defensive positioning stings Ruffer in 2024
- Solid year for Murray Income, although stock selection sees benchmark drag
- Dividend growth drives City of London Investment Trust to strong year
- Modest returns to start 2024, however portfolio progress continues for DORE
- European Opportunities hampered slightly by sentiment towards small and mid caps
- Pantheon Infrastructure passing up attractive opportunities for lack of capital
- Henderson High Income NAV beats benchmark in first half
Corporate news
- Artemis Alpha and Aurora to merge
- Shareholder revolt grows at PRS REIT
- Manchester and London announces new management fee structure
- SEGRO snaps up Tritax Eurobox
- JPMorgan European Discovery tender four times oversubscribed
- Much better year for abrdn UK Smaller Companies Growth
- JPMorgan Emerging EMEA Securities considering options for Russian depositary insolvency
- Gulf Investment Fund to liquidate as tender breaches minimum size condition
- Aquila European preps ground for managed wind-down
- Alliance Trust and Witan publish circulars for their merger
- Government announces changes to cost disclosure rules
- Chrysalis makes moves on debt facility to drive capital allocation policy
- Schroder Japan shareholders to get enhanced dividend
- Chrysalis sells Featurespace to Visa achieving 20% premium to valuation
- Gulf Investment Fund wind up now a certainty
Property News
- PRS REIT succumbs to shareholder pressure
- Target Healthcare REIT posts 11.8% return with care home sector dynamics positive
- Urban Logistics REIT refinances debt and buys four assets
- Supermarket Income REIT reports stabilisation of values
- abrdn Property Income wind-down complete with sale of whole portfolio
QuotedData views
Visit www.quoteddata.com for more on these and other stories plus in-depth analysis on some funds, the tools to compare similar funds and basic information, key documents and regulatory news announcements on every investment company quoted in London
Interviews
Have you been listening to our weekly news round-up shows? Every Friday at 11 am, we run through the more interesting bits of the week’s news, and we usually have a special guest or two answering questions about a particular investment company.
| Friday | The news show | Special Guest | Topic |
|---|---|---|---|
| Friday | The news show | Special Guest | Topic |
| 7 June | GRID, ORIT, SONG | Olivia MacDonald | Majedie Investments |
| 14 June | ANII, AEIT | Luciano Suana | Menhaden |
| 21 June | HOME, NESF | Nick Greenwood, Peter Hewitt, Ben Ritchie | Quarterly panel – big discounts |
| 28 June | ATST, WTAN, BNKR, JARA, HOME | Nick Train | Finsbury Growth & Income |
| 5 July | EBOX, CGL, RGL, UKW | James Baker | The Investment Company |
| 12 July | CHRY, SBO, GROW, EWI, OIT, SRE | Kenneth MacKenzie | Target Fund Managers |
| 19 July | IPU, GSF | Chris Clothier | Capital Gearing |
| 26 July | JGC, HMSO UTG | Henry Butt | AEW UK REIT |
| 2 August | PSH, JFJ/JSGI, CRS | Peter Hewitt | Global Managed Portfolio Trust |
| 9 August | FGT | Matt Cable | Rights and Issues |
| 16 August | JLEN, DORE | Ian Lance | Temple Bar Investment Trust |
| 23 August | DNA2, HEIT | Craig Baker | Alliance Trust |
| 30 August | ATS, ORIT, PRSR, INOV | James Harris | STS Global Income & Growth Trust |
| 6 September | PRSR, SEGRO/EBOX, BCPT, ATS/ARR, JARA, DGI9 | Randall Sandstorm | Sequoia Economic Infrastructure Income Fund |
| 13 September | AERI, GIF, KPC, JEMA | Jon Forster | Impax Environmental Markets |
| 20 September | NRR/CAL, cost disclosures | David Bird, Neil Hermon, Georgina Brittain, Duncan Ball | Quarterly panel – new government, new opportunities |
| 27 September | CHRY, DORE, API | Paul Niven | F&C Investment Trust |
| 4 October | ROOF, KPC, RESI, TENT | Richard Brown | Castelnau Group |
| 11 October | James Armstrong | Bluefield Solar Income | |
| Coming up | |||
| 18 October | Katie Potts | Herald Investment Trust | |
| 25 October | Helen Steers | Pantheon International | |
| 1 November | Job Curtis | City of London |
Research
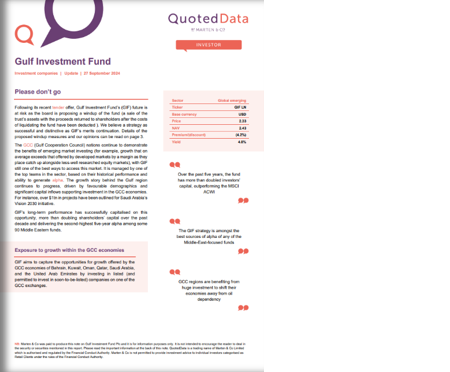
Following its recent tender offer, Gulf Investment Fund’s (GIF) future is at risk as the board is proposing a windup of the fund (a sale of the trust’s assets with the proceeds returned to shareholders after the costs of liquidating the fund have been deducted). We believe a strategy as successful and distinctive as GIF’s merits continuation. Details of the proposed windup measures and our opinions can be read on page 3.
The GCC (Gulf Cooperation Council) nations continue to demonstrate the benefits of emerging market investing (for example, growth that on average exceeds that offered by developed markets by a margin as they place catch up alongside less-well researched equity markets), with GIF still one of the best ways to access this market. It is managed by one of the top teams in the sector, based on their historical performance and ability to generate alpha.
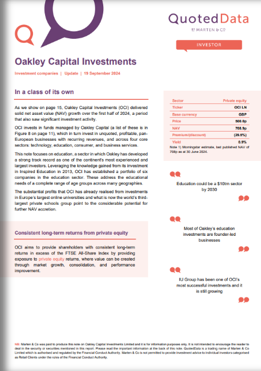
As we show on page 15, Oakley Capital Investments (OCI) delivered solid net asset value (NAV) growth over the first half of 2024, a period that also saw significant investment activity.
OCI invests in funds managed by Oakley Capital (a list of these is in Figure 8 on page 11), which in turn invest in unquoted, profitable, pan-European businesses with recurring revenues, and across four core sectors: technology, education, consumer, and business services.
This note focuses on education, a sector in which Oakley has developed a strong track record as one of the continent’s most experienced and largest investors. Leveraging the knowledge gained from its investment in Inspired Education in 2013, OCI has established a portfolio of six companies in the education sector. These address the educational needs of a complete range of age groups across many geographies.
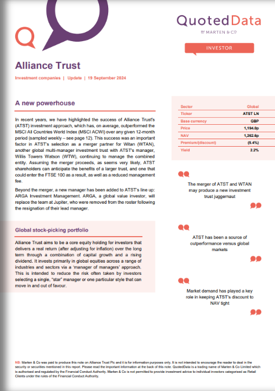
In recent years, we have highlighted the success of Alliance Trust’s (ATST) investment approach, which has, on average, outperformed the MSCI All Countries World Index (MSCI ACWI) over any given 12-month period (sampled weekly – see page 12). This success was an important factor in ATST’s selection as a merger partner for Witan (WTAN), another global multi-manager investment trust with ATST’s manager, Willis Towers Watson (WTW), continuing to manage the combined entity. Assuming the merger proceeds, as seems very likely, ATST shareholders can anticipate the benefits of a larger trust, and one that could enter the FTSE 100 as a result, as well as a reduced management fee.
Beyond the merger, a new manager has been added to ATST’s line up: ARGA Investment Management. ARGA, a global value investor, will replace the team at Jupiter, who were removed from the roster following the resignation of their lead manager.
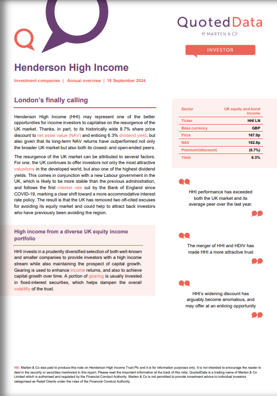
Henderson High Income (HHI) may represent one of the better opportunities for income investors to capitalise on the resurgence of the UK market. Thanks, in part, to its historically wide 8.7% share price discount to net asset value (NAV) and enticing 6.3% dividend yield, but also given that its long-term NAV returns have outperformed not only the broader UK market but also both its closed- and open-ended peers.
With this dramatically expanding access to space and the growing requirements and use cases for space technologies in virtually every industry on our planet, the space sector is projected to grow into a trillion-dollar market opportunity.There are many companies with rapidly expanding revenues and profits derived from this sector, however most of these are currently unlisted. SSIT provides a unique way for ordinary investors to access these potential world changing opportunities.
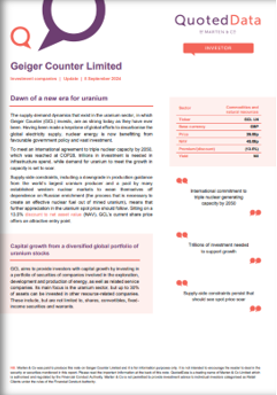
The supply-demand dynamics that exist in the uranium sector, in which Geiger Counter (GCL) invests, are as strong today as they have ever been. Having been made a keystone of global efforts to decarbonise the global electricity supply, nuclear energy is now benefitting from favourable government policy and vast investment. To meet an international agreement to triple nuclear capacity by 2050, which was reached at COP28, trillions in investment is needed in infrastructure spend, while demand for uranium to meet the growth in capacity is set to soar. Supply-side constraints, including a downgrade in production guidance from the world’s largest uranium producer and a pact by many established western nuclear markets to wean themselves off dependence on Russian enrichment, means that further appreciation in the uranium spot price should follow. Sitting on a 13.5% discount makes GCL’s share price an attractive entry point.
Upcoming events
Here is a selection of what is coming up. Please refer to the Events section of our website for updates between now and when they are scheduled:
Appendix 1 – median performance by sector, ranked by 2024 year to date price total return
| YTD Rank |
Sector | Share price total return YTD (%) | NAV total return YTD (%) |
Discount 31/08/24 (%) |
Discount 30/09/24 (%) |
Change in discount (%) |
Median mkt cap 30/09/24 (£m) |
|---|---|---|---|---|---|---|---|
| 1 | Leasing | 26.3 | 6.2 | (31.5) | (34.2) | (2.8) | 157,115,970 |
| 2 | Debt – structured finance | 17.4 | 5.1 | (19.3) | (19.2) | 0.1 | 162,856,767 |
| 3 | Technology & technology innovation | 15.8 | 18.2 | (12.4) | (11.4) | 0.9 | 2,461,854,220 |
| 4 | India/Indian Subcontinent | 13.9 | 16.5 | (13.3) | (13.6) | (0.3) | 434,076,031 |
| 5 | Asia Pacific equity income | 12.8 | 12.7 | (9.5) | (11.0) | (1.6) | 336,150,406 |
| 6 | UK all companies | 12.3 | 12.5 | (11.8) | (10.8) | 1.0 | 213,020,130 |
| 7 | UK equity & bond income | 11.7 | 11.3 | (9.2) | (8.0) | 1.2 | 286,615,931 |
| 8 | UK equity income | 11.6 | 10.5 | (8.7) | (6.9) | 1.7 | 401,005,670 |
| 9 | China / Greater China | 11.3 | 15.7 | (12.4) | (12.7) | (0.3) | 197,605,854 |
| 10 | Debt – direct lending | 11.0 | 2.8 | (17.4) | (17.2) | 0.2 | 110,754,004 |
| 11 | Japanese smaller companies | 10.1 | 8.7 | (9.3) | (8.6) | 0.7 | 269,903,480 |
| 12 | UK smaller companies | 10.1 | 10.2 | (10.4) | (11.6) | (1.2) | 108,237,914 |
| 13 | Asia Pacific | 9.8 | 12.6 | (10.9) | (12.0) | (1.1) | 539,057,808 |
| 14 | North America | 9.8 | 9.3 | (12.4) | (11.8) | 0.7 | 490,759,861 |
| 15 | Property – UK healthcare | 9.4 | 7.7 | (25.8) | (21.9) | 4.0 | 470,337,716 |
| 16 | European smaller companies | 9.3 | 4.9 | (12.6) | (10.7) | 1.8 | 435,578,539 |
| 17 | Asia Pacific smaller companies | 9.1 | 10.8 | (14.1) | (15.5) | (1.4) | 359,707,070 |
| 18 | Debt – loans & bonds | 8.9 | 7.0 | (1.6) | (1.4) | 0.1 | 137,890,935 |
| 19 | Global | 8.3 | 9.0 | (8.8) | (9.4) | (0.7) | 1,021,162,460 |
| 20 | Environmental | 7.5 | 4.8 | (18.2) | (20.0) | (1.7) | 86,707,501 |
| 21 | Global equity income | 7.4 | 7.0 | (8.8) | (8.9) | (0.1) | 331,204,030 |
| 22 | Financials & financial innovation | 6.6 | 11.0 | (21.9) | (22.4) | (0.6) | 354,136,516 |
| 23 | Japan | 6.4 | 9.1 | (11.5) | (12.3) | (0.7) | 292,812,657 |
| 24 | Infrastructure securities | 6.2 | 4.6 | (12.3) | (13.8) | (1.5) | 116,781,741 |
| 25 | Global emerging markets | 6.1 | 9.7 | (12.1) | (11.9) | 0.2 | 217,045,475 |
| 26 | Country specialist | 6.0 | 10.6 | (13.9) | (13.1) | 0.8 | 406,538,809 |
| 27 | Europe | 5.8 | 6.0 | (11.6) | (9.1) | 2.5 | 570,451,530 |
| 28 | Commodities & natural resources | 5.8 | 1.9 | (14.8) | (17.2) | (2.4) | 62,480,913 |
| 29 | Global smaller companies | 5.3 | 6.4 | (11.6) | (11.6) | 0.1 | 790,142,971 |
| 30 | Flexible investment | 5.3 | 3.6 | (19.0) | (17.1) | 1.8 | 90,800,000 |
| 31 | Biotechnology & healthcare | 5.2 | 5.1 | (10.9) | (9.1) | 1.8 | 520,468,327 |
| 32 | Hedge funds | 4.7 | 2.0 | (9.6) | (10.9) | (1.3) | 80,493,003 |
| 33 | Insurance & reinsurance strategies | 4.4 | 19.4 | (20.4) | (19.6) | 0.8 | 32,926,63 4 |
| YTD Rank |
Sector | Share price total return YTD (%) | NAV total return YTD (%) |
Discount 31/08/2024 (%) |
Discount 30/09/24 (%) |
Change in discount (%) |
Median mkt cap 30/09/24 (£m) |
|---|---|---|---|---|---|---|---|
| 34 | Property – UK commercial | 3.4 | 0.0 | (17.8) | (16.7) | 1.1 | 220,440,337 |
| 35 | Growth capital | 3.3 | 0.0 | (43.4) | (38.2) | 5.1 | 127,375,640 |
| 36 | Property – Europe | 3.2 | (8.7) | (36.8) | (33.2) | 3.6 | 251,426,357 |
| 37 | North American smaller companies | 2.1 | 3.2 | (10.2) | (10.5) | (0.3) | 205,021,277 |
| 38 | Private equity | 1.7 | 0.7 | (33.6) | (34.4) | (0.8) | 469,049,406 |
| 39 | Property – UK logistics | 1.3 | 3.5 | (24.7) | (21.3) | 3.4 | 595,632,969 |
| 40 | Property – debt | 1.0 | 2.1 | (26.4) | (27.8) | (1.4) | 46,453,368 |
| 41 | Infrastructure | 0.1 | 5.3 | (19.9) | (16.6) | 3.3 | 936,298,341 |
| 42 | Property – UK residential | (0.7) | (0.7) | (55.5) | (57.1) | (1.6) | 178,217,882 |
| 43 | Renewable energy infrastructure | (5.0) | 0.0 | (24.3) | (27.2) | (2.9) | 299,679,880 |
| 44 | Property – rest of World | (16.1) | (18.3) | (69.6) | (66.4) | 3.3 | 20,714,971 |
| 45 | Latin America | (23.9) | (23.4) | (11.2) | (12.8) | (1.6) | 96,002,570 |
| MEDIAN | 6.4 | 6.2 | (12.6) | (13.1) | 0.1 | 269,903,480 |
Guide

Our independent guide to quoted investment companies is an invaluable tool for anyone who wants to brush up on their knowledge of the investment companies’ sector. Please register on www.quoteddata.com if you would like it emailed to you directly.
IMPORTANT INFORMATION
This note was prepared by Marten & Co (which is authorised and regulated by the Financial Conduct Authority).
This note is for information purposes only and is not intended to encourage the reader to deal in the security or securities mentioned within it. Marten & Co is not authorised to give advice to retail clients. The note does not have regard to the specific investment objectives, financial situation and needs of any specific person who may receive it.
Marten & Co may have or may be seeking a contractual relationship with any of the securities mentioned within the note for activities including the provision of sponsored research, investor access or fundraising services.
This note has been compiled from publicly available information. This note is not directed at any person in any jurisdiction where (by reason of that person’s nationality, residence or otherwise) the publication or availability of this note is prohibited.
Accuracy of Content: Whilst Marten & Co uses reasonable efforts to obtain information from sources which we believe to be reliable and to ensure that the information in this note is up to date and accurate, we make no representation or warranty that the information contained in this note is accurate, reliable or complete. The information contained in this note is provided by Marten & Co for personal use and information purposes generally. You are solely liable for any use you may make of this information. The information is inherently subject to change without notice and may become outdated. You, therefore, should verify any information obtained from this note before you use it.
No Advice: Nothing contained in this note constitutes or should be construed to constitute investment, legal, tax or other advice.
No Representation or Warranty: No representation, warranty or guarantee of any kind, express or implied is given by Marten & Co in respect of any information contained in this note.
Exclusion of Liability: To the fullest extent allowed by law, Marten & Co shall not be liable for any direct or indirect losses, damages, costs or expenses incurred or suffered by you arising out or in connection with the access to, use of or reliance on any information contained in this note. In no circumstance shall Marten & Co and its employees have any liability for consequential or special damages.
Governing Law and Jurisdiction: These terms and conditions and all matters connected with them, are governed by the laws of England and Wales and shall be subject to the exclusive jurisdiction of the English courts. If you access this note from outside the UK, you are responsible for ensuring compliance with any local laws relating to access.
No information contained in this note shall form the basis of, or be relied upon in connection with, any offer or commitment whatsoever in any jurisdiction.
Investment Performance Information: Please remember that past performance is not necessarily a guide to the future and that the value of shares and the income from them can go down as well as up. Exchange rates may also cause the value of underlying overseas investments to go down as well as up. Marten & Co may write on companies that use gearing in a number of forms that can increase volatility and, in some cases, to a complete loss of an investment.