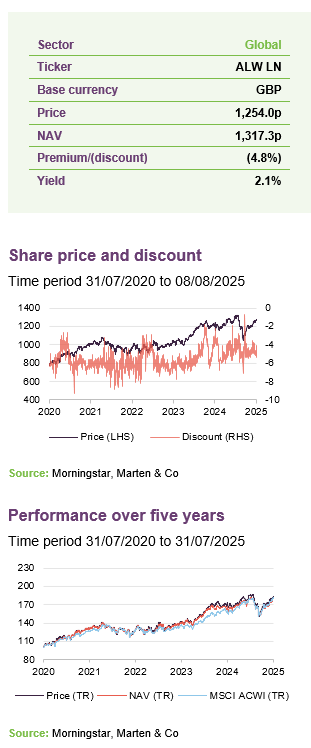
A new giant for a new market reality
Alliance Witan (ALW), the result of the merger between Alliance Trust and Witan in October 2024, is now a large investment company. The combined entity now has c.£4.5bn in assets and is part of FTSE 100. Investors are experiencing higher liquidity, lower fees, and an increased dividend. Under its multi-manager approach, ALW’s NAV returns have been ahead of global equities over the last five years and above its average peer.
ALW has added two new managers to its roster, Jennison Associates and EdgePoint. On average, the underlying managers have a more defensive stance, with increased underweight exposures to US tech and healthcare, and reallocations toward energy, materials, and utilities. This appeared to position ALW well for the market turbulence sparked by US president Trump’s tariff announcements, although markets have rebounded since.
Global stock-picking portfolio
Alliance Witan aims to be a core equity holding for investors that delivers a real return (after adjusting for inflation) over the long term through a combination of capital growth and a rising dividend. It invests primarily in global equities across a range of industries and sectors via a “manager of managers” approach. This is intended to reduce the risk often taken by investors selecting a single “star” manager or one particular style that can move in and out of favour.
| 12 months ended | Share price total return (%) | NAV total return (%) | MSCI ACWI total return (%) |
|---|---|---|---|
| 31/07/2021 | 31.3 | 30.1 | 25.7 |
| 31/07/2022 | (0.9) | (0.9) | 2.3 |
| 31/07/2023 | 10.2 | 10.3 | 6.8 |
| 31/07/2024 | 21.3 | 17.3 | 17.2 |
| 31/07/2025 | 5.5 | 6.7 | 12.5 |
Fund profile
“a core equity holding for investors that delivers a real return over the long term”
Alliance Witan Trust (ALW) aims to be a core equity holding for investors that delivers a real return over the long term, through a combination of capital growth and a rising dividend.
The company invests primarily in global equities across a wide range of industries and sectors. Willis Towers Watson has appointed a number of stock pickers with different styles, who each ignore the benchmark and only buy a small number of (around 20) stocks in which they have strong conviction (though in the case of the GQG emerging market portfolio, a total of 60 stocks are used for diversification reasons). For performance measurement purposes, the trust is benchmarked against the MSCI All Countries World Index in sterling terms (MSCI ACWI). The board also monitors ALW’s returns relative to similar investment companies.
ALW (as Alliance Trust) has a long history dating back to 1888, although the current “manager of managers” investment approach is much newer, having been adopted with effect from 1 April 2017. ALW is an AIC Dividend Hero, having increased its dividend in each of its last 58 financial years.
Now in the FTSE 100
Alliance Witan (ALW) was created through the merger of two long-established investment trusts – Alliance Trust and Witan. After Witan’s CEO, Andrew Bell, announced his plan to retire in March 2024, its board took the opportunity to consider a range of options for Witan’s future. One proposal tabled was a combination with Alliance Trust, which also followed a global multi-manager strategy. This became the favoured option and the two trusts merged on 9 October 2024 to form Alliance Witan. The enlarged vehicle, with combined assets of c.£5bn, was promoted to the FTSE 100.
Although we covered the proposal in detail in our prior note, to recap:
- Willis Towers Watson (WTW) remains the manager of ALW, and the trust follows the same multi-manager investment process that it used previously. ALW retained a small portfolio (sub-3% of NAV) of investment trust and private equity funds that Witan used to hold, and the intention is that these assets will be liquidated over time, in a manner that is intended to deliver better value to shareholders.
- ALW’s manager has shared some of the benefits of the trust’s increased scale through the adoption of a more competitive management fee structure (outlined on page 25). Had the new fee structure been in place in the previous year, shareholders in what was Alliance Trust would have saved about £1.74m.
- ALW has increased its dividend payment to align with the level expected by former shareholders in Witan, which implied a 6.4% increase from its previous level. ALW’s dividend profile is described on page 22.
Ultimately, previous shareholders of Alliance Trust have seen no material changes in the running of their investment, as WTW has retained the same investment process throughout, although they do benefit from the fee reduction made possible by the additional scale as well as from the liquidity improvements the larger size brings. Previous Witan shareholders benefit from greater scale effects and they also have exposure to a strategy that has recorded higher performance in recent years – Alliance Trust had outperformed Witan by c.20% over the five years prior to the merger.
2025 half year results
ALW recently released its half year results for the six months ending 30 June 2025 (which can be read here). Over the six-month period ALW generated a NAV total return of (0.7%) and a share price total return of (0.7%) and paid an interim dividend of 14.16p per share.
WTW notes that against a backdrop of an uncertain six months, ALW’s returns were mixed, with its stock pickers failing (in aggregate) to outperform the market, despite the less concentrated nature of returns over the period. Dalton was the strongest performer – taking advantage of the opportunities presented by Japan’s corporate governance reforms. Other notable contributors to returns were Sands, Metropolis and Lyrical. On a sector/country level, ALW benefited from its underweight position in the US and a small weighting to Apple.
GQG’s portfolio was the largest detractor to returns. Its bias to ‘defensive growth’ companies, such as the utility company Exelon, detracted from returns.
Looking forward, WTW is hesitant to make major changes to ALW’s manager roster; citing that the six-month period was atypical for markets – as described in the section below – and that over-reacting to short-term market swings would be unlikely to boost returns. Rather, it believes that current volatility is “likely to be a rewarding environment for active managers” – with the opportunities presented by divergences between earnings and share prices improving in such environments.
Market backdrop
Since our last published note in September, global markets have experienced significant movements. In the final months of 2024, equities, led by the US market, rose seemingly first in anticipation, and then confirmation, of victory for Donald Trump in the US presidential election. Investors perhaps focused on the promise of business-friendly policies from the new administration, particularly tax and regulation cuts, supported by Republicans control of both houses of Congress.
However, a key part of Trump’s worldview has always been the importance of trade tariffs to secure American prosperity – a view differing from that of many economists. In early 2025, investors could no longer ignore this aspect of Trumpism, as the US president levied tariffs on imports from China, Mexico, and Canada, as well as announcing a general 25% levy on imported cars. However, these measures were a mere precursor to “Liberation Day” on 2 April, when Trump announced that “reciprocal tariffs” would be levied on virtually every country, starting from a baseline of 10% and rising in proportion with each country’s bilateral trade deficit with the US.
These measures were much more severe than had been expected. Equities sold off heavily, and in the US, this was accompanied by a simultaneous jump in government bond yields and fall in the value of the dollar, with the whole US financial system appearing to come under significant pressure.
One week after the initial announcement, the US president announced a 90-day pause to tariffs above the 10% baseline, with the notable exception of China (increased aggressively, eventually to a scarcely believable 145%). Markets responded, with the S&P 500 recording its best one-day rally since 2008, and pressure on government debt eased.
Figure 1: Market performance from 1 September 2024 to 31 July 2025
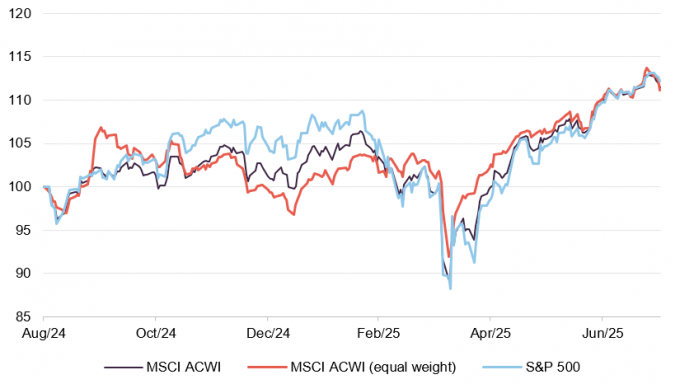
Source: Bloomberg, Marten & Co
However, while progress has been made with some of America’s key trading partners – notably the UK, Europe, Japan, and China, which have negotiated frameworks for new trade agreements that have resulted in a partial rollback of tariffs – the exact terms of these deals are yet to be fully hashed out. The initial 90-day pause and a further extension to 1 August have now expired. While countries continue to negotiate with the US, America has now (at time of writing) raised its average tariff rate from c.3% to c.20%.
Moreover, the introduction of a 10% baseline tariff by Trump appears to have become a fixed policy position, now seen as non-negotiable for all trading partners.
This period of market turmoil also affected the so-called “Magnificent Seven” stocks comprising Alphabet, Apple, Microsoft, Amazon, Meta, Nvidia and Tesla. Reports of Chinese advances in AI from Deep Seek created uncertainty. Tesla also had had its own challenges as its founder and major shareholder, Elon Musk, has come under significant criticism for, amongst other things, involvement within the Trump administration. However, the technology sector rebounded almost as quickly as it fell, with the Nasdaq now up year-to-date, as investor risk appetite increased, and US technology firms continued to deliver strong earnings in their most recent round of announcements.
A central bank balancing act
This recent turmoil has made the future direction of interest rates less clear. At the beginning of this inflation appeared to be coming under control, with steady interest rate cuts in the US, Eurozone, and UK. With global trade disputes likely bad for growth, many forecasters are predicting recession in the US and elsewhere later this year. This would perhaps be a reason for rates to be cut further, and indeed Trump has been publicly pressuring the President of the Federal Reserve, Jerome Powell, to do just that. However, tariffs also tend to be inflationary, and so central banks are engaged in a delicate balancing act.
Figure 2: Trade-weighted dollar index since President Trump’s second inauguration
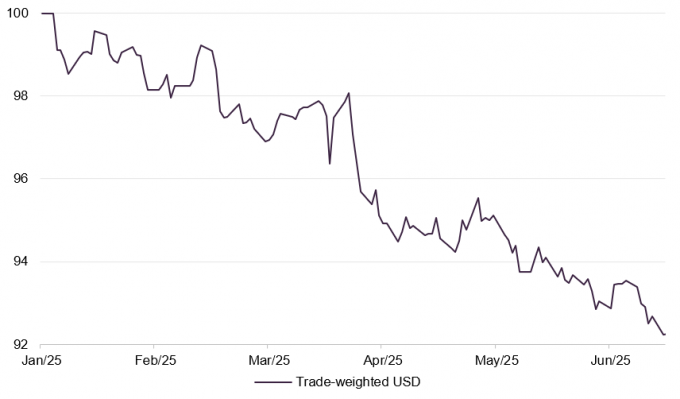
Source: Bloomberg, Marten & Co
Some commentators are raising longer-term questions about the sustainability of the US as the leading global financial centre, and in particular the status of the dollar as the world’s reserve currency, saying that these have rested to a large extent on investor faith in the predictability and dependability of US policymaking, and support for the rules-based global order. They claim that this is now being brought into question, which is perhaps reflected in the steep fall in the trade-weighted dollar this year.
It may be that investors are, perhaps for the first time, considering the possible end of dollar dominance and what might follow. This could likely have far-reaching consequences, not least if that led to structurally higher yields in the US.
Another often cited source of concern has been the One Big Beautiful Bill Act. This is the Congressional budget bill proposed by President Trump that will, among many provisions, make permanent the tax cuts introduced during his first term. The non-partisan Congressional Budget Office forecasts the bill would, by 2034, add $2.6trn to the US national debt, which already amounts to 124% of GDP – very close to its all-time high. Many investors express concern about the impact of the bill on long-term US government debt.
Asset allocation
ALW’s asset allocation is primarily determined by the stock selection decisions of its underlying managers. However, Willis Towers Watson retains discretion to adjust manager allocations to either enhance alpha generation or improve diversification. Its standard practice is to allocate in a manner that avoids any dominant stylistic biases within ALW’s portfolio, positioning it so that stock selection should remain the principal driver of performance.
Figure 3: ALW asset allocation by region as at 30 June 2025
Figure 4: ALW asset allocation relative to benchmark as at 30 June 2025
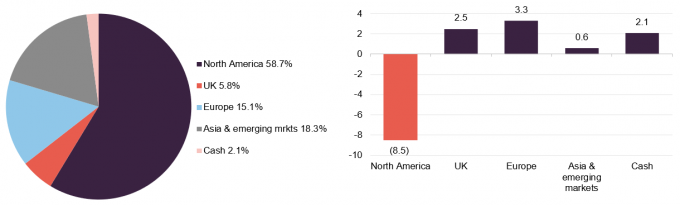
Source: Alliance Witan
Source: Alliance Witan
ALW currently has a noticeable underweight to North America
As at end-May 2025, the portfolio was underweight North America and overweight the UK and Europe relative to the MSCI ACWI. Compared to the data from 31 July 2024 (as used in our last note), the portfolio’s underweight to North America has slightly increased, its allocation to Europe has increased, and there has been a reduction in exposure to the UK and Asia and emerging markets. These changes reflect the activity of the underlying managers during the intervening period as well as shifting market dynamics in 2025 – notably, the MSCI Europe ex UK outperformed North America by 18% during the first half of 2025.
Adjustments to ALW’s regional exposures may also reflect the changes in its roster of delegated portfolio managers, detailed on page 9. These include the addition of a new global growth manager and the replacement of one global value manager.
On a sector level, the largest shift has been the increase in ALW’s underweight to technology, having increased by 2.6%, where there also being a 2.2% increase in its healthcare underweight. Correspondingly there has been an increased allocation to utilities, financials, and consumer staples.
ALW’s portfolio had a 74% active share as of end June 2025.
Figure 5: ALW asset allocation by sector
as at 30 June 2025
Figure 6: ALW asset allocation by sector relative to benchmark as at
30 June 2025
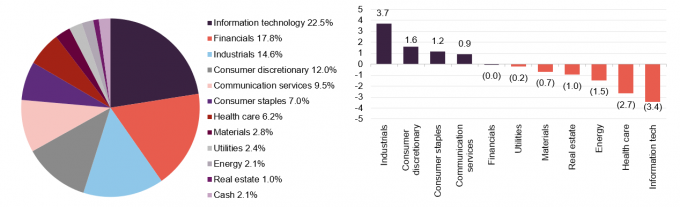
Source: Alliance Witan
Source: Alliance Witan, MSCI
The managers
Figure 7: Portfolio split by underlying manager 30 June 2025
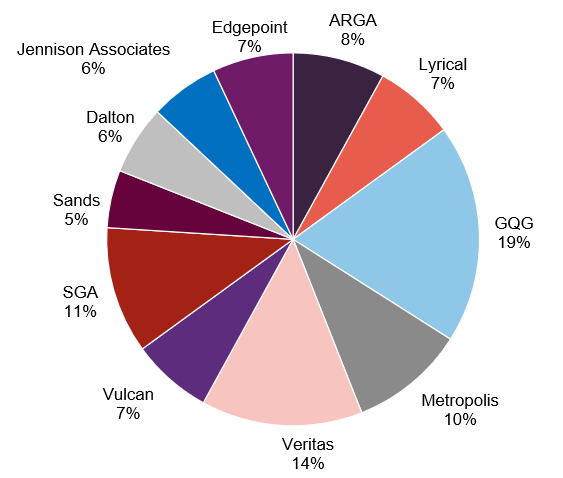
Source: Alliance Witan
WTW’s chief investment officer, Craig Baker, is the lead manager on ALW’s portfolio. He chairs the investment committee, which also includes Stuart Gray and Mark Davis. Collectively, they bring over 65 years of investment experience. They are supported by a global research team of 177 associates (as at end-December 2023).
ALW has added two new sub-managers – Jennison Associates and EdgePoint
Since our last note, two sub-managers have been added: Jennison Associates and EdgePoint. Jennison joined ALW’s portfolio through the merger, having previously managed assets for Witan. EdgePoint replaced Black Creek, which was removed from ALW’s portfolio in October 2024. This brings the total number of managers in ALW to 11. Both of these new managers are discussed below.
WTW says that the departure of Black Creek does not reflect any issues with its performance, but rather the result of WTW’s analysis of the succession planning in place for the manager. Although no formal retirement date has been set for Bill Kanko, the named manager, the firm has experienced significant senior-level departures in the past year, including retirements due to illness. WTW took the opportunity to transition to another manager in which it had similarly high conviction. Notably, WTW has maintained its rating on Black Creek.
Figure 8: Change in quarterly manager allocation to end March 2025
| 31 December 2023(%) | 31 March 2024(%) | 30 June 2024(%) | 30 September 2024(%) | 31 December 2024(%) | 31 March 2025(%) | |
|---|---|---|---|---|---|---|
| GQG (EM portfolio) | 6 | 6 | 7 | 7 | 6 | 6 |
| GQG (global portfolio) | 15 | 14 | 15 | 15 | 13 | 13 |
| Sands | 5 | 4 | 6 | 6 | 5 | 5 |
| Lyrical | 6 | 7 | 6 | 7 | 7 | 6 |
| SGA | 11 | 11 | 13 | 13 | 11 | 10 |
| Veritas | 15 | 14 | 13 | 13 | 14 | 15 |
| Vulcan | 7 | 6 | 6 | 6 | 8 | 7 |
| Metropolis | 11 | 10 | 11 | 11 | 10 | 10 |
| Dalton | – | 5 | 5 | 5 | 6 | 6 |
| ARGA | – | – | 8 | 8 | 8 | 8 |
| Jennison Associates | – | – | – | – | 6 | 6 |
| EdgePoint | – | – | – | – | 7 | 8 |
New sub-managers – Jennison Associates and EdgePoint
Jennison Associates
Jennison Associates, previously a manager within Witan’s portfolio, has been incorporated into ALW’s manager line-up following the merger. The firm is one of WTW’s highest-rated managers. The portfolio is managed by Mark Baribeau, Tom Davis, and Rebecca Irwin.
Based in New York and founded in 1969, Jennison Associates focuses on identifying innovative, fast-growing companies globally – firms driving structural shifts within their industries, while retaining defensive quality characteristics. As described by the firm, these are “innovative and disruptive companies whose uniqueness sets them apart from their peers”. The team aims to identify such companies early in their growth cycle, in order to capture maximum upside.
Jennison has a clear bias toward growth stocks, prioritising revenue growth as the key metric. The team believes that earnings and cash flow growth are by-products of strong top-line performance. Secondary considerations include incremental profitability (additional profit per unit sold) and the quality of company management.
All three portfolio managers also oversee Jennison’s Global Equity Opportunities strategy. Jennison’s inclusion adds another growth-style manager to ALW, potentially broadening the diversity of growth exposures within the portfolio.
Although the ALW mandate will differ from that of the Global Equity Opportunities fund, the historical performance of that strategy provides some insight into the team’s capabilities. Since inception in April 2011, with Baribeau and Davis managing from launch and Irwin joining later that year, the strategy has delivered annualised outperformance of 4.0% versus the MSCI ACWI (in USD), with an information ratio of 0.4 and a Sharpe ratio of 0.7.
Figure 9: Reddit (USD)
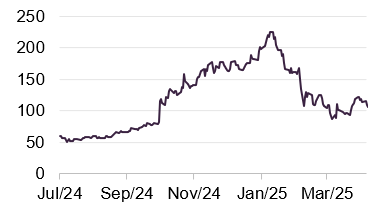
Source: Bloomberg
One example of Jennison Associates’s investments, and a notable contributor to ALW’s performance over 2024, is Reddit (reddit.com), the social media platform ranked as the ninth-most-visited website globally. Reddit’s share price began a significant rally in November 2024, peaking in February 2025. The rally was triggered by the release of Q3 results, which showed the company had achieved profitability – just months after its IPO in March 2024.
For the 2024 financial year, Reddit reported revenues of $1.3bn, marking a 62% year-on-year increase, and a gross margin of 90.5%. Despite posting a profit in Q3, the company reported a full-year net loss of $484m. However, Q1 2025 results showed a return to profitability, with a reported net margin of 6.7%.
Reddit’s growth coincided with improving market sentiment around artificial intelligence. The platform positioned itself as an “AI training ground”, offering data that AI developers could use to train models based on user-generated content.
Since its February 2025 peak, Reddit’s share price has retraced much of its gains. The pullback seems to reflect investor concerns over the company’s ability to sustain growth, as well as the potential negative impact of changes to Google’s search algorithm, which could reduce traffic to the site. Jennison exited its position in Reddit in March.
EdgePoint
EdgePoint became part of ALW’s manager line-up in October 2024, replacing Black Creek. Based in Toronto, the firm was founded in 2008 and is led by co-founders and co-CEOs Tye Bousada and Geoff MacDonald, who also manage the portfolio for ALW.
EdgePoint’s investment philosophy centres on identifying what it terms “undervalued growth” – companies with a growth catalyst not yet reflected in their current valuation. These catalysts may include structural industry changes or shifts in company leadership. The firm targets opportunities it believes can outperform peers over a 10-year horizon.
EdgePoint also adopts a “business-owner” mindset, advocating a long-term perspective akin to that of private business owners. It seeks to look beyond short-term volatility – viewing it instead as a potential entry point – and waits for the market to fully recognise the assessed value of its holdings. Although the firm targets growth opportunities, its emphasis on valuation often results in a portfolio comprising stocks typically classified as “value”.
WTW says that EdgePoint operates with a lean, highly-engaged team, and its funds often have multiple named managers. The firm has run a single flagship capital-growth strategy since November 2008: the EdgePoint Global Growth portfolio, which has delivered annualised outperformance of 1.3% versus the MSCI ACWI (in USD), with an information ratio of 0.2 and a Sharpe ratio of 0.7.
Figure 10: Nippon Paint Holdings (JPY)
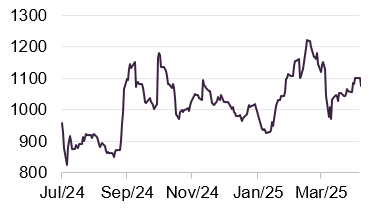
Source: Bloomberg
One example of EdgePoint’s investments is Nippon Paint Holdings (nipponpaint-holdings.com), a Japanese manufacturer of paints and related products, and the fourth-largest paint producer globally. For its 2024 financial year, Nippon Paint reported record sales of ¥1.6tn, representing 13.6% year-on-year growth, and exceeding market expectations. It also posted record operating profits of ¥188bn, with an operating margin of 11.5%.
Following the results, which outpaced consensus forecasts, the company’s share price rose 27% in the subsequent weeks, though part of these gains were later reversed after the announcement of new US tariffs.
EdgePoint anticipates two key drivers of future growth for Nippon Paint: ongoing industry consolidation, which it expects to expand its market share, and a new management team, which the firm believes will support margin expansion and improved shareholder returns.
Other sub-managers
GQG
Quality growth
Rajiv Jain, founder, and CIO of GQG Partners, oversees both ALW’s emerging markets mandate and its global portfolio, with support from Brian Kersmanc and Sudarshan Murthy. GQG – Global Quality Growth – reflects the team’s stated focus on fundamentally sound businesses, characterised by robust balance sheets, sustainable long-term competitive advantages, and shareholder-aligned management. Valuation is assessed based on long-term earnings potential, while top-down macroeconomic insights provide additional context. Jain acknowledges that such a quality-biased approach may underperform in momentum-driven or speculative phases of the market cycle, where investors are favouring riskier investments.
ARGA
Mispriced value
ARGA Investment Management’s portfolio is managed by A. Rama Krishna, the founder and chief investment officer of ARGA. ARGA’s investment approach focuses on identifying “undervalued” businesses, utilising a process that requires a detailed assessment of a company’s commercial practices, and a deliberate effort to remove emotional decision-making from stock selection.
ARGA’s investment philosophy is based on traditional value investing principles: the valuation approach identifies businesses as “statistically cheap” and determines whether this is temporary or permanent, often uncovering opportunities where investors may have strongly reacted to negative events, interpreting temporary dips in share prices as permanent losses of capital.
Lyrical
Fundamental value
The ALW portfolio managed by Lyrical Asset Management is overseen by Andrew Wellington. Lyrical is a fundamental value investor, looking to buy businesses at a discount to their true value. It screens the 1,000 largest US stocks using a range of value measures and then undertake more intensive research on those that pass the screen. Lyrical favours companies with higher returns on invested capital and avoids businesses perceived as overly complex. The firm says that the breadth of opportunities available to it is quite narrow and so it is ideally suited to running concentrated portfolios.
SGA
Quality growth
The portfolio managed by Sustainable Growth Advisers (SGA) for ALW is run by HK Gupta, Kishore Rao, and Rob Rohn. The managers are looking for high-quality companies with predictable, above-average long-term earnings and free cash-flow growth. These will typically be differentiated global businesses with pricing power and predictable, recurring revenues. The managers invest selectively in those companies that they believe offer the best opportunities over a three- to five-year time horizon.
Veritas
Steady growth
Andy Headley, head of global strategies at Veritas Asset Management, leads the management of the portfolio the firm manages for ALW.
The approach targets high-quality businesses with durable competitive advantages and the ability to grow cash flows consistently over time. These companies are described by the firm as tending to outperform in volatile or falling markets. Veritas also seeks out recovery plays, where there can be the opportunity to acquire quality businesses at temporarily depressed valuations. The team prioritises business fundamentals before assessing valuation and is willing to hold cash when opportunities are scarce.
Vulcan
Value in quality companies
The lead manager on the portfolio that Vulcan Value Partners manages for ALW is C.T. Fitzpatrick, Vulcan’s CIO. Mostly focused on large-cap stocks, the team looks for companies where it believes there is a margin of safety between the value the market is attributing to the company and its assessed intrinsic value. These companies are described as having strong balance sheets and high levels of recurring cash flow – making them easier to value, in Vulcan’s opinion. Vulcan takes a contrarian, high-conviction approach, typically holding a concentrated portfolio of around 14 names. The philosophy is long-term, with a five-year investment horizon, and the team is prepared to wait patiently for valuation opportunities in companies it would be happy to own.
Sands Capital
Sustainable, structural growth
The lead managers on the portfolio run by Sands Capital’s portfolio for ALW are Dave Levanson and Sunil Thakor. Based in Arlington, Virginia in the US, Sands follows a pure growth-orientated philosophy which is rooted in the belief that over the long term, a company’s share price appreciation follows the earnings power and the growth of the underlying business. The firm focuses on finding companies it considers to be high-quality, wealth-creating growth businesses using a fundamental, bottom-up research approach, with the view that these businesses will have higher long-term growth than the market. Sands’s focus is on the sustainability of a business’s future earnings growth. It seeks companies that are experiencing structural change and secular trends distinct from cyclical economic factors.
Metropolis Capital
A private equity approach to investing
Metropolis Capital has a value-focused investment style that draws upon the approaches and methodologies of Warren Buffett. It searches for businesses with established positions in their markets, but which have fallen out of favour with investors because of perceived short-term problems or market risk. Metropolis is long-term-focused and considers each investment as if buying the whole business, which involves a deep, private equity style of due diligence on the business, management quality and risks. The firm seeks out companies with substantial cash flows and balance sheets that are easy to understand and have long-term competitive advantages as well as management teams that are described as being well aligned with other shareholders through having a significant stake in the business.
Dalton Investments
Value-focused Japanese equities
The portfolio managed by Dalton Investments represents a significant part of ALW’s allocation to Japanese equities, investing exclusively in the region. Dalton is headed up by its founder, Jamie Rosenwald, who is supported by a Tokyo-based team.
Dalton’s portfolio focuses on small-cap value opportunities – favouring companies with established governance structures, quality employees, an entrepreneurial culture, and owner-operated firms (as they can have closer shareholder-alignment). These are factors that Jamie believes are paramount in ensuring a company can generate above-market growth.
The consideration of these factors is in addition to conventional financial analysis, which aims to ensure that portfolio companies are of sufficient quality not to become “value traps”. Capital preservation is also a key consideration for the team, as they look for a “margin of safety” in their investments.
Top 10 holdings
It remains the case that for ALW’s portfolio, where every stock is considered a “best idea”, an analysis of the top 10 holdings is arguably less insightful than for most other trusts. However, it may be still worth highlighting the changes to the top 10 since our last note in September 2024 (with data as at 31 July).
The three companies that have moved out of the top 10 are Aon, Mastercard and Alphabet. Aon was a relatively new entry to the top 10 and was covered in some detail in the last note; whilst it is no longer in the top 10, it remains in the portfolio. Aon is still held by Veritas, but it is now a sub-1% position for ALW.
Mastercard and Alphabet are still held within the portfolio, but at notably smaller position sizes. Taiwan Semiconductor, Netflix and ServiceNow moved into the top 10 since we last published.
Figure 11: ALW’s 10 largest holdings as at 30 June 2025
| Holding | Sector | Country | 30 June 2025 (%) | 31 July 2024 (%) | Percentage point change |
|---|---|---|---|---|---|
| Microsoft | Information technology | United States | 5.0 | 3.2 | 1.8 |
| Amazon | Consumer discretionary | United States | 2.6 | 3.6 | (1.0) |
| Taiwan Semiconductor | Information technology | Taiwan | 1.9 | 0.7 | 1.2 |
| Meta Platforms | Communication services | United States | 1.8 | 1.3 | 0.5 |
| Visa | Information technology | United States | 1.8 | 2.7 | (0.9) |
| NVIDIA | Information technology | United States | 1.7 | 2.1 | (0.4) |
| Netflix | Communication services | United States | 1.4 | 0.3 | 1.1 |
| Diageo | Consumer staples | United Kingdom | 1.4 | 1.5 | (0.1) |
| UnitedHealth Group | Healthcare | United States | 1.4 | 1.7 | (0.3) |
| ServiceNow | Information technology | United States | 1.3 | 0.3 | 1.0 |
| Total | 20.3 | 17.1 | 3.2 |
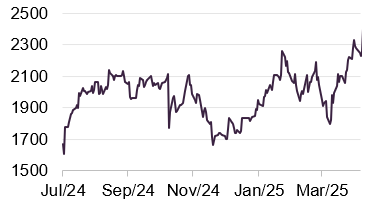
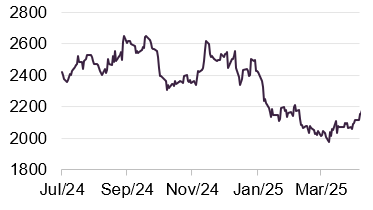
Taiwan Semiconductor
Figure 12: Taiwan Semiconductor (TWD)
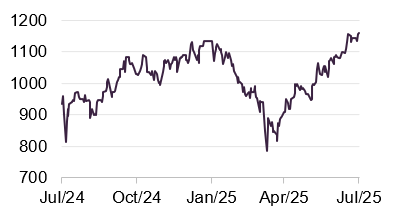
Source: Bloomberg
Taiwan Semiconductor (tsmc.com) is the world’s largest dedicated independent semiconductor chip manufacturer. It has been a significant beneficiary of the recent growth of AI, with a huge increase in demand for its fabricated chips from its clients, the likes of Apple and NVIDIA, keeping TSMC’s foundry operations running at full capacity. This upward trend continued through most of 2024, and the shares received a further boost from the general positive market reaction to the result of the US presidential election towards the end of the year.
TSMC’s shares did come under pressure earlier this year, amid renewed US–China trade tensions and Trump’s tariffs. TSMC is heavily reliant on smooth cross-border trade and is geographically exposed, sitting close to mainland China while serving predominantly US clients. Any escalation that threatens Taiwan’s territorial integrity would represent a material risk. However, recent comments from the Trump administration have been more conciliatory, and the company’s latest results showed a 42% year-on-year increase in quarterly revenue, ahead of analyst forecasts.
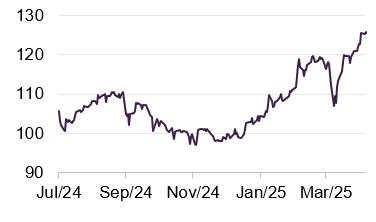
Netflix
Figure 13: Netflix (USD)
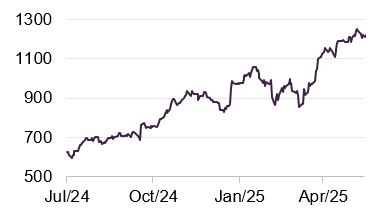
Source: Bloomberg
Netflix (netflix.com) has had a year of notable growth, with its global audience reaching 700m – one-third in the US and two-thirds internationally. Its latest results contributed to the shares to an all-time high, with quarterly revenue of $10bn and profit of $3bn. The business model is largely insulated from tariffs and described by the company as resilient in a downturn. The company’s crackdown on “password sharing” has led to an increase in subscribers, and the sector continues to favour scale with the big incumbents consolidating their leads.
While future growth is expected to come primarily from core streaming, Netflix is exploring adjacent ventures. Following the success of “Stranger Things: The First Shadow”, 2025 will see the launch of two US-based retail locations featuring themed dining, merchandise, and interactive experiences.
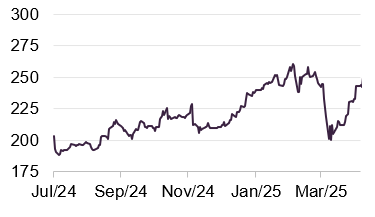
ServiceNow
Figure 14: ServiceNow (USD)

Source: Bloomberg
ServiceNow (servicenow.com) is a Santa Clara, California-headquartered, software company that supplies its cloud computing platform to organisations. Originally developed specifically for IT service management, the platform has since expanded to support a wide range of business functions including HR, customer service and security operations. It is used by corporates in the banking, healthcare, and manufacturing sectors, amongst others, and it has also been adopted by parts of the US government at all levels – federal, state, and local – to modernise operations and improve services to the public. For example, state government in North Carolina uses the ServiceNow platform for managing IT and public health workflows.
The company’s increasing focus on AI is evident in its recent acquisition activity, notably a $2.85bn purchase in March of Moveworks, an AI start-up specialising in employee support through generative AI assistants. ServiceNow has also entered into collaborations focused on AI with NVIDIA, AWS, Microsoft, and Cisco.
Share price performance this year has been in line with companies within the wider technology sector, with a sell-off at the start of the year erasing much of the gain from 2024, followed by a notable recovery in May. Also in May, the company was a featured participant at the Knowledge 2025 conference in Las Vegas, where it unveiled several new innovations including an “AI Control Tower”, described as a centralised command centre that allows organisation to manage workflows across the enterprise.
Superior earnings upside
One of the stated advantages of ALW’s multi-manager approach is its ability to identify what ALW hopes are the best companies, with the best share-price upside. Whilst the latter is determined by the reactions of the market, be they rational or irrational, company performance can be a more predictable outcome, as management quality, balance sheets, or business models (or the preferred metric a fund manager has) are determined by factors more often within the company’s control.
Though ATST’s performance has lagged its benchmark over the last 12 months, its delegated managers recorded higher rates of selecting companies that outperform on a fundamentals basis. As can be seen in Figure 15, the companies in ALW’s portfolio have, based on their weighted average, delivered higher earnings surprises than the wider market (based on their most recent earnings updates), with ALW delivering 44% higher earnings surprises than its benchmark. Noteworthy examples are Amazon, Meta, and Eli Lilly & Co – all three of which are among ALW’s largest positions, and have delivered 18%, 7%, and 6% earnings surprises respectively.
Figure 15: Earnings performance of ALW versus MSCI ACWI
| Adjusted EPS surprise (% difference) | EBIT surprise (% difference) | Analyst estimate of long-term annual EPS growth (%)2 | |
|---|---|---|---|
| ALW | 18.3 | 8.1 | 14.1 |
| iShares MSCI ACWI ETF1 | (26.0) | (2.0) | 13.4 |
One could observe that the market is also predicting slightly higher long-term earnings growth for ALW’s companies than its benchmark.
Performance
ALW has significantly outperformed its peers over the last five years
Figures 16 and 17 show that, within the timeframe of the past five years, ALW has experienced distinct periods of both underperformance and outperformance. As noted in previous notes, ALW’s active multi-manager approach can result in underweighting particular market leaders.
In particular, in the case of the so-called Magnificent Seven US technology stocks, with the portfolio, for example, holds no Apple and is underweight NVIDIA. Figure 16 illustrates the impact that this has had on the benchmark in the past few years, with ALW performing perceivably much better relative to the equal weighted index, which reduces the impact of the mega-cap stocks.
ALW’s recent performance has lagged somewhat, largely due to single stock performance, as some of its larger overweight positions, such as Diageo and United Health Group, have significantly notably underperformed the benchmark.
At times, this technology underweight has benefitted ALW’s performance, most recently earlier in 2025, as the sector saw large declines in value during the market volatility. However, most recently it was the opposite case during May as the Magnificent Seven rallied strongly.
Figure 16: ALW NAV total return performance relative to benchmark and peer group1, five years to 30 June 2025
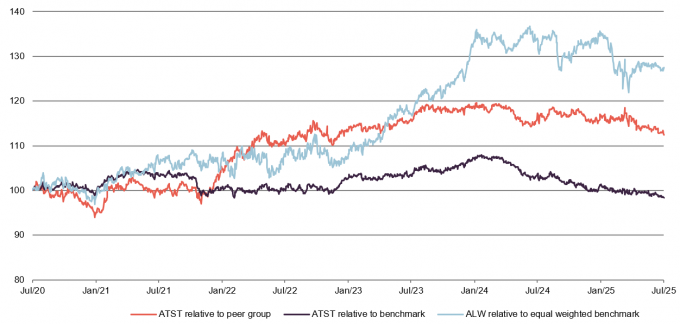
Source: Morningstar, Marten & Co. Note 1) peer group is defined on page 22.
As Figure 17 shows, although ALW has slightly underperformed its benchmark, MSCI ACWI index, over the longer term (over three and five years), it has performed comparably to its actively managed competition. Compared to its closed-ended peer group, NAV performance was in-line over three (38.0% versus 37.9%) and five years (77.9% versus 60.1%). The Investment Association compiles a sector average for open-ended global funds, and against this ALW compares appreciably well, given three- and five-year returns for the IA average of 29.8% and 59.4% respectively.
Figure 17: Cumulative total return performance over periods ending 31 July 2025
| 1 month (%) | 3 months (%) | 6 months (%) | 1 year (%) | 3 years (%) | 5 years (%) | |
|---|---|---|---|---|---|---|
| ALW share price | 4.7 | 13.1 | (2.2) | 5.5 | 41.0 | 83.4 |
| ALW NAV | 4.0 | 11.5 | (1.6) | 6.7 | 38.0 | 77.9 |
| MSCI ACWI | 5.0 | 13.0 | 1.3 | 12.5 | 40.8 | 81.0 |
| MSCI ACWI (equal weighted) | 4.6 | 10.3 | 4.3 | 12.0 | 17.0 | 39.6 |
| Peer group sector average NAV1 | 4.8 | 14.6 | 1.6 | 10.6 | 37.9 | 60.1 |
| IA Global sector average2 | 4.5 | 12.5 | 0.2 | 9.2 | 29.8 | 59.4 |
2025 top contributors
Figure 18: Top five stock contributors
| Sector | Country | Average active weight (%) | Total return (£ %) | Attribution effect | |
|---|---|---|---|---|---|
| Apple | Information Technology | United States | (3.7) | (12.9) | 0.7 |
| NRG Energy | Utilities | United States | 0.5 | 58.9 | 0.2 |
| Netflix. | Communication Services | United States | 0.8 | 35.3 | 0.2 |
| Ryanair Holdings | Industrials | Ireland | 0.8 | 4.6 | 0.2 |
| Berkshire Hathaway | Financials | United States | (0.9) | (14.1) | 0.2 |
As discussed, ALW’s underweight to mega-cap technology has benefited its performance over H1 2025. In fact, one of the largest contributors to ALW’s relative returns over that period has been its underweight to mega-cap technology stocks. With ALW’s underweight to Alphabet, and Apple contributing c.2% to ALW’s relative returns over the first six months of the year. ALW held no Apple in a period where the stock fell 19%.
In terms of its active positions, ALW’s overweight in Ryanair, Mercado Libre, Vinci, Safran, and NRG Energy were all positive contributors – and are described below. Netflix was also a notable contributor to ALW’s returns.
Ryanair
Figure 19: Ryanair (EUR)
Source: Bloomberg
Ryanair (ryaniar.com) is the Ireland-listed low-cost airline, and Europe’s largest carrier based on fleet size and passenger numbers, carrying 200m passengers in 2024.
Ryanair’s shares have risen throughout the past 12 months, having quickly recovered from the tariff selloff as well. The catalyst for this performance was Ryanair’s increasing earnings and profitability, with its Q1 2025 results exceeding analysts’ expectations. Revenues increased 20% YoY (for the three months ending June 2025), 15% higher than the market’s expectations, with post-tax profits up an impressive 128% YoY. Ryanair reported strong demand over the summer as, with its management not sharing the softening market commentary of its peers. While the full-year passenger traffic is expected to grow by only 3%, due to delayed deliveries of new planes, Ryanair’s management expects “reasonable net profit growth over 2026” and a recovery in air fares from the previous year’s decline.
Mercado Libre
Figure 20: Mercado Libre (USD)
Source: Bloomberg
Mercado Libre (mercadolibre.com) is a Latin American e-commerce company that was founded in Argentina (now headquartered in Uruguay and listed in the US) that operates online stores and auctions, as well as other web services such as classified advertising, alongside a substantial fintech arm. Mercado Libre is potentially Latin America’s most popular e-commerce provider, with the majority of its sales coming from Brazil.
Mercado Libre’s shares are up 40% YTD, reflecting the growth in ecommerce usage within Latin America, and the resulting effect it has had on Mercado Libre’s results. In its Q1 2025 results, Mercado Libre reported earnings that exceeded the market’s expectations, with EBIT up 45% YoY and revenues up 37%. One of the main contributors to this was the improving sales from its Argentinian e-commerce business, which is now the second-largest source of sales, though all markets saw improved sales growth. Mercado Libre reported 67m unique active users, up 25% YoY, and the fastest quarterly user growth in five years. Its fintech business also saw strong growth, with its assets doubling over the last 12 months, and now contributing 44% of the group’s total revenue, and growing 43% YoY.
Vinci
Figure 21: Vinci (EUR)
Source: Bloomberg
Vinci (vinci.com) is a French transport infrastructure, energy services, and construction firm. Its largest division by revenues is its construction arm, followed by its energy services, and finally its concessions to manage government-owned roads and airports. It is among the largest global firms in construction and concessions, employing 280,000 people in over 120 countries.
Vinci’s recent share price gains were driven by increasing demand for its services, and the improving trends outlined by the management team. In its most recent results, Vinci reported YoY growth across all of its divisions, and slightly outperformed market expectations. Total revenues grew 2.8% YoY, with its concessions division recording the highest growth rate, growing 8.2% thanks to higher motorway traffic levels and increased airport passenger numbers.
Vinci’s management reiterated its earnings guidance, having reiterated its earnings guidance, and expects 2.9% revenue growth for 2025. Part of this outlook was linked to anticipated opportunities from Germany’s infrastructure plan (over a medium-to-long-term basis), as well tariffs having no direct impact on the business. It also outlined Vinci’s strong near-term position, with €11.8bn in net cash, a record-high order book of €72bn (equivalent to 14 months of business activity).
Safran
Figure 22: Safran (EUR)
Source: Bloomberg
Safran (safran.com) is a French-headquartered aerospace firm and is the world’s second-largest manufacturer of aircraft equipment, such as landing gears and brakes. It also produces other aerospace equipment, such as missile propulsion systems and spacecraft components.
Safran’s share price experienced volatility over 2025, having been affected by the announcement of Trump’s tariffs, falling 18% in the first week of April. It has more than recovered, however, and is up 22% year to date, helped by resurgent European defence spending. After reporting strong Q1 results, Safran is now targeting the upper end of its full-year-guidance, excluding any potential impact of tariffs (which it is still trying to quantify).
Safran’s Q1 2025 results were the catalyst for its share price reversal (announced on the 25th of April), after surprising the market with better-than-expected revenues, up 17% YoY, with strong growth in its engine parts sales being a notable contributor. This growth comes on the back of what its management described as a landmark 2024, with the company having reported record-high revenues and profits.
NRG Energy
NRG Energy (nrg.com), a holding of Lyrical Asset Management, benefitted from a broader rebound in undervalued US equities. The Texas-headquartered power company has both renewable and non-renewable assets.
Figure 23: NRG Energy (USD)
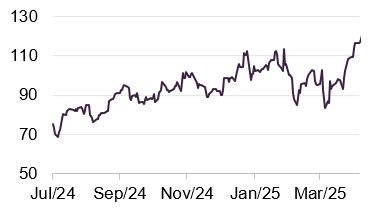
Source: Bloomberg
NRG delivered a strong performance in 2024, surpassing the upper end of market earnings estimates. Management expressed growing confidence in the company’s outlook, citing progress on its data centre strategy and the ongoing construction of three new gas-fired power plants as key drivers.
The company’s share price saw a further notable increase in May, following the release of its Q1 2025 results. These included continued growth in earnings per share, strong increases in net income and free cash flow, and the announcement of a strategic acquisition involving a portfolio of energy assets. As of the time of writing, NRG shares are up approximately 76% YTD.
Figure 24: Five largest stock detractors
| Sector | Country | Average active weight (%) | Total return (£ %) | Attribution effect | |
|---|---|---|---|---|---|
| NVIDIA Corporation | Information Technology | United States | (2.5) | 37.3 | (0.7) |
| Broadcom | Information Technology | United States | (1.2) | 55.3 | (0.5) |
| UnitedHealth Group Incorporated | Health Care | United States | 0.8 | (43.6) | (0.3) |
| Diageo | Consumer Staples | United Kingdom | 1.5 | (9.3) | (0.2) |
| PetroBras | Energy | Brazil | 0.3 | (12.8) | (0.2) |
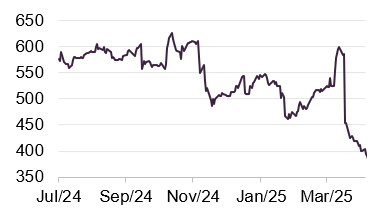
Figure 25: Diageo (GBP)
Source: Bloomberg
Two noteworthy detractors to ALW’s YTD performance have been Diageo and UnitedHealth.
Whilst Diageo’s share price has been on a downward trend for most of 2025, it saw more selling pressure in the first two weeks of February, falling approximately 11%. The catalyst for this was its half-year results, in which its management withdrew its mid-term guidance, amid concerns around the potential impact of tariffs on Mexican and Canadian imports. Its results also indicated a slight fall in revenue, with sales down 0.6% and operating profits down 4.9% for the six months to December 2024, further compounding market fears.
Figure 26: UnitedHealth (USD)
Source: Bloomberg
UnitedHealth saw a 44% fall in its shares over 2025, with its company undergoing significant sell pressure on 16 April following its release of a disappointing set of Q1 results, falling 22% on the day. Its management cut its profit forecast by c.12%, citing a greater than expected impact from ongoing Medicare funding reductions implemented by the Biden administration. The company experienced additional share price declines in May, as the company suspended its 2025 outlook coincident with CEO Andrew Witty stepping down. That was followed by a further 18% fall in its share price.
Compare ALW and its peer group on the QuotedData website
Peer group
ALW’s narrow discount versus that of most of its peers might be attributed to the effectiveness of its discount control mechanism (see page 25). Its yield is above the peer group median, and in line with the other multi-manager strategies.
ALW’s OCR sits in the middle of what is a competitive peer group. However, we have already seen a benefit of the merger with a reduction from 0.62% for former shareholders in Alliance Trust and 0.96% for former shareholders in Witan (both being the figures quoted in our previous note).
The merger has established the combined trust’s position as a heavyweight in the sector, now ranking as the third-largest by assets.
The fund ranks among the better-performing trusts over three- and five-year time periods.
Figure 27: ALW’s peer group comparison data as at 8 August 2025
| Discount(%) | Yield(%) | Ongoing charges (%) | Market cap(£m) | |
|---|---|---|---|---|
| Alliance Witan | (4.8) | 2.13 | 0.56 | 4,940 |
| AVI Global | (7.5) | 1.34 | 0.87 | 1,089 |
| Bankers | (10.1) | 2.25 | 0.51 | 1,257 |
| Brunner | (2.9) | 1.77 | 0.63 | 612 |
| F&C | (7.5) | 1.35 | 0.45 | 5,558 |
| Lindsell Train | (2.4) | 1.19 | 0.65 | 189 |
| Manchester & London | (13.1) | 5.01 | 0.8 | 168 |
| Franklin Global Trust | (13.7) | 1.52 | 0.47 | 352 |
| Mid Wynd | (2.0) | 1.05 | 0.6 | 289 |
| Monks | (8.3) | 0.04 | 0.44 | 2,486 |
| Scottish Mortgage | (9.5) | 0.41 | 0.31 | 12,291 |
| Peer group median | (7.5) | 14 | 0.56 | 1,089 |
| ALW rank | 4/13 | 3/13 | 6/13 | 3/13 |
Figure 28: Cumulative NAV total return performance over periods ending 31 July 2025
| 1 month(%) | 3 months(%) | 6 months(%) | 1 year(%) | 3 years(%) | 5 years(%) | |
|---|---|---|---|---|---|---|
| Alliance Witan | 4.0 | 11.5 | (1.6) | 6.7 | 38.0 | 77.9 |
| AVI Global | 5.8 | 12.0 | 5.9 | 8.7 | 39.6 | 98.8 |
| Bankers | 4.7 | 13.8 | 1.6 | 9.3 | 29.8 | 57.1 |
| Brunner | 3.4 | 9.5 | (0.5) | 6.2 | 35.1 | 89.1 |
| F&C | 4.1 | 11.4 | 0.1 | 12.2 | 39.3 | 85.2 |
| Lindsell Train | (2.8) | (1.7) | (6.0) | 0.6 | (0.4) | 9.1 |
| Manchester & London | 15.9 | 48.2 | 22.5 | 30.7 | 134.3 | 95.9 |
| Martin Currie Global Portfolio | 3.6 | 10.7 | (4.1) | (1.4) | 14.6 | 19.2 |
| Mid Wynd | 4.2 | 7.8 | (5.8) | (0.4) | 13.6 | 37.2 |
| Monks | 5.3 | 19.4 | 1.7 | 16.2 | 37.7 | 46.1 |
| Scottish Mortgage | 4.7 | 18.4 | 3.3 | 27.5 | 34.9 | 45.5 |
| Peer group mean | 4.8 | 14.6 | 1.6 | 10.6 | 37.9 | 60.1 |
| ALW rank | 8/11 | 6/11 | 8/11 | 7/11 | 4/11 | 5/11 |
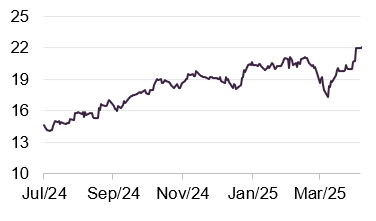
Dividend
Progressive annual dividend, paid quarterly, that has been substantially enhanced in recent years
For its 2024 financial year ALW paid a total dividend of 26.7p, equating to a 6% increase over 2023, meeting its stated aim at the time of the merger to bring its dividend payments in line with WTAN’s, and ensure that WTAN shareholders who remained invested continue to see a progressive dividend. As at 8 August 2025 ALW’s dividend yield is 2.1%.
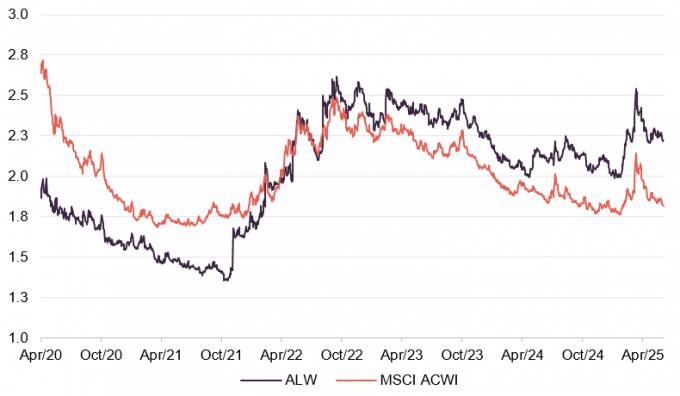
ALW (as Alliance Trust) underwent a change of its dividend policy in 2022, following the conversion of its merger reserve (resulting from historic corporate activity, principally the merger with second Alliance Trust in 2006) into a distributable reserve. With this additional flexibility, the board increased its dividend in the second half of 2022 and has continued to grow it from this higher base. As can be seen in Figure 28, since the implementation of its new dividend policy, ALW has been able to offer investors a yield above that provided by the global equity market.
Figure 29: Dividend yield of ALW versus MSCI ACWI
Source: Bloomberg
ALW ranks among the AIC’s dividend heroes, having recorded 58 consecutive years of dividend increases – the second-longest track record among investment trusts. With a distributable reserve of £3.7bn, including a £55.6m revenue reserve (as at 31 December 2024), the board states that it is well-positioned to maintain this progressive dividend policy. The board also offers investors a dividend reinvestment plan, administered by the registrar, which is designed to enable shareholders to increase their holdings in the trust in a cost-effective manner.
Figure 30: ALW dividend history
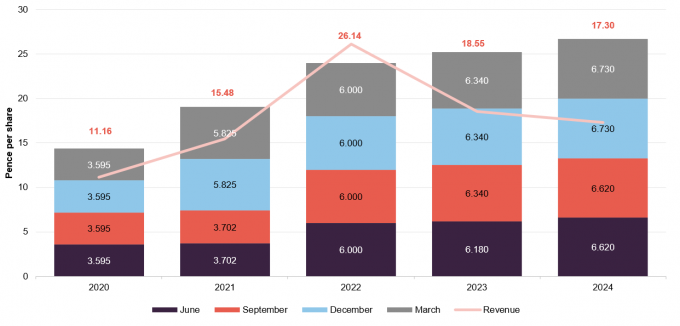
Source: Alliance Witan
Premium/(discount)
Figure 31: ALW discount over five years
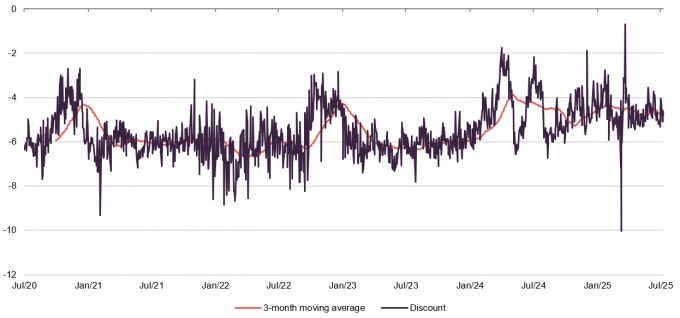
Source: Morningstar, Marten & Co
ALW targets a discount close to 5% in normal market circumstances
Over the 12 months ended 31 July 2025, ALW’s discount moved within a range of 10.0% to 0.7% and averaged 4.7%. As of 8 August 2025, ALW was trading at a 4.8% discount.
ALW’s board follows a policy aimed at maintaining a discount around the 5% level under normal market conditions. To achieve this, the trust deploys share buybacks when necessary. The success of this strategy is potentially evident in Figure 30, which shows that ALW has traded at a discount wider than 7% on only 67 days over the last five years. As can also be seen, ALW’s discount has become slightly more volatile over the last 12 months. This is potentially partly due to effects of the merger, due to sales by some holders of Witan, and also the inclusion of ALW in the FTSE 100, which may have increased exposure to index-driven trading activities. However, the volatility can also be attributed to market conditions, most notably the big spikes down and up in the aftermath of Liberation Day.
Share buybacks
Each year, the board asks shareholders for permission to buy back up to 14.99% of ALW’s issued ordinary share capital. Shares that are repurchased are held in treasury.
Whilst ALW’s tight discount has traditionally been attributed to the board’s judicious use of buybacks (see below), more recently, market demand has played a key role in keeping the discount stable. In 2024, the board significantly reduced its share repurchases, and this trend has continued into 2025.
Figure 32: ALW shares repurchased by month
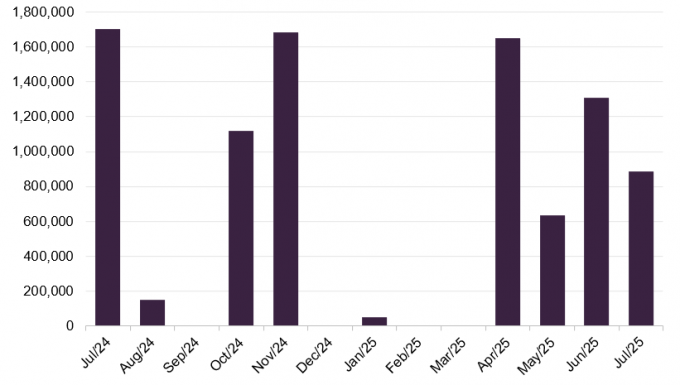
Source: Alliance Witan, Marten & Co
Structure
Fees and costs
The trust’s AIFM is Towers Watson Investment Management Limited (TWIM). As a result of the merger between ALW and Witan, TWIM entered into a new fee regime on 10 October 2024. The new base management fee schedule is as follows:
- 0.52% per annum on market capital that is less than or equal to £2.5bn;
- 0.49% per annum on market capital that exceeds £2.5bn but is less than or equal to £5.0bn; and
- 0.46% per annum on market capital that is in excess of £5.0 billion
Based on the new schedule, and ALW’s current market cap of £4.7bn, ALW has a current management fee of 0.51%. 75% of ALW’s management fee is charged to its capital account, and the remaining 25% to its revenue account. WTW agreed to waive £8.1m of management fees over 2024, as part of its contribution to the costs associated with the merger of the merger with Witan.
There was no performance fee element to ALW’s management agreement prior to the merger, and this continues to be the case. The management agreement is terminable by either party on the receipt of six months’ notice (or the trust may pay compensation in lieu of this).
ALW’s administrator is Juniper, which was appointed as company secretary on 31 December 2022. ALW reported total administrative expenses of £3.9m over 2024, up from the £2.9m in 2023.
Each of the underlying managers is entitled to a base management fee rate, generally based on a percentage of the value of assets under management. The fees to the underlying managers are not disclosed, but the manager has indicated that their fee rates are in line with what an institutional investor would pay for the service.
The trust’s ongoing charges ratio stood at 0.56% for the year ended 31 December 2024.
Capital structure and life
As at 31 July 2025, ALW had 394,439,982 shares in issue, of which 10,754,000 were held in treasury, and no other classes of share capital. The trust has an indefinite life.
Financial calendar
ALW’s financial year-end is 31 December. The most recent annual results were released in March, while interim results are typically released in July. The most recent AGM was held on 1 May 2024. ALW usually pays dividends in March, June, September, and December of each year.
Gearing
The board sets the strategic level of gearing. Currently, this is around 9% gross (6% net), but some flexibility is permitted. In practice, the level of gearing is driven by ALW’s view of market valuations, which is informed in part by the conversations it has with the underlying managers.
As a result of the merger, ALW’s borrowing facilities were increased by £50m, and £155m of fixed rate loans were novated (replaced with new terms) from Witan.
ALW has two multi-currency facilities provided by Scotiabank Europe Plc, worth £120m in total, and expiring in December 2025. It also has a £25m multi-currency facility in place with the Royal Bank of Scotland International, and a three-year term loan with £15m, both expiring in December 2026. ALW’s bank borrowings had a weighted average interest rate of 5.59% as of 31 December 2024.
ALW also operates with 10 fixed rate loan notes, issued in both sterling and euros with maturities ranging from 2029 to 2054. These loans had a total fair value of £299m as of 31 December 2024 (and par value of £373m) and a weighted average interest rate of 3.77%.
As of 31 December 2024, ALW had total debt facilities of £553m available to it, £433m of which was drawn. As of 30 May 2024, the company’s net gearing was 6.4%.
Shareholders
Figure 33: Major shareholders as at 31 July 2025
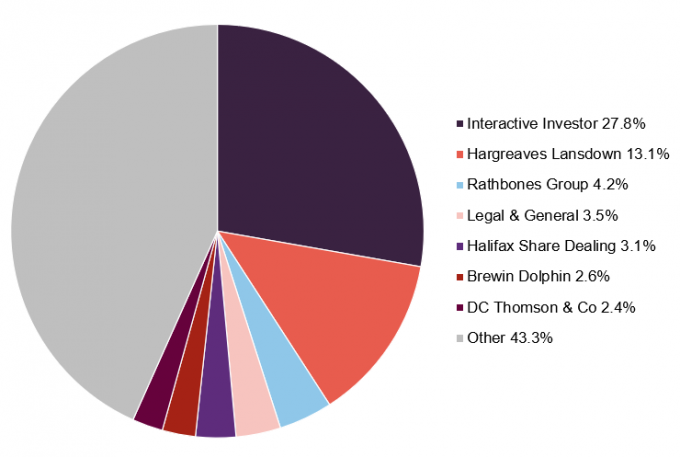
Source: Bloomberg
Board
Figure 34: Directors
| Director | Role | Date of appointment | Length of service (years) | Annual fee (£) | Shareholding 1 |
|---|---|---|---|---|---|
| Dean Buckley | Chair | 04/03/2021 | 4.4 | 80,000 | 30,000 |
| Andrew Ross2 | Deputy chair | 10/08/2024 | 1.0 | 60,000 | 67,385 |
| Sarah Bates | Senior independent director | 04/03/2021 | 4.4 | 45,300 | 55,014 |
| Jo Dixon | Audit and risk committee chair | 29/01/2020 | 5.5 | 49,000 | 6,500 |
| Rachel Beadgles2 | Director | 10/08/2024 | 1.0 | 41,000 | 26,033 |
| Shauna Bevan2 | Senior independent director | 10/08/2024 | 1.0 | 44,000 | 2,246 |
| Milyae Park | Director | 29/09/2022 | 2.8 | 41,000 | 5,100 |
The board consists of eight non-executive directors, all of whom are independent of the manager and who do not sit together on other boards. This has increased in number by one from the seven directors ALW had prior to the merger. Gregor Stewart, ALW’s previous chair, stepped down from the board on 1 January 2024 and was replaced by Dean Buckley. At ALW’s AGM in May, Clare Dobie and Jack Perry stepped down from the board. Vicky Hastings also stepped down at the end of July 2025.
Dean Buckley (chair)
Dean is a qualified actuary who has had an executive career in fund management. Previously, he was chief executive officer of Scottish Widows Investment Partnership, and prior to that, he held several positions at HSBC Bank Plc, most recently as chief executive officer of HSBC Asset Management UK & Middle East. Dean has also held senior fund management positions at Prudential Portfolio Managers and was previously a non-executive director of Saunderson House Limited.
Dean is currently chair of Fidelity Special Values Plc and is also an independent director for JPMorgan Emerging Markets Investment Trust Plc. He is also chair of Evelyn Partners Fund Solutions Limited and a non-executive director of Baillie Gifford and Company Limited.
Andrew Ross (deputy chair)
Andrew was previously the chair of Witan and joined ALW’s board as part of the merger.
Andrew was previously chief executive of Cazenove Capital Management which was acquired by Schroders in 2013. He was global head of wealth management there until 2019. Prior to this, he was chief executive of HSBC Asset Management (Europe) Limited and managing director of James Capel Investment Management. He has substantial experience in senior leadership roles as CEO and chairman of investment management and wealth management businesses, where he has overseen three different multi-manager businesses.
Andrew is currently a non-executive director for Polar Capital Holdings, and a non-executive director for Cadogan Settled Estates.
Jo Dixon (audit and risk committee chair)
Jo is a chartered accountant and has previously held senior positions within the NatWest Group and was finance director of Newcastle United Plc. She was commercial director, UK, Europe, and the Middle East at Serco Group and sat on various advisory boards in the education and charity sector.
Jo is also a senior independent director and chair of audit committee for Bellevue Healthcare Trust.
Sarah Bates (senior independent director)
Sarah is a Fellow of CFA UK and was previously chair of the Association of Investment Companies. She was also previously chair of Polar Capital Technology Trust Plc, Merian Global Investors Limited, St James’ Place Plc, JPMorgan American Investment Trust Plc, Witan Pacific Investment Trust Plc (now Baillie Gifford China Growth Trust Plc) and chair of the audit committees of New India Investment Trust Plc (now abrdn New India) of U and I Group Plc. Sarah was a founder of the Diversity Project and an Ambassador for Chapter Zero.
Sarah is an independent member of the investment committee and chair of BBC Pension Investment Limited. She is also the chair of USS Investment Management Limited.
Shauna Bevan (director)
Shauna joined ALW’s board on 10 October 2024 through the merger, having previously been a non-executive director of Witan. Shauna has over 25 years of investment experience working predominantly with retail clients. In her current role at RiverPeak, she is responsible for fund research and portfolio construction. She was previously co-head of collectives research and co-head of the collectives portfolio service at Charles Stanley, having started her career in wealth management at Merrill Lynch.
Shauna is also the head of investment advisory at RiverPeak Wealth, and is a non-executive director on the CT Global Managed Portfolio Trust Plc.
Milyae Park (director)
Milyae began her career as a chartered accountant in the US and holds an MBA from The Wharton School. She has held senior global executive positions spanning investment banking and other financial services, retail, consumer, and technology. Milyae has experience running and advising companies from FTSE 100 to start-up in scale in over 40 countries. In addition, her recent advisory experience has focused on digital transformation and growth, as well as ESG.
Milyae is also a non-executive director of Fidelity European Trust Plc, a non-executive director of THG Group Plc, and a non-executive director of Faber and Faber Limited.
Previous publications
Readers interested in further information about ALW may wish to read our previous notes (details are provided in Figure 36 below). You can read the notes by clicking on them in Figure 36 or by visiting our website.
| Title | Note type | Published |
|---|---|---|
| A trust for all seasons | Initiation | 25 November 2020 |
| The fruits of diversification | Update | 04 August 2021 |
| Stability in troubled waters | Update | 17 November 2022 |
| Coming into its own | Annual overview | 16 November 2023 |
| A new powerhouse | Update | 19 September 2024 |
IMPORTANT INFORMATION
Marten & Co (which is authorised and regulated by the Financial Conduct Authority) was paid to produce this note on Alliance Witan Plc.
This note is for information purposes only and is not intended to encourage the reader to deal in the security or securities mentioned within it. Marten & Co is not authorised to give advice to retail clients. The research does not have regard to the specific investment objectives financial situation and needs of any specific person who may receive it.
The analysts who prepared this note are not constrained from dealing ahead of it but, in practice, and in accordance with our internal code of good conduct, will refrain from doing so for the period from which they first obtained the information necessary to prepare the note until one month after the note’s publication. Nevertheless, they may have an interest in any of the securities mentioned within this note.
This note has been compiled from publicly available information. This note is not directed at any person in any jurisdiction where (by reason of that person’s nationality, residence or otherwise) the publication or availability of this note is prohibited.
Accuracy of Content: Whilst Marten & Co uses reasonable efforts to obtain information from sources which we believe to be reliable and to ensure that the information in this note is up to date and accurate, we make no representation or warranty that the information contained in this note is accurate, reliable or complete. The information contained in this note is provided by Marten & Co for personal use and information purposes generally. You are solely liable for any use you may make of this information. The information is inherently subject to change without notice and may become outdated. You, therefore, should verify any information obtained from this note before you use it.
No Advice: Nothing contained in this note constitutes or should be construed to constitute investment, legal, tax or other advice.
No Representation or Warranty: No representation, warranty or guarantee of any kind, express or implied is given by Marten & Co in respect of any information contained on this note.
Exclusion of Liability: To the fullest extent allowed by law, Marten & Co shall not be liable for any direct or indirect losses, damages, costs or expenses incurred or suffered by you arising out or in connection with the access to, use of or reliance on any information contained on this note. In no circumstance shall Marten & Co and its employees have any liability for consequential or special damages.
Governing Law and Jurisdiction: These terms and conditions and all matters connected with them, are governed by the laws of England and Wales and shall be subject to the exclusive jurisdiction of the English courts. If you access this note from outside the UK, you are responsible for ensuring compliance with any local laws relating to access.
No information contained in this note shall form the basis of, or be relied upon in connection with, any offer or commitment whatsoever in any jurisdiction.
Investment Performance Information: Please remember that past performance is not necessarily a guide to the future and that the value of shares and the income from them can go down as well as up. Exchange rates may also cause the value of underlying overseas investments to go down as well as up. Marten & Co may write on companies that use gearing in a number of forms that can increase volatility and, in some cases, to a complete loss of an investment.