
New managers, renewed focus
Geiger Counter (GCL) has emerged from a period of uncertainty following the departure of its long-standing portfolio managers, with its board electing to retain Manulife CQS under a new investment team and on improved terms. The appointment of Toronto-based managers Diana Racanelli and Craig Bethune provides continuity in GCL’s specialist uranium strategy, while a 27.9% reduction in the management fee is a tangible benefit for shareholders.
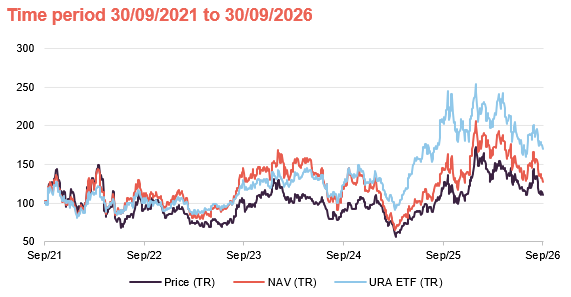
The management changes come against a challenging backdrop for uranium equities. Despite relatively resilient uranium prices and encouraging industry fundamentals, GCL’s NAV fell by 28.8% over the six months to September 2026, reflecting wider concerns over AI-related investment, financing costs and investor sentiment. Nevertheless, the longer-term investment case remains compelling. Growing nuclear power demand, driven by energy security, decarbonisation and rising electricity consumption, is expected to place increasing pressure on uranium supplies. GCL’s concentrated exposure to uranium producers and developers offers considerable upside if these trends materialise.
Capital growth from portfolio of uranium stocks
GCL aims to provide investors with capital growth by investing in a portfolio of securities of companies involved in the exploration, development and production of energy. Its main focus is the uranium sector, but up to 30% of assets can be invested in other resource-related companies.
Share Price and Discount
Performance over five years
| Year ended | Share price total return (%) | NAV total return (%) | Global X Uranium ETF total return (%) |
|---|---|---|---|
| 30/09/2022 | (8.0) | 1.2 | 0.8 |
| 30/09/2023 | 13.0 | 37.9 | 24.4 |
| 30/09/2024 | (12.5) | (16.2) | (1.8) |
| 30/09/2025 | 29.7 | 34.6 | 66.2 |
| 30/09/2026 | (6.8) | (19.8) | (16.9) |
Manager update
GCL has opted for continuity of management house following the departure of its long-standing portfolio managers Keith Watson and Rob Crayfourd earlier this year, but with a new investment team and improved terms for shareholders.
After Watson and Crayfourd resigned from Manulife CQS Investment Management in March 2026, GCL’s board served 12 months’ protective notice while it reviewed the company’s future management arrangements. Portfolio management was subsequently delegated to Manulife Investment Management in Toronto, with Diana Racanelli and Craig Bethune taking responsibility for the portfolio from May.
GCL has retained Manulife CQS following its management review
The board has now completed its review and concluded that remaining with Manulife CQS is in shareholders’ best interests. Racanelli will continue as lead portfolio manager, supported by Bethune and dedicated analyst Olivia Chamie. The team can also draw on Manulife’s wider global resources capabilities, comprising 24 investment professionals and managing around $1.7bn.
The decision means that each of the three investment companies previously managed by Watson and Crayfourd has ultimately taken a different path following their departure. City Natural Resources Growth and Income (CYN) followed the pair to Tufton Investment Management, while Golden Prospect Precious Metals (GPM) appointed Baker Steel. GCL, by contrast, has elected to remain with Manulife CQS.
A 27.9% reduction in its annual management fee has been secure
Importantly, the review has also secured improved commercial terms. From 1 October, GCL’s annual management fee has been reduced from 1.3875% to 1% of net assets, equivalent to a 27.9% reduction. Manulife CQS has also agreed an increased marketing budget and will contribute towards the costs incurred by GCL in carrying out the management review.
The revised investment management agreement remains terminable by either party on 12 months’ notice, but the board has secured additional termination rights in the event of a key-person or change-of-control event at Manulife CQS.
The new managers – continuity of approach
The conclusion of the review removes an important source of uncertainty that has hung over GCL since March. It also provides greater clarity over how the portfolio is likely to develop under Racanelli and Bethune.
Both are experienced natural resources investors. Racanelli has spent almost four decades investing in mining equities, while Bethune specialises in energy. The pair have worked together for around 20 years and can draw on Manulife’s wider natural resources and asset allocation teams.
New managers favour smaller uranium companies offering greater leverage to rising prices
Their management of the portfolio so far suggests considerable continuity with the approach pursued by Watson and Crayfourd. Racanelli and Bethune favour small- and mid-cap uranium companies, which they believe can provide greater leverage to rising uranium prices than larger, more diversified businesses. Many of GCL’s existing holdings are also companies that they already know through other Manulife portfolios.
New managers may reduce portfolio concentration to manage risk …
There may, nevertheless, be changes in how risk is managed. One area the managers have identified for attention is portfolio concentration. At the end of September, GCL’s five largest positions represented just over 68% of the portfolio, with NexGen Energy alone accounting for 23.7%. The managers have indicated that they may reduce some of the larger positions as opportunities emerge elsewhere.
This does not reflect any change in their positive view of NexGen, which they also hold in other Manulife portfolios. Racanelli and Bethune have highlighted the quality and scale of its Rook I project in Canada’s Athabasca Basin and the potential leverage available as the project advances towards production. Rather, they argue that reducing the position would lower the portfolio risk associated with such a large exposure to an individual development-stage company.
In the announcement of the conclusion to the board’s review, it explicitly confirmed that there will be no change to GCL’s investment objective and that the portfolio will remain focused on companies involved in the exploration, development and production of uranium to supply the nuclear power industry. The existing balance between producers and developers is likely to remain an important feature of the portfolio.
… and gearing levels
The managers have indicated that gearing could be reduced as part of their efforts to manage portfolio risk (at the end of September it was 13.9%). Some gearing will be retained where they see attractive opportunities, particularly if the expected increase in utility contracting materialises (detailed below).
Overall, the change in investment team looks likely to result in an evolution in portfolio construction rather than a fundamental change in what GCL is designed to provide.
With the management question now settled and GCL’s uranium-focused mandate reaffirmed, the outlook for the uranium market itself returns to the fore.
Uranium market outlook
Uranium equities have experienced considerable volatility despite resilient uranium prices
The fundamental backdrop has continued to strengthen, but this has still not been reflected in the performance of uranium equities. This was shown up in GCL’s NAV performance over recent months, which fell 14.0% in June and a further 9.3% in July, broadly in line with uranium-focused ETFs, rebounding 18.8% in August and outperforming the wider sector, before retreating 18.5% in September.
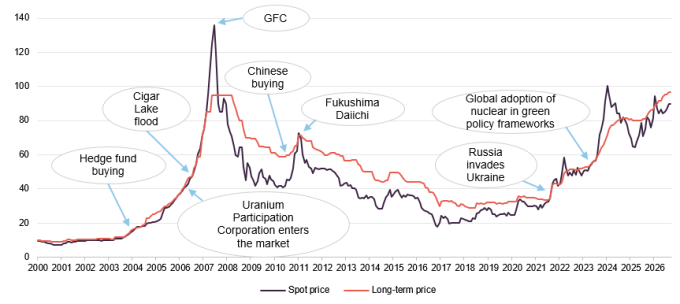
The underlying uranium price has been considerably more resilient. Spot uranium ended June at $85.50/lb, increased to $86.60/lb in July and rose to $89.35/lb in August. The managers point to elevated long-term contract prices, sovereign buying and signs of accelerating utility contracting as evidence of continued tightness in the market and a supportive medium-term price outlook.
Wider concerns around AI investment and financing costs have impacted uranium equities
Some of the earlier weakness in uranium equities could be attributed to wider market sentiment rather than a deterioration in uranium fundamentals. Uranium companies have become increasingly associated with the AI and power-demand theme and concerns over the scale and financing of hyperscalers’ capital expenditure spilled over into nuclear-related equities earlier in the summer. Higher interest rates have added to these concerns, particularly for development-stage companies that will ultimately require substantial capital to bring new mines into production.
The sharp rebound in August provided a reminder of the leverage that uranium equities can offer when sentiment improves alongside supportive fundamentals. For GCL, it also highlights the balance in its portfolio between producers and developers. The former provides exposure to current uranium prices and contracted revenues, while developers with substantial uncontracted future production can offer greater leverage to rising long-term uranium prices.
Figure 1: Spot uranium price 2000 – 2026 (US$/lb U3O8)
Contracting becoming increasingly important
Developments in the long-term contracting market are arguably more important to the investment case than movements in the relatively thin spot market. Utilities secure much of their uranium through multi-year contracts and, following a period in which some delayed contracting in anticipation of additional supply becoming available, the managers are now seeing signs of activity accelerating.
This is particularly important for the development-stage companies that feature prominently in GCL’s portfolio. Higher long-term contract prices can improve the economics of projects and provide greater confidence to commit capital to their development, while companies with uncontracted future production retain greater exposure to further increases in prices.
Security of supply is also becoming an increasingly important consideration. The uranium market has been shaped by years of underinvestment following the Fukushima disaster in 2011, while geopolitical tensions have increased the emphasis placed on secure domestic or allied sources of nuclear fuel. This creates an incentive for utilities to contract future supply rather than relying on material new production becoming available at lower prices.
A widening longer-term supply gap
Primary mine production is currently insufficient to meet reactor requirements, with the shortfall supplemented by secondary sources. Additional production should come online over the remainder of the decade, including from Canada, the US and Namibia, and could temporarily improve the market balance around the beginning of the 2030s.
New uranium production could temporarily ease supply pressures, but Stifel forecasts a widening deficit from the mid-2030s
This dynamic is illustrated in Stifel’s forecasts, shown in Figure 2. Stifel’s forecasts suggest that new mine production could narrow the uranium supply deficit over the remainder of this decade, potentially resulting in a modest surplus in the early 2030s. However, this improvement is expected to be short-lived. As reactor demand continues to increase and existing production declines, the market is forecast to return to deficit from the middle of the 2030s, with the implied shortfall exceeding 100m lbs of U3O8 by the end of the decade.
Figure 2: Uranium demand and implied supply surplus/(deficit)
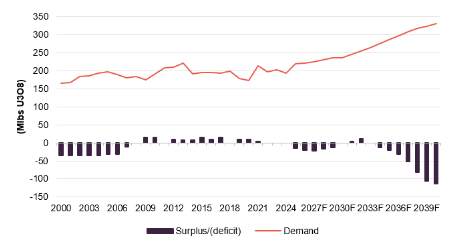
There is considerable execution risk involved in bringing sufficient new supply online. Uranium mines can take many years to move from discovery through permitting, financing and construction to production, while projects face geological, labour, equipment and supply-chain constraints. Delays could therefore quickly eliminate the relatively brief period of improved supply-demand balance currently forecast.
Canada’s Athabasca Basin is expected to be an important source of new production and is particularly relevant to GCL given its substantial exposure to the region. Denison Mines’ Phoenix project moved into full-scale construction in July, while NexGen Energy’s Rook I followed in August. Phoenix is targeting production from 2028, while Rook I is expected to enter production around 2030. GCL also has exposure to nearer-term production and ramp-ups through companies including Paladin Energy and UR-Energy.
Nuclear build-out gathers pace
Energy security, decarbonisation and rising electricity demand are driving nuclear investment, with 75 reactors under construction globally as at April 2026
The other side of the equation is rising uranium demand. Government support for nuclear power has increased across a growing number of countries, reflecting a combination of energy security, decarbonisation and rising electricity requirements.
China remains at the forefront of this expansion, having approved at least 10 reactors annually since 2022. As at April 2026, 75 reactors were under construction globally, with another 124 planned and 305 proposed.
Figure 3: Global nuclear reactor pipeline
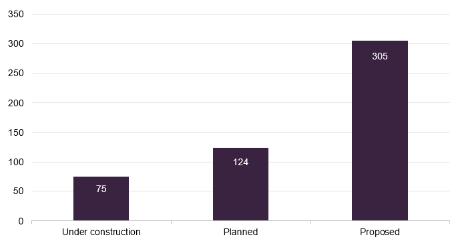
The policy backdrop has continued to develop. China has pushed ahead with its nuclear build-out, India has advanced proposals intended to open its nuclear sector to limited private investment, while the US is supporting both conventional reactors and the development of smaller-scale nuclear generation.
Rising electricity consumption provides another potential source of demand. AI and data centres have become increasingly prominent within this argument. Nuclear’s ability to provide continuous baseload power makes it well suited to a more electricity-intensive economy, but long construction periods mean much of the immediate increase in power demand will have to be met from other sources.
Over the longer term, however, greater electrification, expansion of data centres and the desire for reliable low-carbon power all potentially strengthen the case for additional nuclear generation.
GCL’s portfolio is weighted towards companies whose value depends not only on today’s uranium price but on the economics of future production. Developers with large uncontracted resources could benefit disproportionately from higher long-term prices, while progress through permitting, financing and construction can provide additional catalysts as projects are de-risked.
The arrival of new supply over the remainder of this decade means the uranium market may not tighten in a straight line. But the longer-term challenge remains whether sufficient new production can be brought online quickly enough to meet rising reactor requirements. It is that prospective imbalance that sits at the heart of GCL’s investment case.
Asset allocation
GCL’s portfolio is highly concentrated with inherently low turnover
GCL’s portfolio is highly concentrated, with the top five holdings accounting for 68.4% of the fund (see Figure 6). Figures 4 and 5 show that the portfolio’s geographical allocation is focused on companies in North America. Typically, around a half of GCL’s portfolio is invested in safer assets; that is, producers or companies backed by physical uranium. Pure exploration plays represent a more limited exposure within the fund.
Figure 4: GCL portfolio split by geography1
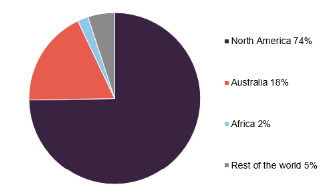
Figure 5: GCL portfolio split by sector1
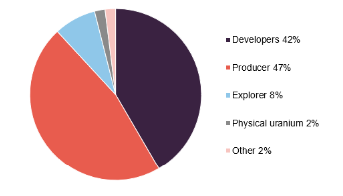
GCL has exposure to physically-backed uranium entities through its holding in Sprott Uranium Trust (4.1% at 31 March 2026) and Yellow Cake (1.1%). However, in comparison to alternatives such as the URA exchange traded fund (ETF), GCL is underweight Cameco and Kazatomprom.
Top five holdings
Figure 6 shows GCL’s top five holdings at 30 September 2026 and how these have changed over six months. The portfolio is focused on names that the managers believe will benefit from an increase in the uranium price, and the anticipated increase in Western reactor contracting.
Figure 6: Top five holdings as at 30 September 2026
| Holding | Stage | Country | Allocation 30 Sept 2026 (%) | Allocation 31 Mar 2026 (%) | Percentage point change |
|---|---|---|---|---|---|
| NexGen Energy | Construction | Canada | 23.7 | 23.9 | (0.2) |
| Paladin Energy | Uranium mining | Australia | 16.9 | 15.5 | 1.4 |
| UR-Energy | Uranium mining | US | 13.9 | 14.6 | (0.7) |
| Cameco | Uranium mining | Canada | 7.4 | 7.1 | 0.3 |
| Denison Mines | Construction | Canada | 6.5 | 6.8 | (0.3) |
| Total of top five | 68.4 |
NexGen Energy (23.7%)
Figure 7: NexGen Energy share price (CAD)
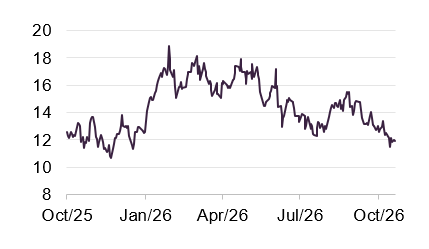
NexGen Energy (www.nexgenenergy.ca) remains GCL’s largest holding, accounting for 23.7% of gross assets at the end of September 2026. The company reached a significant milestone in March when it secured final regulatory approval for its Rook I uranium project in northern Saskatchewan, Canada. Construction activities commenced in June, followed by the official groundbreaking in August, marking the transition from a lengthy permitting process to full-scale development.
Rook I is one of the world’s largest and most advanced uranium development projects. Centred on the high-grade Arrow deposit, the mine is expected to produce up to 30 million lbs of U3O8 annually, with a construction period of around four years and first production targeted around 2030. NexGen has strengthened its financial position through substantial equity fundraising, including a C$950m offering completed in October 2025, while continuing to advance uranium sales agreements with major utilities.
The project remains largely uncontracted, providing considerable exposure to future uranium prices. NexGen has secured agreements covering 10 million lbs of future production, but retains substantial uncontracted reserves, with sales contracts incorporating market-related pricing mechanisms. GCL’s managers have highlighted the potential benefits of this exposure as long-term uranium contract prices rise, alongside the value created as major development projects move towards production.
Paladin Energy (16.9%)
Figure 8: Paladin Energy share price (AUD)
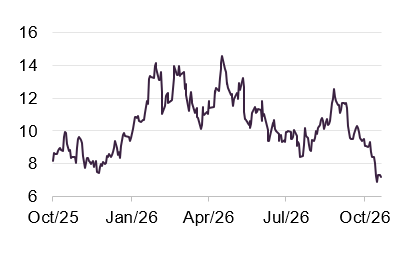
Paladin Energy (www.paladinenergy.com.au) is an Australian-based uranium producer and GCL’s second-largest holding, accounting for 16.9% of gross assets at the end of September 2026. Its principal operating asset is the Langer Heinrich Mine in Namibia, in which it holds a 75% interest. The mine completed its operational ramp-up in June 2026, having restarted production in 2024, although its latest quarterly results highlighted some continuing operational challenges.
Langer Heinrich produced 1.00 million lbs of U3O8 in the September quarter, down from 1.23 million lbs in the preceding three months, reflecting a planned maintenance shutdown and lower processing recoveries associated with the mining sequence. Production costs increased from $51.6/lb to $61.6/lb, although the average realised selling price rose from $70.6/lb to $79.4/lb, benefiting from higher uranium prices and a greater proportion of market-linked sales. Paladin expects production to improve as mining progresses into higher-grade ore, particularly during the second half of FY2027. It has maintained full-year production guidance of 5.1 million to 5.6 million lbs, alongside a targeted production cost of $44–48/lb.
Paladin also offers substantial development potential through its wholly-owned Patterson Lake South (PLS) project in Saskatchewan, Canada, acquired through its takeover of Fission Uranium in 2024. The project received provincial environmental approval in February 2026 and has since progressed through further regulatory milestones. An agreement with the Canadian Nuclear Safety Commission establishes a pathway targeting construction licence hearings by the end of 2027, while a new benefits agreement with the Birch Narrows Dene Nation represents further progress in securing Indigenous support. Exploration drilling has also extended mineralisation at the emerging Atlas and Saloon East discoveries, highlighting the potential for further resource growth. PLS is expected to produce around 9 million lbs of U3O8 annually once developed, potentially establishing Paladin as a significant producer across two major uranium jurisdictions.
Ur-Energy (13.9%)
Figure 9: Ur-Energy share price (CAD)
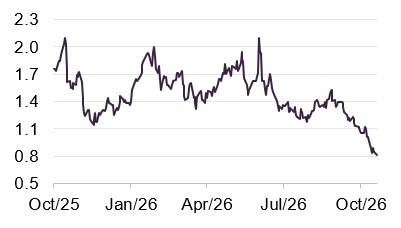
Ur-Energy (www.ur-energy.com/), a longstanding GCL holding, is a US-focused uranium producer operating low-cost in-situ recovery (ISR) assets in Wyoming. The company has made significant progress in expanding its operations during 2026, with its second mine, Shirley Basin, commencing production in April and making its first shipment of uranium to the company’s Lost Creek processing facility in August. This marked Ur-Energy’s transition to a two-mine producer, with combined licensed annual production and processing capacity of 4.2 million lbs of U3O8.
At Lost Creek, production has continued to increase as the company works towards higher operating rates. Uranium processed and packaged during the second quarter of 2026 rose 47% to around 141,000 lbs, the highest quarterly output since the restart of its production ramp-up in 2022. However, operational challenges, including restrictions on processing flows caused by fine particles from the ore-bearing formation, have slowed progress. Ur-Energy has introduced additional filtration equipment and is constructing a wastewater treatment facility, expected to be operational in early 2027, to support further production growth.
Shirley Basin, meanwhile, has been developed as a satellite operation, with uranium transported to Lost Creek for final processing. This approach reduces the need for duplicate infrastructure and should improve capital efficiency as production increases. The company has also strengthened its financial position through a $120m convertible bond issue in December 2025, providing funding to support its expansion plans. With two operating mines and further development opportunities in Wyoming, Ur-Energy offers GCL exposure to growing domestic US uranium production at a time when energy security and the development of domestic nuclear fuel supply chains have become increasingly important policy priorities.
Cameco (7.4%)
Figure 10: Cameco share price (CAD)
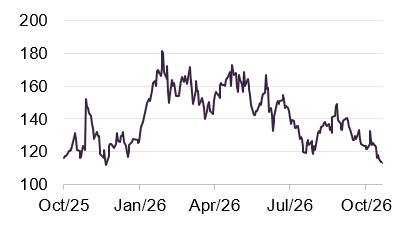
Cameco (www.cameco.com), one of the world’s largest publicly traded uranium companies, has historically been a significant underweight position for GCL relative to the Global X Uranium ETF, which had a 23.3% exposure at 20 October. Cameco accounted for 7.8% of GCL’s gross assets at the end of August 2026, reflecting the managers’ preference for smaller producers and developers offering greater exposure to rising uranium prices.
The underweight position largely reflects Cameco’s extensive long-term contracting arrangements. At 30 June 2026, the company had commitments to deliver an average of approximately 28 million lbs of U3O8 annually between 2026 and 2030, with higher volumes contracted in the earlier years. Whilst these agreements provide revenue visibility and protect against weaker uranium prices, they also moderate Cameco’s exposure to further price increases, as shown in Figure 11.
Figure 11: Cameco’s expected uranium price sensitivity under various spot price assumptions
| $60/lb | $80/lb | $100/lb | $120/lb | $140/lb | |
|---|---|---|---|---|---|
| 2026 | 62 | 66 | 67 | 68 | 69 |
| 2027 | 58 | 69 | 74 | 76 | 78 |
| 2028 | 60 | 72 | 80 | 84 | 89 |
| 2029 | 62 | 75 | 85 | 91 | 96 |
| 2030 | 63 | 76 | 88 | 94 | 100 |
Cameco nevertheless remains an important holding given the quality and scale of its assets. Its operations include Cigar Lake and McArthur River/Key Lake in Canada’s Athabasca Basin, among the world’s highest-grade uranium deposits, alongside interests in Kazakhstan. The company expects attributable uranium production of between 19.5 million and 21.5 million lbs in 2026. It also has a substantial presence across the wider nuclear fuel cycle through its fuel services operations and 49% interest in Westinghouse, providing exposure to nuclear reactor technology, servicing and new-build activity.
Denison Mines (6.5%)
Figure 12: Denison share price (CAD)
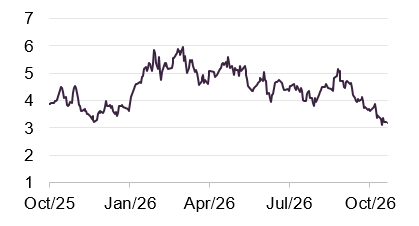
Denison Mines (www.denisonmines.com) is a Canadian uranium exploration and development company whose flagship Phoenix project, in Saskatchewan’s Athabasca Basin, has made significant progress during 2026. Following receipt of final regulatory approval in February, the site transitioned to full-scale construction in July. The development, which will use in-situ recovery (ISR) technology, is expected to take approximately two years to construct, with first production targeted for mid-2028. This would make Phoenix one of the few sizeable new sources of uranium supply expected to enter production before the end of the decade.
The project has an estimated initial construction cost of C$600m, following an upward revision announced in January 2026 to reflect inflation, design refinements and updated procurement costs. Despite the increase, Denison maintains that the project’s economics remain attractive, supported by stronger long-term uranium prices. The company has also been using proceeds from sales of its physical uranium holdings to help fund construction, generating C$91.6m from the sale of 750,000 lbs of U3O8 during the second quarter.
Phoenix forms part of Denison’s wider Wheeler River project, in which it holds an effective 95% interest. The project also includes the high-grade Gryphon deposit, which provides a potential second phase of development. Denison’s broader portfolio includes interests in the McClean Lake uranium operations and Waterbury Lake, giving it additional exposure to production and development opportunities across the Athabasca Basin.
Performance
Having more than doubled over the 12 months to 31 March 2026, GCL’s NAV fell almost 30% over the next six months to the end of September. Uranium equities have experienced considerable volatility in recent months, despite a generally supportive fundamental backdrop. Uranium has become increasingly associated with the AI and power-demand theme and so when technology shares weakened over the summer on concerns about the ability of major tech companies to finance the substantial infrastructure investment required to support AI growth, selling spread to nuclear-related investments.
Higher interest rates and crowded positioning in nuclear-related investments have added to the volatility. This volatility suggests that investor sentiment remains an important driver of short-term performance, even as long-term uranium contracting, government support for nuclear power, and the outlook for future supply all remain encouraging.
Figure 13: GCL share price and NAV versus the Global X Uranium ETF – rebased to 100 over five years to 30 September 2026
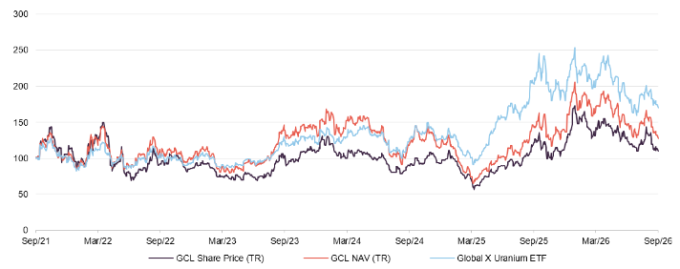
Figure 14: Cumulative total return performance over periods ending 30 September 2026
| 1 month (%) | 3 months(%) | 6 months (%) | 1 year (%) | 3 years(%) | 5 years(%) | 10 years(%) | |
|---|---|---|---|---|---|---|---|
| GCL NAV | (18.5) | (13.6) | (28.8) | (19.8) | (9.5) | 26.4 | 177.2 |
| GCL share price | (18.3) | (14.1) | (16.0) | (6.8) | 5.8 | 10.0 | 233.3 |
| Cameco | (11.5) | (17.1) | (16.3) | 2.5 | 100.7 | 306.1 | 893.0 |
| Global X Uranium ETF | (10.8) | (9.0) | (14.5) | (16.9) | 35.6 | 70.0 | 198.8 |
| Peer group average NAV1 | (7.4) | 7.8 | (4.4) | 24.0 | 99.9 | 110.6 | 258.0 |
| Peer group average share price1 | (6.8) | 7.1 | 6.1 | 36.2 | 143.8 | 123.5 | 323.4 |
Peer group
Click here for a live comparison of the commodities and natural resources peer group
GCL is a member of the AIC’s sector specialist commodities and natural resources sector, which is comprised of eight members. We have excluded two of these from our peer group analysis – Global Resources Investment Trust (GRIT) on size grounds and Riverstone Energy, which is in a managed wind-down process.
None of the funds used are perfect comparators, with GCL being the only fund that invests in listed uranium equities. We have added Yellow Cake Plc (YCA) to the peer group, which is focused on uranium, but invests in physical uranium and offers direct exposure to the uranium price.
Figure 15: Peer group cumulative NAV total return performance to 30 September 2026
| 1 month (%) | 3 months(%) | 6 months (%) | 1 year (%) | 3 years(%) | 5 years(%) | 10 years(%) | |
|---|---|---|---|---|---|---|---|
| GCL | (18.5) | (13.6) | (28.8) | (19.8) | (9.5) | 26.4 | 177.2 |
| Yellow Cake1 | 0.0 | 1.3 | 1.4 | 5.9 | 16.7 | 96.9 | – |
| Baker Steel Resources | (4.6) | 9.0 | (0.9) | 54.9 | 160.0 | 77.7 | 313.4 |
| BlackRock Energy & Res | (5.6) | 16.3 | (5.6) | 29.0 | 55.4 | 119.5 | 264.4 |
| BlackRock World Mining | (9.2) | 6.9 | 2.6 | 41.7 | 82.4 | 123.8 | 349.7 |
| City Natural Resources | (5.3) | 15.7 | (1.7) | 42.0 | 116.7 | 174.7 | 330.8 |
| Golden Prospect | (8.4) | 18.8 | 2.4 | 14.3 | 277.5 | 155.5 | 112.6 |
| GCL rank | 7/7 | 7/7 | 7/7 | 7/7 | 7/7 | 7/7 | 5/6 |
| Sector arithmetic avg. | (7.4) | 7.8 | (4.4) | 24.0 | 99.9 | 110.6 | 258.0 |
Figures 15 and 16 show the impact of recent volatility in the share prices of uranium equities on GCL’s performance; although, as mentioned, it is far from a perfect peer group comparison with specialist funds focused on other commodity/mining sectors. The underlying uranium price has remained relatively stable and so YCA has avoided much of the volatility seen with the uranium producers and developers. However, that exposure to mining equities can equally provide greater upside when uranium prices strengthen and investor sentiment improves.
Figure 16: Peer group cumulative share price total return performance to 30 September 2026
| 1 month (%) | 3 months(%) | 6 months (%) | 1 year (%) | 3 years(%) | 5 years(%) | 10 years(%) | |
|---|---|---|---|---|---|---|---|
| GCL | (18.3) | (14.1) | (16.0) | (6.8) | 5.8 | 10.0 | 233.3 |
| Yellow Cake | (7.3) | 2.9 | (9.1) | (4.9) | (3.1) | 65.9 | – |
| Baker Steel Resources | (0.7) | 9.4 | 18.1 | 106.6 | 297.7 | 66.7 | 391.2 |
| BlackRock Energy & Res | (4.8) | 0.6 | (5.1) | 34.1 | 68.9 | 129.9 | 265.6 |
| BlackRock World Mining | (8.6) | 7.6 | 10.6 | 45.7 | 86.6 | 138.4 | 433.4 |
| City Natural Resources | (5.3) | 21.5 | 14.4 | 46.6 | 168.2 | 271.6 | 481.5 |
| Golden Prospect | (2.8) | 21.7 | 29.5 | 31.8 | 382.8 | 181.9 | 135.1 |
| GCL rank | 7/7 | 7/7 | 7/7 | 7/7 | 6/7 | 7/7 | 5/6 |
| Sector arithmetic avg. | (6.8) | 7.1 | 6.1 | 36.2 | 143.8 | 123.5 | 323.4 |
Figure 17 shows that GCL’s ongoing charges ratio ranks towards the bottom end of its peer group, reflecting its relatively small size. This does not reflect the reduction in the management fee. GCL’s net gearing is the highest in the peer group, meaning that it will benefit if uranium performs well, but suffer disproportionately if not. As mentioned, the new managers plan to reduce gearing to manage portfolio risk.
Of the two uranium funds, GCL is the more expensive, but it has a much longer track record.
Figure 17: Peer group comparison – size, fees, discount, yield and gearing at 20 October 2026
| Market cap (£m) | 1-yr Standard deviation | Ongoing charges (%)1 | Perf. fee | Premium/ (discount) (%) | Dividend yield (%) | Net gearing (%)3 | |
|---|---|---|---|---|---|---|---|
| GCL | 55 | 55.4 | 2.11 | No | (5.4) | Nil | 13.1 |
| Yellow Cake | 1,309 | n/a | 1.01 | No | (16.4)2 | Nil | (8.3) |
| Baker Steel Resources | 126 | 32.1 | 2.37 | Yes | (30.4) | Nil | (4.5) |
| BlackRock Energy & Resources | 173 | 22.3 | 1.15 | No | (2.2) | 3.8 | 8.8 |
| BlackRock World Mining | 1,680 | 37.9 | 1.05 | No | (3.3) | 2.5 | 8.1 |
| City Natural Resources | 157 | 40.7 | 2.00 | No | 2.6 | 8.1 | 1.8 |
| Golden Prospect | 83 | 49.7 | 1.99 | No | (4.1) | 5.9 | (2.1) |
| GCL rank | 7/7 | 6/6 | 6/7 | 3/7 | 5/7 | 7/7 | |
| Sector arithmetic avg. | 511.9 | 39.7 | 1.67 | (7.1) | 2.9 | 2.3 |
Premium/(discount)
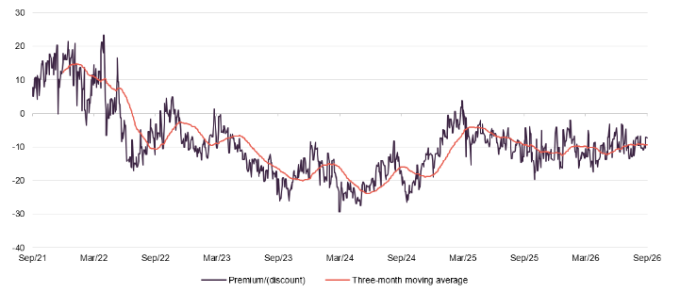
GCL’s average discount over 12 months is 10.4%
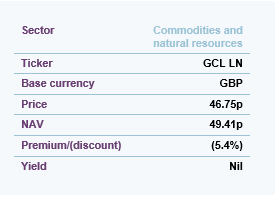
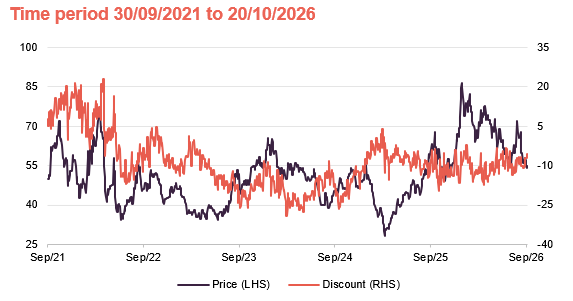
Over the last year, GCL has traded at an average discount of 10.4% (with a range of 2.1% to 19.8%). This is at the cheaper end of its trading range over five years (8.8% average discount). On 20 October 2026 its discount was 5.4%.
Figure 18: GCL premium/(discount) over five years
Fund profile
Further information can be found at: ncim.co.uk/geiger-counter-ltd
GCL aims to provide investors with attractive returns, primarily in the form of capital growth, by investing in a portfolio of securities of companies involved in the exploration, development and production of energy and related service companies. Its main focus is uranium, but to allow diversification beyond this highly concentrated sector, up to 30% of assets can be invested in other resource-related companies.
GCL does not have a formal benchmark and is not managed with the aim of providing outperformance relative to an index. Instead, the portfolio is managed with a more absolute return mindset, with the managers selecting securities that they believe will provide the best risk-adjusted returns over the longer term. Although the managers consider uranium a beneficiary of long-term structural growth drivers, the portfolio is focused on securities that the managers believe are undervalued. The expectation is that such securities will re-rate over time, and therefore provide the scope for capital appreciation beyond what the market expects.
GCL has a global remit, but its portfolio tends to be biased towards North American- and Australian-listed equities. The portfolio is predominantly invested in equities, but it is not restricted to these and can also invest in convertible securities, fixed-income securities and warrants.
Investment manager
New City Investment Managers (NCIM) has been GCL’s investment manager since its launch in July 2006. On 1 October 2007, NCIM joined the CQS Group, a global diversified asset manager running multiple strategies. In November 2023, CQS was acquired by Manulife Investment Management. As mentioned earlier, portfolio management has been sub-delegated to Manulife Investment Management’s Toronto-based team, led by Diana Racanelli and supported by Craig Bethune and analyst Olivia Chamie. The revised management agreement also reduced the annual management fee from 1.3875% to 1.00% of NAV, alongside enhanced termination protections and increased marketing support.
No formal benchmark index
This note includes comparisons against the Global X Uranium ETF
Reflecting both its specialist investment proposition and a relatively small universe, GCL does not have a formal benchmark. The Global X Uranium ETF (URA) has been used as a comparator in this note. This is a large (net assets of around US$4.92bn) and liquid ETF that provides investors with access to a broad range of companies involved in uranium mining and the production of nuclear components (this includes companies involved in extraction, refining, exploration, or manufacturing of equipment for the uranium and nuclear industries). Its objective is to provide investment results that correspond generally to the price and yield performance (before fees and expenses) of the Solactive Global Uranium & Nuclear Components Total Return Index.
Previous publications
You can read previous GCL notes by clicking on the links below.
Figure 19: QuotedData’s previously published notes on GCL
| Title | Note type | |
|---|---|---|
| Nuclear exposure | Initiation | 20 March 2019 |
| Supply deficit unsustainable | Update | 21 November 2019 |
| Hot stuff | Annual overview | 6 August 2020 |
| Explosive performance | Update | 21 October 2021 |
| Powered up for growth | Annual overview | 29 November 2023 |
| Dawn of a new era for uranium | Update | 5 September 2024 |
| Enriched prospects | Annual overview | 9 July 2025 |
| Mining bottleneck fuels uranium upside | Update | 27 April 2026 |
SWOT analysis
| Strengths | Weaknesses |
|---|---|
| Specialist exposure to uranium producers and developers, with significant leverage to rising long-term uranium prices | Concentrated portfolio creates significant stock-specific and development risk |
| Experienced new portfolio management team, supported by Manulife’s global resources platform | Medium-term returns have lagged peers and uranium ETFs |
| Reduced management fee improves cost competitiveness | Relatively small asset base limits economies of scale |
| Opportunities | Threats |
| Forecast widening uranium supply deficit from the mid-2030s could support higher long-term prices | Mine development delays, cost overruns and financing requirements could undermine project economics |
| Growing nuclear investment driven by energy security, decarbonisation and electricity demand | Uranium equities remain vulnerable to wider market sentiment and reversals in the AI/power investment theme |
| Progress towards production at major portfolio holdings could unlock value as projects are de-risked | New uranium supply could temporarily ease market tightness, limiting near-term price upside |
Bull vs bear case
| Aspect | Bull case | Bear case |
|---|---|---|
| Performance | Uranium equities recover from recent weakness, with GCL’s exposure to smaller producers and developers delivering superior returns | Uranium equities continue to lag the physical commodity, with stock-specific setbacks and concentration weighing on performance |
| Dividends | GCL is explicitly capital-growth-focused. It has never paid a dividend and has never expressed any intention of doing so | Investors should not consider investing in GCL if they require income from their investment |
| Discount | Improved performance, lower fees and increased marketing support attract investors and narrow the discount to NAV | Continued volatility and weak investor demand cause the discount to persist or widen |
| Outlook | Growing nuclear demand, driven by energy security, decarbonisation and rising electricity consumption, outpaces new uranium supply, supporting higher long-term prices and uranium equities | Slower nuclear expansion and increased mine production ease the projected supply deficit, limiting uranium price upside and weighing on mining equities |
IMPORTANT INFORMATION
This marketing communication has been prepared for Geiger Counter Limited by Marten & Co, which is authorised and regulated by the Financial Conduct Authority (FCA). It constitutes non-independent research as defined under the UK MiFID II regime and the onshored Commission Delegated Regulation (EU) 2017/565.This communication is intended for use by investment professionals as defined in Article 19(5) of the Financial Services and Markets Act 2000 (Financial Promotion) Order 2005.Marten & Co is not authorised to provide advice to retail clients. Accordingly, if you are not a professional investor, or are otherwise restricted from receiving this information, you should disregard it. Charts and data are sourced from Bloomberg unless otherwise stated. Please read the important information at the back of this document. The note does not have regard to the specific investment objectives, financial situation and needs of any specific person who may receive it. The note has not been prepared in accordance with legal requirements designed to promote the independence of investment research and as such is considered to be a marketing communication. The analysts who prepared this note are not constrained from dealing ahead of it, but in practice, and in accordance with our internal code of good conduct, will refrain from doing so for the period from which they first obtained the information necessary to prepare the note until one month after the note’s publication. Nevertheless, they may have an interest in any of the securities mentioned within this note. This note has been compiled from publicly available information. This note is not directed at any person in any jurisdiction where (by reason of that person’s nationality, residence or otherwise) the publication or availability of this note is prohibited.
Accuracy of Content: Whilst Marten & Co uses reasonable efforts to obtain information from sources which we believe to be reliable and to ensure that the information in this note is up to date and accurate, we make no representation or warranty that the information contained in this note is accurate, reliable or complete. The information contained in this note is provided by Marten & Co for personal use and information purposes generally. You are solely liable for any use you may make of this information. The information is inherently subject to change without notice and may become outdated. You, therefore, should verify any information obtained from this note before you use it.
No Advice: Nothing contained in this note constitutes or should be construed to constitute investment, legal, tax or other advice.
No Representation or Warranty: No representation, warranty or guarantee of any kind, express or implied is given by Marten & Co in respect of any information contained on this note.
Exclusion of Liability: To the fullest extent allowed by law, Marten & Co shall not be liable for any direct or indirect losses, damages, costs or expenses incurred or suffered by you arising out or in connection with the access to, use of or reliance on any information contained on this note. In no circumstance shall Marten & Co and its employees have any liability for consequential or special damages.
Governing Law and Jurisdiction: These terms and conditions and all matters connected with them, are governed by the laws of England and Wales and shall be subject to the exclusive jurisdiction of the English courts. If you access this note from outside the UK, you are responsible for ensuring compliance with any local laws relating to access.
No information contained in this note shall form the basis of, or be relied upon in connection with, any offer or commitment whatsoever in any jurisdiction.
Investment Performance Information: Please remember that past performance is not necessarily a guide to the future and that the value of shares and the income from them can go down as well as up. Exchange rates may also cause the value of underlying overseas investments to go down as well as up. Marten & Co may write on companies that use gearing in a number of forms that can increase volatility and, in some cases, to a complete loss of an investment.