
Mining bottleneck fuels uranium upside
Geiger Counter’s (GCL’s) manager believes that uranium and nuclear energy’s long-term fundamentals are strong, driven by persistent supply deficits and rising structural demand from both traditional reactors and emerging demand for power such as AI data centres. Whilst recent investment has focused on fuel processing stages such as conversion and enrichment, uranium mining remains the primary bottleneck, according to the manager, positioning GCL’s mining-focused portfolio for potential upside.
Geopolitical tensions appear to have increased the focus on energy security, and supply constraints are expected to persist into the mid-2030s, with limited new projects and operational challenges among major producers. At the same time, growing energy demand from AI infrastructure may contribute to increased demand, and as utilities re-enter the market to secure supply, uranium prices could rise.
The resignation of GCL’s portfolio managers has created near-term uncertainty, and a board update is expected following the issuance of protective notice to the investment manager.
Capital growth from portfolio of uranium stocks
GCL aims to provide investors with capital growth by investing in a portfolio of securities of companies involved in the exploration, development and production of energy. Its main focus is the uranium sector, but up to 30% of assets may be invested in other resource-related companies.
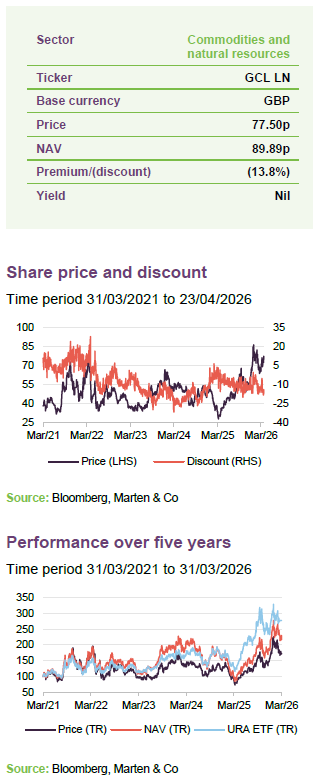
| Year ended | Share price total return (%) | NAV total return (%) | Global X Uranium ETF total return (%) |
|---|---|---|---|
| 31/03/2022 | 63.2 | 58.3 | 45.9 |
| 31/03/2023 | (40.8) | (24.4) | (18.9) |
| 31/03/2024 | 35.1 | 71.4 | 41.5 |
| 31/03/2025 | (32.6) | (52.3) | (22.2) |
| 31/03/2026 | 94.4 | 121.0 | 113.0 |
Manager upheaval
Portfolio managers resigned from investment manager in March
In early March, GCL’s portfolio managers, Keith Watson and Robert Crayfourd, announced their resignation from GCL investment manager Manulife CQS Investment Management, where they have spent 12 and 15 years respectively. Both will serve their three-month notice periods, during which they will continue to manage GCL’s portfolio, as well as those of CQS stablemates Golden Prospect Precious Metals (GPM) and CQS Natural Resources Growth and Income (CYN) that they also manage, before taking up roles at Tufton Investment Management to lead their move into natural resources and energy.
GCL’s board served protective notice on manager
GCL’s board has served 12 months’ protective notice to Manulife CQS on its investment management agreement, as have the boards of GPM and CYN. The board stated that discussions and a review around the options for future portfolio management arrangements are ongoing. It remains unclear whether management will pass to a new team within Manulife CQS (which has engaged two senior portfolio managers, Diana Racanelli and Craig Bethune, to work alongside Keith and Robert in the management of the portfolio), or move to Tufton, or another investment house.
Market outlook
The resignations come at a time when the fundamentals in the uranium and nuclear energy sector appear attractive. In previous notes on GCL (links to which can be found on page 17), we have discussed the long-duration supply deficits and accelerating structural demand (from both traditional reactors and emerging power-intensive industries such as AI data centres) as potential factors that could underpin a multi-year positive outlook for the uranium sector.
Bottleneck in uranium mining?
Capital appears to have flown through the fuel supply chain and reactor stocks, with capital targeted around conversion and enrichment where bottlenecks seem to exist. However, uranium miners – which is where GCL’s portfolio is concentrated – have largely been overlooked. GCL’s managers state that it is becoming increasingly apparent that uranium mining may be the key bottleneck in the nuclear supply chain. According to GCL’s managers, if this is the case, GCL’s portfolio companies could benefit as recognition of this grows, which may support GCL’s asset value.
Macro backdrop – geopolitics and energy security
The Russia-Ukraine conflict, which has entered its fifth year, has likely prompted Western governments to reassess their dependence on Russian nuclear fuel services and appears to have accelerated investment in domestic conversion and enrichment capacity across the US and Europe. GCL’s managers say that ceasefire talks appeared to have prompted some investors to believe that dependence on Russia could return if the war ends. However, the managers believe this sentiment does not reflect the current situation. They state that Russian material has continued to enter the market throughout the war, with the full ban in the US yet to be fully implemented and the US still importing.
Western reactors are expected to continue efforts to diversify sources of supply away from Russia, which accounts for around 5%-6% of global uranium supply and has significant influence over Kazakhstan’s approximately 40% global market share, as well as a large portion of both conversion and enrichment. This diversification may be intended to protect against a potential escalation of the conflict or future conflicts.
Regardless of any ceasefire, a structural shift appears to have occurred, and energy security is no longer considered theoretical. War in the Middle East has likely reinforced this, and investor interest in the broader energy complex – including critical minerals such as uranium – appears to have grown.
The geopolitical backdrop has positioned uranium as a strategic commodity. Within the context of the US-China trade war, China appears to have exercised leverage through its control of rare earth minerals. According to the managers, China, along with Russia, could potentially exert a similar level of control and influence over the uranium market. This consideration may have formed part of the rationale behind the US’s plans to build its own strategic reserve, with nuclear accounting for around 20% of US power generation.
As Western nations have sought to secure energy, much of the investment has so far been directed towards the enrichment and conversion stages of the nuclear fuel cycle. According to the managers, this may help to ease these bottlenecks, which they believe can be addressed in a three-year period. The managers state that mining of the raw U3O8 is now the ultimate bottleneck, and that there is a far longer lead time required to bring on new supply.
Uranium supply deficits to persists until at least the mid-2030s?
There appear to be few new uranium projects currently being developed, with the exception of GCL’s largest holding, NexGen’s Rook I uranium project (which is discussed in more detail on page 8). Large, high-grade, and politically stable projects are limited in number, and as uranium deficits persist, their strategic value may increase.
The World Nuclear Association (WNA) projects that uranium supply deficits may persist and could worsen through to at least the mid-2030s, as shown in Figure 1.
Figure 1: Uranium market supply-demand imbalance

GCL’s managers note that the WNA forecast was based on a best-case scenario on the supply side and was produced before recently announced production downgrades and operational challenges. These include issues at major producers. Cameco has lowered its production guidance and Kazatomprom has reduced production expectations, citing an ongoing acid shortage. The outlook also assumes that currently unpermitted development projects come online as scheduled.
Uranium price needs to rise to incentivise development
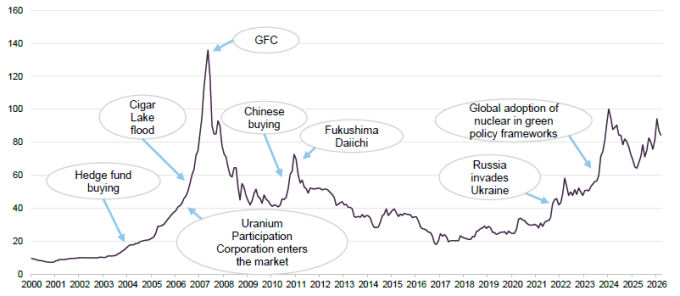
Even under these optimistic assumptions, the supply gap appears difficult to close, leading GCL’s managers to conclude that uranium prices may need to be structurally elevated to incentivise brownfield restarts and greenfield developments.
Figure 2: Spot uranium price 2000 – 2026 (US$/lb U3O8)
AI data centres and nuclear power
Off-grid nuclear reactors a viable solution to power-hungry AI data centres?
In addition to the fundamental supply-demand imbalance, growth in AI and the associated increase in energy demand required to power data centre infrastructure appears to be widening the gap further. Nuclear’s status as a zero-carbon baseload energy source, together with the significant power requirements of data centres (a single hyperscale facility can consume over 1 gigawatt (GW) of power), has led some observers to suggest that the two could be complementary. The substantial power consumption of data centres has led many hyperscalers and developers in the US to deliver their own off-grid power solutions to supply their data centres.
Hyperscalers backing development of small modular reactors across the US
Gas turbines have provided a short-term solution, and demand has led to lead times increasing to more than five years. GCL’s managers state that a long-term, sustainable solution is the inclusion of nuclear reactors, either through small modular reactors (SMRs), which are quicker to bring online and easier to finance, or full-scale reactors to power AI data centre clusters. Recent examples include Amazon signing a purchase power agreement with Talen Energy for the long-term supply of 1.9GW of electricity to its data centre campus in Pennsylvania from Talen’s adjacent Susquehanna nuclear power plant. Amazon also has an SMR partnership with Dominion Energy, while Alphabet has entered into an agreement with Kairos Power to provide up to 500GW of power from seven SMRs.
In addition, some older reactors are being restarted or having their operational lifespans extended. The Three Mile Island reactor is one example, where Microsoft has signed a 20-year agreement to purchase power from the Pennsylvania plant, which experienced an accident in the late 1970s, when it is scheduled to restart in 2027. Other examples include Holtec’s Palisades plant, which was shut in 2022 and is scheduled to restart this year, and Duane Arnold, which is currently in the process of being restarted by NextEra Energy with support from Google after shutting in 2020.
Development in China far outstrips activity in the US and underpins global uranium demand
Activity in the US appears limited in scale compared to the reactor buildout in China (see Figure 3). Even without incremental AI demand, the global nuclear buildout may support a structural case for uranium demand.
GCL’s managers state that nuclear fuel and generation can be construed as an AI infrastructure investment that may offer downside protection. They also state that it is a cheaper entry point into the AI infrastructure investment trade compared to technology equities that are trading on premium multiples.
Figure 3: Generating capacity by region (GW)

Utilities – the missing buyer
Despite the ongoing geopolitical situation, visible supply deficits and the increased demand associated with the rise of AI, Western utility companies have largely not increased contracting activity. GCL’s managers believe several factors may explain this, including the traditionally conservative nature of utilities’ contracting, inventory management strategies that may delay procurement urgency, and anticipation of new supply from advanced-stage projects. According to GCL’s managers, there are few projects in the pipeline, with the exception of NexGen’s Rook I project (more details on page 8).
With production guidance being revised downwards and geopolitical risks persisting, utilities may need to return to the market. The last time utilities replenished stock, in 2023, the uranium spot price rose above $100/lb. The managers state that this has largely been used up, and expect an increase in contracting activity, which could see spot prices move higher.
Asset allocation
GCL’s portfolio is highly concentrated with inherently low turnover
GCL’s portfolio is concentrated, with the top five holdings accounting for 67.9% of the fund (see Figure 6). Figures 4 and 5 indicate that the portfolio’s geographical allocation is focused on companies in North America. Typically, around half of GCL’s portfolio is invested in assets considered safer, such as producers or companies backed by physical uranium. Pure exploration plays represent a more limited exposure within the fund.
Figure 4: GCL portfolio split by geography1

Figure 5: GCL portfolio split by sector

In part reflecting the managers’ investment style, as well as the concentrated nature of the industry, GCL’s portfolio has a low turnover. Changes in the composition of the top five holdings (discussed in more detail below) are frequently attributed by the managers to differences in near-term relative performance, rather than other considerations. The managers typically expect portfolio turnover to be between 10%-20% per annum, with much of this involving trimming stocks whose prices have increased and adding to holdings where the managers believe there is more value.
As at 30 September 2025, GCL had one unlisted investment and seven unlisted warrants.
GCL has exposure to physically-backed uranium entities through its holding in Sprott Uranium Trust (4.6% at 30 September 2025). However, compared to alternatives such as the URA exchange traded fund (ETF), GCL appears to be underweight in Cameco and Kazatomprom.
Top five holdings
Figure 6 shows GCL’s top five holdings at 31 March 2026 and how these have changed over six months. The portfolio is focused on names that the managers believe offer potential for growth, may benefit from an increase in the uranium price and a potential increase in Western reactor contracting.
Figure 6: Top five holdings as at 31 March 2026
| Holding | Stage | Country | Allocation 31 Mar 2026 (%) | Allocation 31 Aug 2025 (%) | Percentage point change |
|---|---|---|---|---|---|
| NexGen Energy | Construction | Canada | 23.9 | 25.6 | (1.7) |
| Paladin Energy | Uranium mining | Australia | 15.5 | 12.7 | 2.8 |
| UR-Energy | Uranium mining | US | 14.6 | 16.4 | (1.8) |
| Cameco | Uranium mining | Canada | 7.1 | 6.4 | 0.7 |
| Denison Mines | Construction | Canada | 6.8 | 6.7 | 0.1 |
| Total of top five | 67.9 |
NexGen Energy (23.9%)
Figure 7: NexGen Energy share price (CAD)

In early March, NexGen Energy (www.nexgenenergy.ca), which has been GCL’s largest holding by a significant margin for some time, received the final regulatory approval for the Rook I uranium project in northern Saskatchewan, Canada, and is expected to begin construction later this year. The approval appears to have enhanced the company’s future earnings prospects. With the project largely uncontracted, NexGen retains exposure to potential increases in the uranium price. NexGen’s share price has risen 153% over the past 12 months.
The uranium mine and mill development at Rook I is described as the largest and one of the most advanced development stage uranium mining projects globally. A 2021 feasibility study forecast production of up to 31 million lbs of U3O8 annually over a 24-year mine life.
NexGen states that it is funded to commence construction, which is expected to take four years to complete, having already completed equity raises and offtake agreements. The company also states that further offtake agreements are in advanced negotiation, with contracts expected to be announced this year.
Paladin Energy (15.5%)
Figure 8: Paladin Energy share price (AUD)

Paladin Energy (www.paladinenergy.com.au) is a Western Australian-based uranium production company that currently has one operating mine – the Langer Heinrich Mine in Namibia (of which it owns 75%). The company reported a 16% increase in quarterly uranium production (to 1.23Mlb) in the three months to the end of December 2025 and sold 1.43Mlb U3O8 at an average price of $71.8/lb. Paladin is targeting full mining and processing capacity by the end of 2026. At full production, the Langer Heinrich Mine’s annual uranium output is sufficient to supply more than ten 1,000-MW nuclear power plants annually.
In February, Paladin received government approval for the Environmental Impact Statement for its Patterson Lake South project, adjacent to NexGen’s Rook I asset, in Saskatchewan.
UR-Energy (14.6%)
Figure 9: UR-Energy share price (CAD)

UR-Energy (www.ur-energy.com/) is a junior uranium mining company that operates fully-permitted, in-situ assets in the US. In December 2025, the company issued a $120m convertible bond that is intended to provide further funding for the restart of its Wyoming projects. Production at its facility at Lost Creek in south-central Wyoming (which has a historic production of 2.7Mlbs) is recommencing after the company gained final approval for its expansion in May last year. Construction is underway at its Shirley Basin site, which is expected to make it a two-mine operation and increase production capacity to 4.2Mlbs.
Cameco (7.1%)
Figure 10: Cameco share price (CAD)

Cameco (www.cameco.com) has for a long time been one of GCL’s largest underweight positions relative to the Global X Uranium ETF, which had a 22.8% exposure to Cameco at 23 April 2026. GCL’s managers state that their bearish stance on the world’s largest publicly-traded uranium company is based on the view that Cameco has largely contracted out 180 million lbs of uranium for the next five years and therefore may have limited participation in any upside in the U3O8 spot price, as shown in Figure 11.
Figure 11: Cameco’s expected uranium price sensitivity under various spot price assumptions
| $60/lb | $80/lb | $100/lb | $120/lb | $140/lb | |
|---|---|---|---|---|---|
| 2026 | 56 | 66 | 69 | 70 | 71 |
| 2027 | 57 | 69 | 73 | 76 | 78 |
| 2028 | 59 | 71 | 77 | 80 | 82 |
| 2029 | 61 | 73 | 82 | 86 | 89 |
The managers believe that Cameco’s position in the sector justifies its place and weighting within the portfolio. Cameco’s land holdings, including exploration, span about 1.9 million acres, the majority of which are located in northern Saskatchewan, at the Athabasca Basin. It is home to two of the world’s largest high-grade uranium deposits, in Cigar Lake and McArthur River/Key Lake.
Denison Mines (6.8%)
Figure 12: Denison share price (CAD)

Uranium exploration and development company Denison Mines (www.denisonmines.com) has recently started construction of its Phoenix project in the Athabasca Basin region of northern Saskatchewan, Canada, after receiving all regulatory approvals. The in-situ recovery (ISR) uranium mine is expected to become one of the few new sizable sources of uranium production that may come to market before the end of the decade. Denison’s share price declined towards the end of 2025 following the announcement that expected development capex had increased by approximately 40% to CAD$600m, but increased nearly 10% in February after the Canadian Nuclear Safety Commission granted the licence.
Denison’s portfolio also consists of other projects in the Athabasca Basin, including its 90% owned Wheeler River project (which the company states is the largest undeveloped high-grade uranium project in the infrastructure rich eastern portion of the Athabasca Basin region), as well as interests in the McClean Lake and Waterbury Lake.
Performance
GCL’s NAV has more than doubled over the past 12 months. Its share price has not increased at the same rate, rising 94.4% over the year to 31 March 2026. Figure 13 may be distorted by the share price performance of Cameco over the past four years. Cameco appears to have been used by generalist investors seeking exposure to the uranium sector, which may have contributed to the gains it has experienced. However, as discussed earlier, Cameco may have limited participation in a sustained uplift in the uranium spot price over the next few years.
Figure 13: GCL share price and NAV versus the Global X Uranium ETF and Cameco – rebased to 100 over five years to 31 March 2026
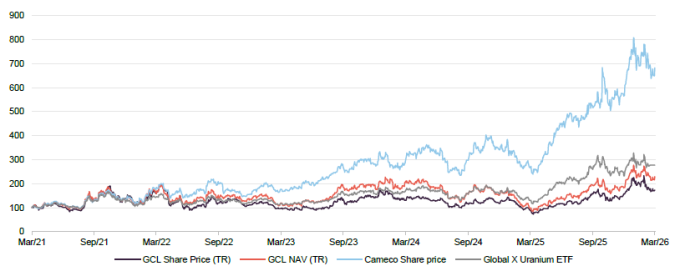
Although GCL had lagged the Global X Uranium ETF over three and five years, it has outperformed over the past 12 months and over 10 years. This performance data does not compensate for the dilution effect of sub-shares, which, while this has not disadvantaged shareholders that either took up rights or received payment for sold rights, may act to dilute the headline performance.
Figure 14: Cumulative total return performance over periods ending 31 March 2026
| 1 month (%) | 3 months(%) | 6 months (%) | 1 year (%) | 3 years(%) | 5 years(%) | 10 years(%) | |
|---|---|---|---|---|---|---|---|
| GCL NAV | (15.6) | 9.2 | 9.0 | 94.4 | 77.0 | 71.0 | 351.7 |
| GCL share price | (14.9) | 17.1 | 11.9 | 121.0 | 80.5 | 116.0 | 276.8 |
| Cameco | (11.4) | 14.5 | 25.0 | 144.1 | 267.7 | 548.9 | 773.2 |
| Global X Uranium ETF | (6.3) | 19.1 | 6.8 | 113.0 | 134.3 | 177.2 | 239.9 |
| Peer group average NAV1 | (10.7) | 14.3 | 28.2 | 83.4 | 100.3 | 139.7 | 382.7 |
| Peer group average share price1 | (11.9) | 11.4 | 24.8 | 84.8 | 97.8 | 109.8 | 448.2 |
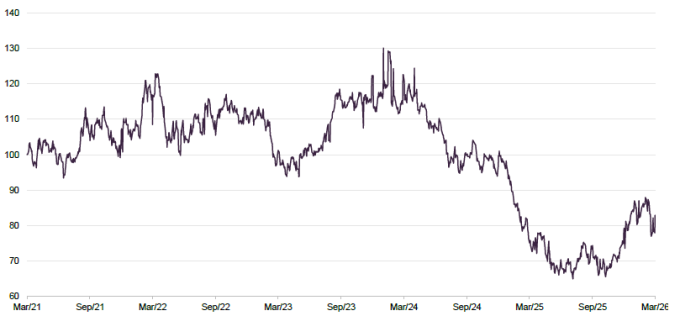
Figure 15 shows GCL’s NAV performance compared to the Global X Uranium ETF over five years.
Figure 15: GCL NAV performance relative to the Global X Uranium ETF1 – rebased to 100 over five years to 31 March 2026
Peer group
Click here for a live comparison of the commodities and natural resources peer group
GCL is a member of the AIC’s sector specialist commodities and natural resources sector, which is comprised of nine members. Three of these have been excluded from the peer group analysis – Global Resources Investment Trust (GRIT) and Tiger Royalties and Investments (TIR) on size grounds (both sub-£5m market cap) and Riverstone Energy, which is in a managed wind-down process.
None of the funds used appear to be exact comparators, with GCL being the only fund that invests in listed uranium equities. Yellow Cake Plc (YCA) has been added to the peer group; YCA is focused on uranium but invests in physical uranium.
Figure 16: Peer group cumulative NAV total return performance to 31 March 2026
| 1 month (%) | 3 months (%) | 6 months (%) | 1 year (%) | 3 years (%) | 5 years (%) | 10 years (%) | |
|---|---|---|---|---|---|---|---|
| GCL | (16.0) | 17.1 | 11.9 | 121.0 | 80.5 | 116.0 | 276.8 |
| Yellow Cake1 | 0.0 | 20.6 | 20.0 | 44.0 | 71.9 | 201.7 | – |
| Baker Steel Resources | 0.0 | 28.2 | 56.6 | 95.0 | 127.0 | 79.0 | 402.3 |
| BlackRock Energy & Res | (1.9) | 17.1 | 34.0 | 60.2 | 60.3 | 145.5 | 408.2 |
| BlackRock World Mining | (18.6) | 7.2 | 31.9 | 79.5 | 56.5 | 107.3 | 503.0 |
| CQS Natural Resources | (10.8) | 16.6 | 38.8 | 110.9 | 117.4 | 219.6 | 462.9 |
| Golden Prospect | (27.7) | (6.4) | 4.3 | 73.4 | 188.4 | 108.9 | 243.1 |
| GCL rank | 5/7 | 4/7 | 6/7 | 1/7 | 4/7 | 4/7 | 5/6 |
| Sector arithmetic avg. | (10.7) | 14.3 | 28.2 | 83.4 | 100.3 | 139.7 | 382.7 |
Figures 16 and 17 show GCL’s NAV and share price performance as being in the middle range over most periods and ahead of peers over one year in NAV terms. As mentioned, this is not a perfect peer group comparison, as the specialist funds are focused on other commodity/mining sectors. GCL has outperformed Yellow Cake over one and three years.
Figure 17: Peer group cumulative share price total return performance to 31 March 2026
| 1 month (%) | 3 months(%) | 6 months (%) | 1 year (%) | 3 years(%) | 5 years(%) | 10 years(%) | |
|---|---|---|---|---|---|---|---|
| GCL | (15.6) | 9.2 | 9.0 | 94.4 | 77.0 | 71.0 | 351.7 |
| Yellow Cake | (8.3) | (1.4) | 2.3 | 39.4 | 58.0 | 114.1 | – |
| Baker Steel Resources | (3.0) | 48.4 | 69.7 | 121.2 | 136.1 | 32.9 | 597.0 |
| BlackRock Energy & Res | (3.4) | 19.2 | 38.8 | 69.6 | 59.2 | 145.0 | 381.0 |
| BlackRock World Mining | (16.5) | 7.0 | 27.5 | 86.5 | 47.1 | 93.6 | 554.5 |
| CQS Natural Resources | (17.0) | 4.8 | 25.4 | 108.7 | 142.1 | 218.5 | 570.4 |
| Golden Prospect | (19.8) | (7.4) | 1.0 | 74.0 | 164.8 | 93.5 | 234.6 |
| GCL rank | 4/7 | 3/7 | 5/7 | 3/7 | 4/7 | 6/7 | 5/6 |
| Sector arithmetic avg. | (11.9) | 11.4 | 24.8 | 84.8 | 97.8 | 109.8 | 448.2 |
Figure 18: Peer group comparison – size, fees, discount, yield and gearing at 23 April 2026
| Market cap (£m) | 1-yr Standard deviation | Ongoing charges (%)1 | Perf. fee | Premium/ (discount) (%) | Dividend yield (%) | Net gearing (%)3 | |
|---|---|---|---|---|---|---|---|
| GCL | 81 | 46.7 | 2.11 | No | (13.8) | Nil | 12.7 |
| Yellow Cake | 1,548 | n/a | 0.95 | No | (3.2)2 | Nil | (9.4) |
| Baker Steel Resources | 136 | 30.0 | 2.37 | Yes | (25.9) | Nil | (0.6) |
| BlackRock Energy & Resources | 196 | 18.5 | 1.15 | No | (3.3) | 2.5 | 5.0 |
| BlackRock World Mining | 1,819 | 33.1 | 1.05 | No | (2.7) | 2.5 | 6.9 |
| CQS Natural Resources | 153 | 39.0 | 2.00 | No | (4.5) | 6.4 | 6.8 |
| Golden Prospect | 112 | 45.2 | 1.99 | No | (16.3) | Nil | 0.8 |
| GCL rank | 7/7 | 6/6 | 6/7 | 3/7 | 4/7 | 7/7 | |
| Sector arithmetic avg. | 577.9 | 35.4 | 1.66 | (11.1) | 1.6 | 3.2 |
Figure 18 shows that GCL’s ongoing charges ratio ranks towards the lower end of its peer group, which may be attributable to its relatively small size. If performance improves as the manager expects, the manager believes this could lead to GCL trading at a premium and issuing stock as it has in the past, which may put downward pressure on the ongoing charges ratio. GCL’s net gearing is the highest in the peer group, suggesting that it could benefit if uranium performs well, but may be more negatively affected if uranium does not perform well. GCL is more expensive than the other uranium fund, YCA, but it has a longer track record.
Premium/(discount)
GCL has traded at an average discount of 9.5% over 12 months
GCL’s discount has widened during the last year, having been around par in the early part of 2025. On 23 April 2026 its discount was 13.8%. Over the last year, GCL has traded at an average discount of 9.5% (with a range of a 3.2% premium to a 19.8% discount). This is at the lower end of its trading range over five years (7.4% average discount).
Figure 19: GCL premium/(discount) over five years

Fund profile
Further information can be found at: ncim.co.uk/geiger-counter-ltd
GCL aims to provide investors with returns, primarily in the form of capital growth, by investing in a portfolio of securities of companies involved in the exploration, development and production of energy and related service companies. Its main focus is uranium, but to allow diversification beyond this concentrated sector, up to 30% of assets can be invested in other resource-related companies.
GCL does not have a formal benchmark and is not managed with the aim of providing outperformance relative to an index. Instead, the portfolio is managed with an absolute return approach, with the managers selecting securities that they believe may provide favourable risk-adjusted returns over the longer term. The managers consider uranium a potential beneficiary of long-term structural growth drivers, and the portfolio is focused on securities that the managers believe are undervalued. The managers expect that such securities may re-rate over time, which could provide the scope for capital appreciation beyond what the market expects.
GCL has a global remit, but its portfolio appears to be weighted towards North American and Australian-listed equities. The portfolio is predominantly invested in equities, but it is not restricted to these and may also invest in convertible securities, fixed-income securities and warrants.
Investment manager
New City Investment Managers (NCIM) has been GCL’s investment manager since its launch in July 2006. On 1 October 2007, NCIM joined the CQS Group, a global diversified asset manager running multiple strategies. In November 2023, CQS was acquired by Manulife Investment Management. As mentioned earlier, GCL’s board served protective notice on the investment manager after long-term portfolio managers Keith Watson and Rob Crayfourd resigned from the company.
No formal benchmark index
Reflecting both its specialist investment proposition and a relatively small universe, GCL does not have a formal benchmark. However, for the purpose of performance evaluation, the manager has traditionally made comparisons against the price of Cameco and the spot price of triuranium octoxide (U3O8 – the most stable uranium compound and one of the more popular forms of the product).
This note includes comparisons against Cameco…
Cameco is the largest listed uranium producer in the world and the second-largest uranium producer. It also provides the processing services needed to produce fuel for nuclear power plants. Cameco has a Canadian listing and its share price and the associated total return series are available, so they have been included in this report. Comparisons against the spot price of U3O8 have not been included, due to reduced visibility of the U3O8 spot price and because the majority of market practitioners cannot invest directly in this commodity.
… and the Global X Uranium ETF
Finally, the Global X Uranium ETF (URA) has also been used as a comparator in this note. This ETF has net assets of around US$7.95bn and is considered liquid. It provides investors with access to a broad range of companies involved in uranium mining and the production of nuclear components, including companies involved in extraction, refining, exploration, or manufacturing of equipment for the uranium and nuclear industries. Its objective is to provide investment results that correspond generally to the price and yield performance, before fees and expenses, of the Solactive Global Uranium & Nuclear Components Total Return Index.
Previous publications
Readers seeking further information about GCL may refer to previous notes, which are accessible via the links below or on the website.
Figure 20: QuotedData’s previously published notes on GCL
IMPORTANT INFORMATION
Marten & Co (which is authorised and regulated by the Financial Conduct Authority) was paid to produce this note on Geiger Counter Limited.
This note is for information purposes only and is not intended to encourage the reader to deal in the security or securities mentioned within it. Marten & Co is not authorised to give advice to retail clients. The research does not have regard to the specific investment objectives financial situation and needs of any specific person who may receive it.
The analysts who prepared this note are not constrained from dealing ahead of it but, in practice, and in accordance with our internal code of good conduct, will refrain from doing so for the period from which they first obtained the information necessary to prepare the note until one month after the note’s publication. Nevertheless, they may have an interest in any of the securities mentioned within this note.
This note has been compiled from publicly available information. This note is not directed at any person in any jurisdiction where (by reason of that person’s nationality, residence or otherwise) the publication or availability of this note is prohibited.
Accuracy of Content: Whilst Marten & Co uses reasonable efforts to obtain information from sources which we believe to be reliable and to ensure that the information in this note is up to date and accurate, we make no representation or warranty that the information contained in this note is accurate, reliable or complete. The information contained in this note is provided by Marten & Co for personal use and information purposes generally. You are solely liable for any use you may make of this information. The information is inherently subject to change without notice and may become outdated. You, therefore, should verify any information obtained from this note before you use it.
No Advice: Nothing contained in this note constitutes or should be construed to constitute investment, legal, tax or other advice.
No Representation or Warranty: No representation, warranty or guarantee of any kind, express or implied is given by Marten & Co in respect of any information contained on this note.
Exclusion of Liability: To the fullest extent allowed by law, Marten & Co shall not be liable for any direct or indirect losses, damages, costs or expenses incurred or suffered by you arising out or in connection with the access to, use of or reliance on any information contained on this note. In no circumstance shall Marten & Co and its employees have any liability for consequential or special damages.
Governing Law and Jurisdiction: These terms and conditions and all matters connected with them, are governed by the laws of England and Wales and shall be subject to the exclusive jurisdiction of the English courts. If you access this note from outside the UK, you are responsible for ensuring compliance with any local laws relating to access.
No information contained in this note shall form the basis of, or be relied upon in connection with, any offer or commitment whatsoever in any jurisdiction.
Investment Performance Information: Please remember that past performance is not necessarily a guide to the future and that the value of shares and the income from them can go down as well as up. Exchange rates may also cause the value of underlying overseas investments to go down as well as up. Marten & Co may write on companies that use gearing in a number of forms that can increase volatility and, in some cases, to a complete loss of an investment.