Public matters
On 24 June Caledonia Investments (CLDN) hosted a public companies spotlight event, where the managers presented in detail on the company’s global portfolio of publicly listed investments. This element of the portfolio has a strategic allocation of between 30% and 40% of net asset value (NAV), currently making up 33%. Around 30 companies are held across two portfolios, with a capital portfolio accounting for 72% of the total and income 28%. The target return is 10% per annum for the capital portfolio and 7% for income.
This note focuses specifically on the public companies strategy, and accompanies our note from April which looked at CLDN’s private capital strategy, following a similar spotlight event. The most recent event reassured us about the high quality of the companies held and the robust investment process that determines their selection.
Inflation-beating returns
CLDN’s aim is to generate long-term compounding real returns that outperform inflation by 3%-6% over the medium-to-long term, and the FTSE All-Share index over 10 years.
At a glance
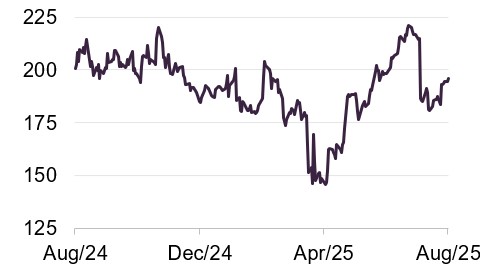
Share price and discount
We have written about the persistent CLDN discount in all of our previous notes, and the position remains broadly unchanged. Over the 12 months ended 31 August 2025, the range was 28.1% to 39.9%, with an average of 33.6%. The current discount is 32.2%, versus 35.5% at the time of our previous note in April. It is encouraging to note the small narrowing.
Time period 31 August 2020 to 12 September 2025
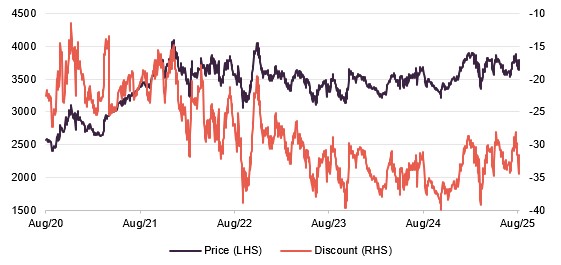
Source: Bloomberg, Marten & Co
Performance over five years
The performance of CLDN is not benchmarked against an index or peer group. Nonetheless, the fund has set itself a target of generating long-term compounding real returns that outperform inflation by 3%-6% over the medium-to-long term, and the FTSE All-Share Index over 10 years.
Figures 19 and 20 show that CLDN has surpassed both these objectives, with 10-year returns impressively ahead of both UK equities and inflation.
Time period 31 August 2020 to 31 August 2025
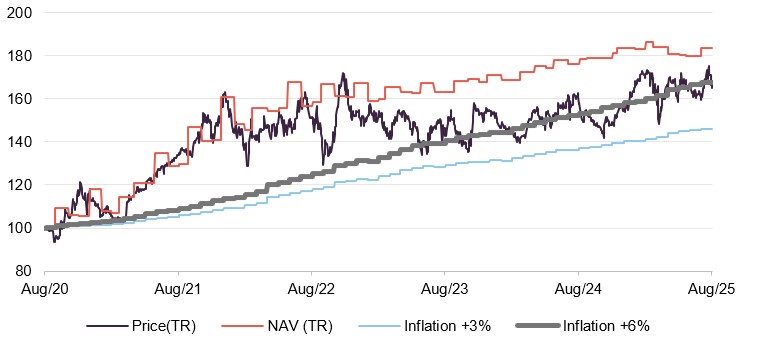
Source: Bloomberg, Marten & Co
| 12 months ended | Share price total return (%) | NAV total return (%) | Inflation – CPIH (%) |
|---|---|---|---|
| 31/08/2021 | 34.7 | 29.9 | 2.7 |
| 31/08/2022 | 12.3 | 22.0 | 8.7 |
| 31/08/2023 | (5.0) | 3.1 | 6.2 |
| 30/08/2024 | 9.9 | 7.9 | 3.1 |
| 29/08/2025 | 4.3 | 4.0 | 3.8 |
Company background
Investors may wish to consult the trust’s website at www.caledonia.com
As we covered in detail in our initiation note, which you can read here, CLDN’s investments are spread across three major strategies: private capital, funds, and the focus of this note; public companies. Broadly speaking, the trust applies the same strategic approach to each of these segments: identifying and backing high-quality and growing companies. Crucial to CLDN’s success is its ability to invest time in understanding these companies and their return drivers. It buys to hold, has a long-term time horizon, and undertakes extensive due diligence on its investments (deep research and evaluation of company fundamentals, governance, and market positioning before investing).
The company has a strategic objective to grow the real value (after allowing for inflation) of its net assets and dividends, while managing investment risk for long-term wealth creation. CLDN has set itself the target of generating long-term compounding real returns that outperform inflation by 3%-6% over the medium-to-long term, and the FTSE All-Share index over 10 years.
Over the past decade, the company has comfortably outperformed these targets, generating an impressive, annualised NAV total return of 9.5%. Few listed investment companies have an explicit objective of growing shareholders’ capital and income in real terms, and fewer still have been able to deliver these types of returns on such a consistent basis. This success has been built on CLDN’s ability to focus on a long-term investment horizon and invest only when it sees the best opportunities, underpinned by the permanent nature of its balance sheet. As a self-managed trust, CLDN is not constrained by a need to meet short-term performance objectives or comply with fixed-life fund cycles (a structure where funds are forced to wind down and return capital after a set number of years). Without external pressure, the managers can ignore the gyrations of fickle markets (temporary volatility driven by investor sentiment or macro events), exploiting secular growth rather than short-term cyclical opportunities.
Public companies strategy
The public companies segment of CLDN is split between capital and income portfolios.
CLDN aims to hold between 15 and 20 companies in each of the capital and income portfolios. As at 31 March 2025 there were 18 companies in the former and 17 in the latter. Five companies were held in both portfolios. The capital portfolio is significantly larger, at £698m versus £267m for the income portfolio; together they represent just under £1bn of CLDN’s assets.
The stated aim for the capital portfolio is “investing in companies that will continue to provide compounding returns to shareholders”. This leads to an unconstrained mandate, in that there is no income requirement and as an “all cap” portfolio there is no constraint on the size of the companies held. The target return is 10% per annum.
For the income portfolio, the aim is “investing in resilient businesses with the capacity to pay sustainable dividends”. The target return is lower at 7% per annum, with a target initial yield on cost of 3.5% (the dividend income received divided by the original investment amount).
Both portfolios are constructed using the same research methodology. The focus is on holding the highest quality companies, with pricing power and capital allocation particularly important. Specifically, there is no desire or need to invest in super high-growth or super high-income stocks, but instead always this focus on quality.
CLDN is typically a long-term owner through the cycle – the average holding period across the portfolios is 7.4 years. CLDN builds a deep understanding of its investments, and has very good access to senior company management, in order to engage in a meaningful way.
Each portfolio has a global mandate. Most companies are headquartered in the US, UK or Europe, reflecting what CLDN identifies as the places with the best opportunities. However, the companies are general global in nature, with geographically diversified revenues.
The consistent focus on the investment process, backed up by the permanent balance sheet and depth of knowledge, allows CLDN to take advantage of specific opportunities during periods of market dislocation (periods of significant volatility or disruption), when other investors may be constrained. There are therefore times when gaining exposure to quality companies at a cheap price is possible.
Public companies team
Both portfolios are managed by the same team, which comprises six professional managers. Between them, the team has more than 100 years of experience, around half of which is at CLDN.
The team is led by two co-heads, Alan Murran and Ben Archer. Alan is the lead manager on the capital portfolio, a position he has held for six years, having worked at CLDN since 2016. Ben is the lead on the income portfolio. He joined CLDN in 2013 and was appointed to his co-head role in 2022.
The team is completed by Henry Morris (director), Lucy Adams (investment director), Ollie Botes (investment director) and Lukas Brueckner (investment manager).
Together the team brings a passion and in-depth knowledge to the investment process, backed up by a cohesive culture. The structure of the company allows a total focus on investing, which is often not the case at other equity funds. The team feels that a lack of a benchmark ensures that it only acts when the fundamentals are right, while the long-term approach means that short-term market noise can be looked through.
The team is also fully aligned with shareholders, with members incentivised with an LTIP linked to CLDN’s NAV. There are no carried interest arrangements.
Investment process
CLDN has a robust investment process, centred on its “Quality Matrix”.
With a focus on bottom-up stock selection, rather than being driven by the macro environment, a robust investment process is clearly important. This process is anchored by CLDN’s “Public Companies Quality Matrix”, which helps its managers analyse and benchmark prospective investments. This is shown in Figure 1, with examples of a holding that rates highly in relation to each particular aspect shown around the outside.
Figure 1: CLDN’s “Quality Matrix”
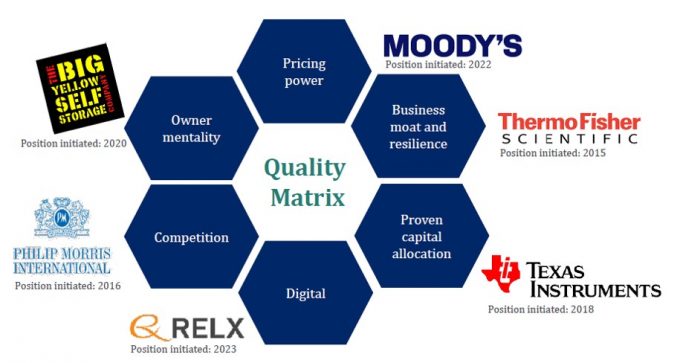
Source: Caledonia Investments
Every company that the managers consider is scored on each metric within the Quality Matrix, which acts as a benchmarking tool for the portfolio and for the internal “work in progress” list of potential investments. The matrix specifically promotes debate within the team.
All the companies held across the two portfolios will score well on most of the metrics within the Quality Matrix, but some are particularly strong in certain areas. Particular examples of this are shown in the stock-specific case studies that follow.
The lack of deference to index weightings ensures a wide opportunity set, and the ability of the managers to be highly selective (i.e., they are not required to hold companies simply because they are large constituents of a benchmark index). Fundamental analysis is undertaken, with in-depth research on the specific company and its industry. CLDN’s financial review has been built in-house and is therefore proprietary and not reliant on third parties. Data have been built up over many years, allowing the managers to get a granular picture of how a company has performed over the long-term and through business and market cycles.
The financial review is underpinned by an “owners’ earnings analysis”, that is free cashflow after maintenance capex but before growth capex. The calculation takes net income, adds back non-cash charges such as depreciation and subtracts necessary capital expenditures and working-capital changes. Unlike reported net profit, owners’ earnings focus on the actual free cash available to shareholders, rather than accounting figures influenced by non-cash or timing adjustments. As such, capital deployment can focus on companies that consistently produce surplus cash, aligning with CLDN’s long-term approach.
This analysis is fundamental to decisions on portfolio construction and ongoing monitoring. Specifically, for each company there is a long-term owners’ earnings range which, together with forecasts, helps guide the team as to when its shares are good value. This allows the team to move quickly to take advantage of particular moments of opportunity, such as the immediate aftermath of President Trump’s “Liberation Day” announcements in April.
If the entire public companies team agrees with the investment case for a stock, it progresses to CLDN’s central investment committee, which is chaired by the CEO and comprises the executive directors and heads of the pools of capital. After approval, the team’s valuation discipline means that the managers will wait for an attractive entry point before initiating a position.
After purchase, the team will seek to capitalise on market movements to either add to or top slice (reduce) the holding. This is aided by the nature of the portfolios, which are characterised by high conviction and concentration, enabling a deep understanding of the companies held.
The long-term investment horizon ensures that the team have particularly good investor access, allowing close monitoring of portfolio positions. They prefer to meet companies, be that board members or regional management teams, outside of the reporting cycle, when the individuals in question are not so focused on quarterly or half-year results. This ensures that conversation focuses on the long-term opportunity and investment case.
The portfolios have long holding periods.
Both portfolios exhibit long holding periods, at an average (calculated on an assets under management basis) of 8.4 years for the capital portfolio and 4.7 years for the income portfolio (equating to an overall average of 7.4 years). Despite being investments in listed companies, these are longer periods than is the case for many private equity investors, again emphasising the long-term, high conviction approach of CLDN. In the case of the income portfolio, it is expected that the holding period will increase further, with the current figure depressed by a strategy reset five years ago.
Case studies
Fastenal
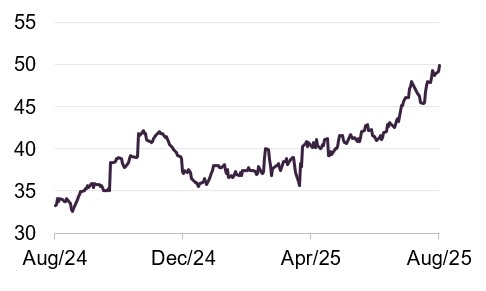
Source: Bloomberg
Fastenal is one of North America’s largest distributors of industrial and construction supplies, founded and headquartered in Winoma, Minnesota. Best known for its extensive branch network of 3,600 sites and innovative point-of-use distribution model – through vending machines, bin-stocking programmes and more than 2,000 on-site locations – the company provides fasteners, safety products, tools, and other consumables to a broad industrial customer base. This strategy of embedding directly within customer operations fosters long-term relationships, recurring revenues, and strong cash generation. Revenues have grown to more than $7.5bn per annum.
Fastenal was first on the team’s watch list in 2017, with detailed analysis completed in 2019 and early 2020. Under CLDN’s Quality Matrix, Fastenal has consistently ranked as a high-quality compounder. Its business moat and resilience are underpinned by unrivalled proximity to customers and an owned distribution fleet that ensures a critical service advantage and high switching costs (barriers that make it difficult or costly for customers to switch suppliers).
Digital capability is another defining strength, with automated vending and Fastenal-managed inventory now accounting for more than 40 per cent of sales, reflecting a sophisticated use of technology to deepen customer integration and reduce working-capital needs. The company also exemplifies the “owner mentality” that CLDN prizes, with a decentralised model, long-serving employees and a management team that prioritises prudent reinvestment and careful stewardship.
These qualitative advantages translate into compelling financial characteristics. Fastenal has no debt and does not pursue acquisition-driven expansion, yet consistently delivers high-single-digit organic revenue growth, operating margins of around 20 per cent and a return on capital employed (ROCE – measures how efficiently a company generates operating profit from the total capital invested in the business) close to 30 per cent. Such capital discipline and predictable cash generation fit squarely with CLDN’s emphasis on companies capable of long-term compounding without dependence on leverage (debt).
Covid provided CLDN with an opportunity to invest at an attractive average multiple, and in the subsequent five years compounding has worked extremely well, with 21% annualised total return since purchase. A recent top slice locked in a proportion of the profit on the holding. Net dividend yield at purchase was 2.7%, and dividends have since grown at a CAGR of 12%.
Representatives from the CLDN team met with Fastenal management in 2022, 2024 and 2025 and have regular calls with the CFO. The company has described it as “a pleasure working with investors of their calibre”.
Pool Corp
Figure 3: Pool Corp (USD)
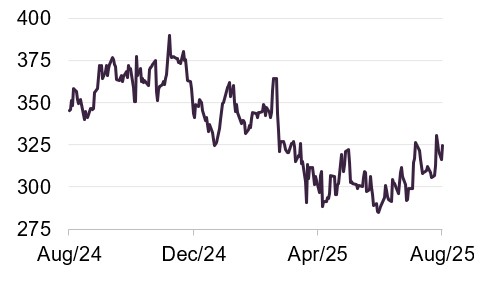
Source: Bloomberg
Pool Corp (poolcorp.com) is the world’s largest wholesale distributor of swimming pool supplies, equipment and related leisure products. Headquartered in Louisiana and operating under various brand names, it serves more than 120,000 customers through a network of around 450 sales centres across North America, Europe and Australia. Its product range spans chemicals, construction materials, replacement parts, outdoor furniture and irrigation products, positioning it as a one-stop supplier to pool builders, retailers and service professionals.
Pool Corp is an excellent example of a decentralised structure adding value to the business, with the local sales centres empowered to make decisions that suit their local market. This exemplifies the owner mentality aspect of the Quality Matrix. This is particularly beneficial in the fragmented pool and outdoor living industry. By giving each sales centre autonomy over purchasing decisions, product mix and customer relationships, the business can remain closely attuned to regional market conditions and consumer preferences. This flexibility allows Pool Corp to adapt quickly to seasonal demand patterns, climate differences and regulatory requirements.
Other important factors dovetailing with the Quality Matrix includes Pool Corp’s pricing power, stemming from its dominant market position and indispensable product range: customers value reliability of supply and service more than marginal price differences. Proven capital allocation is evident in management’s consistent reinvestment in the branch network, selective bolt-on acquisitions (small, complementary deals that enhance existing operations) and disciplined shareholder returns. In April 2025, the company expanded its share repurchase programme by $309m, bringing total authorisation to $600m. At the same time, it declared a quarterly dividend of $1.25 per share, a 4% increase and the twentieth consecutive quarterly rise since 2004.
In terms of digital capability, another pillar of the matrix, Pool Corp has invested heavily in e-commerce platforms, inventory-management systems and data analytics that allow customers to place orders seamlessly and track delivery in real time, while providing Pool Corp with valuable insights into demand patterns.
Watsco
Figure 4: Watsco (USD)
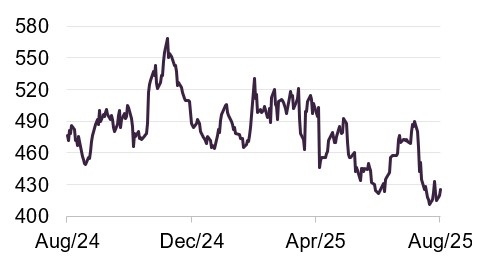
Source: Bloomberg
Watsco (watsco.com) is held in both the capital and income portfolios. It is the largest distributor of air conditioning, heating and refrigeration equipment and related parts and supplies in the Americas, serving a network of contractors across residential and commercial markets. Headquartered in Miami, the company operates more than 600 locations throughout the United States, Latin America and the Caribbean, providing products from leading manufacturers alongside its own private-label brands.
The company has invested heavily in digital tools and e-commerce platforms to support its contractor customers – tying in with the Digital element of the Quality Matrix. This initially had a negative impact on profits, but also presented an appropriate entry point for CLDN. As well as enabling the company to be future-fit (modernising operations and improving customer experience), it also enhanced the owner mentality of employees – another of the aspects of the matrix. The corporate culture at Watsco is to empower associates and promote entrepreneurialism, and over time this reinforces the company’s moat (a sustainable competitive advantage) and ensures a long-term focus that is aligned with shareholders.
Recently, Watsco has expanded its footprint through strategic acquisitions, bringing Southern Ice Equipment Distributors, Lashley & Associates in Houston and Hawkins HVAC Distributors in the Carolinas into its portfolio. These deals added over 10 new locations and around $47m in annual sales and reinforced Watsco’s commitment to serving high‑growth markets. In addition, July’s announcement of a $3 quarterly dividend marked its two-hundredth consecutive quarter of payouts.
Oracle
Figure 5: Oracle (USD)
Source: Bloomberg
Oracle (oracle.com) is a leading global provider of enterprise software, cloud services and database technology, best known for its flagship Oracle Database and broad suite of applications spanning enterprise resource planning, customer relationships and supply chain management. The company has evolved from a database-focused business into a diversified technology giant, with a strong emphasis on cloud infrastructure and software-as-a-service offerings (SaaS refers to software delivered over the internet on a subscription basis, reducing the need for on-premise systems).
Oracle’s competitive edge lies in integrating advanced technologies such as artificial intelligence, analytics and cybersecurity across its platforms, enabling organisations to modernise operations and improve efficiency. Particularly attractive to CLDN is the stickiness of its customer base, due to how integral Oracle software becomes for its clients. As well as boosting pricing power – one of the aspects of the Quality Matrix – this ensures a high level of customer retention and resilience through business cycles.
Oracle’s disciplined buybacks and sustained dividend growth highlight its proven capital allocation, per the matrix, while ongoing investment in AI-driven cloud infrastructure strengthens its digital credentials and competitive positioning.
Recent newsflow for the company is covered on page 16.
Capital portfolio
CLDN’s public companies strategy is dominated by the £698m (as at 31 March 2025) capital portfolio.
Asset allocation
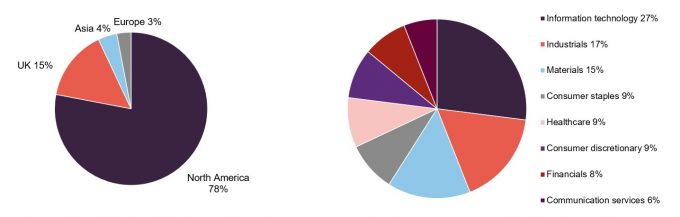
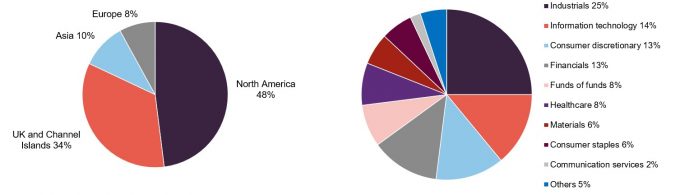
Figure 6: Split of capital portfolio by geography as at 31 March 2025
Figure 7: Split of capital portfolio by sector as at 31 March 2025
Source: Caledonia Investments
Source: Caledonia Investments
As shown in Figure 6, North American-headquartered companies dominate the capital portfolio, with a moderate exposure to the UK and negligible holdings elsewhere. The largest sector exposure, per Figure 7, is to technology, the majority of which is accounted for by Microsoft and Oracle, the two largest holdings (which have both rallied strongly since the end of March, as covered on page 15).
Top 10 holdings – capital portfolio
Figure 8: 10 largest holdings in capital portfolio as at 31 March 2025
| Holding | Business | First invested | Value (£m) |
|---|---|---|---|
| Microsoft | Software | 2014 | 73.6 |
| Oracle | Software | 2014 | 72.3 |
| Philip Morris1 | Tobacco and smoke-free products | 2016 | 64.8 |
| Watsco1 | Ventilation products | 2017 | 58.4 |
| Texas Instruments1 | Semiconductors | 2018 | 46.5 |
| Charter Communications | Telecommunications | 2017 | 40.4 |
| Thermo Fisher | Life sciences | 2015 | 38.7 |
| Moody’s Corporation | Financial services & analytics | 2022 | 38.3 |
| Hill & Smith | Infrastructure products | 2011 | 35.6 |
| Pool Corp | Pool distribution | 2024 | 31.9 |
Portfolio movements
Figure 9: Capital portfolio movements (£m) over one year to 31 March 2025
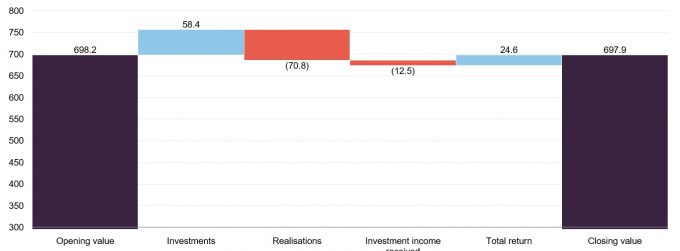
Source: Caledonia Investments, Marten & Co
During the year there was one new purchase, namely Pool Corp, which is explored in more detail above. British American Tobacco was the one complete sale.
There were partial sales during the year of Fastenal, Oracle and Watsco, in all cases crystallising gains after a strong run. All three stocks are covered later in the report.
Income portfolio
The income portfolio is a much smaller part of the public companies strategy, with a value of £267m (as at 31 March 2025).
Asset allocation
Figure 10: Split of income portfolio by geography as at 31 March 2025
Figure 11: Split of income portfolio by sector as at 31 March 2025
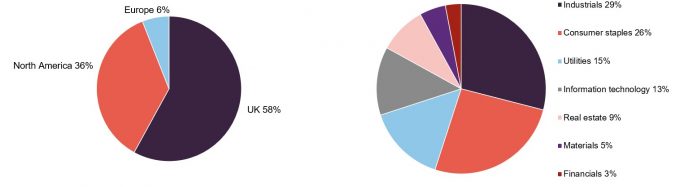
As a market dominated by companies in sectors with typically higher dividend yields, it is unsurprising that the UK is the largest geography in the income portfolio, as shown in Figure 10. North America makes up just over a third and Europe the remainder. The sector exposure, per Figure 11, is relatively diversified, with only a modest technology weighting, and holdings across areas that are renowned for paying steady income streams to investors, such as utilities and consumer staples (companies producing everyday goods, which tend to have stable demand).
Top 10 holdings – income portfolio
Figure 12: 10 largest holdings in income portfolio as at 31 March 2025
| Holding | Business | First invested | Value (£m) | Yield (%) |
|---|---|---|---|---|
| Philip Morris1 | Tobacco & smoke-free products | 2021 | 25.3 | 5.7 |
| National Grid | Utilities | 2015 | 20.9 | 5.6 |
| Unilever | Consumer goods | 2019 | 18.9 | 3.5 |
| Fortis | Utilities | 2020 | 18.5 | 3.8 |
| Watsco1 | Ventilation products | 2020 | 18.2 | 6.1 |
| Relx | Information &analytics | 2023 | 18.2 | 2.4 |
| Texas Instruments1 | Semiconductors | 2020 | 17.7 | 3.9 |
| SGS | Testing | 2020 | 16.8 | 2.4 |
| Sage Group | Software | 2024 | 16.6 | 1.6 |
| Fastenal1 | Industrial distribution | 2020 | 15.4 | 4.3 |
Portfolio movements
Figure 13: Income portfolio movements (£m) over one year to 31 March 2025
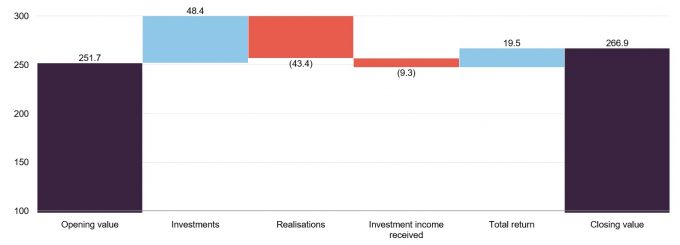
Source: Caledonia Investments, Marten & Co
There were three new positions initiated in the income portfolio over the year: Sage, Howdens and Croda.
Sage – a leading accounting, human resources, and payroll software provider to small and medium-sized enterprises. The company has a record of strong execution, with solid recurring revenues. Its AI-powered offerings are seeing strong demand, with Sage Copilot – launched in 2024 – already serving 40,000 UK customers. Similarly, Sage Business Cloud is achieving double-digit revenue growth. Following a £400 million share buyback in late 2024, Sage extended the programme by an additional £200 million in mid‑2025, while raising its interim dividend by 7%.
Howdens – the UK’s leading trade kitchen supplier. Howdens has a proven ability to generate strong cash returns, defend margins and expand market share even in a subdued UK kitchen and joinery market. With gross margins above 60% and a nationwide depot expansion strategy, Howdens offers a combination of operational resilience, disciplined capital allocation and growth potential. The company recently committed to a £100m share buy-back programme, and the share price has risen by around 30% since April.
Croda – the speciality chemicals company, which is also held in the capital portfolio. The shares have been notably weak due to operational deleveraging amid demand headwinds in its end markets, and this weakness presented an attractive entry point. Croda is a long-term buy, given its record of disciplined cost cutting and growth in its higher‑margin divisions, as well as consistent dividend increases. Its ongoing transformation plan includes a target of £100m annualised cost‑saving by 2027 and an asset optimisation programme that is already yielding benefits. Demand in the Consumer Care division, together with resilient Life Sciences performance, underpins confidence in Croda’s ability to return to growth.
Three holdings were exited over the year: DS Smith – following the announcement of the agreed offer from International Paper – Pennon Group, and Reckitt Benckiser.
Asset allocation – whole portfolio
Figure 14: Split of portfolio by type as at 31 August 2025
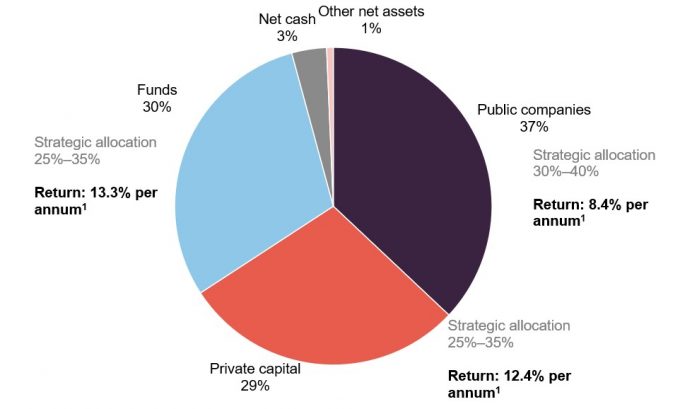
Source: Caledonia Investments. Note 1) average over 10-year period ended 31 March 2025
There is little change to CLDN’s overall allocation from the time of our last note in April. Private capital and net cash allocations have reduced slightly, with public companies increasing from 33% to 37%.
Sale of Stonehage Fleming
CLDN announced on 2 September, as this note was being written, that it had agreed terms for the sale of its largest overall holding, Stonehage Fleming, to Miami-based Corient Private Wealth. CLDN had a large minority stake of 36.7% in the multi-family office (a wealth management firm that provides investment, financial, and administrative services to multiple high-net-worth families under one structure), held within the private capital pool, and will receive £251m when the deal closes in the first half of 2026. A further £37m will be paid in two tranches six months and a year after completion. Another £9m may be received if Stonehage hits three-year revenue targets under its new owner.
Including dividends received, CLDN says it will make a 3.2x return on its initial £90m investment in 2019, including a £67m or 30% uplift from its £221m value at 31 March. The proceeds will be held on deposit for future reinvestment.
This is clearly a very successful result for CLDN, and is another example of its investment process securing excellent outcomes for shareholders over the medium and long-term.
The following sections all use data from 31 August, before the Stonehage sale was announced.
Figure 15: Split of CLDN portfolio by geography as at 31 August 2025
Figure 16: Split of CLDN portfolio by sector as at 31 August 2025
Source: Caledonia Investments
Source: Caledonia Investments
Top 10 holdings – whole portfolio
Figure 17: CLDN 10 largest holdings as at 31 August 2025
| Business | Value (£m) |
% of NAV 31/08/25 | % of NAV 31/03/25 | Change (%) |
|
|---|---|---|---|---|---|
| Stonehage Fleming | Family office services | 222.4 | 7.6 | 7.6 | n/a |
| Cobepa | Investment company | 196.4 | 6.7 | 6.6 | 0.1 |
| AIR-serv Europe | Forecourt vending | 173.2 | 5.9 | 6.8 | (0.9) |
| Butcombe Group | Pubs, bars and inns | 137.5 | 4.7 | 4.7 | n/a |
| Oracle | Software | 101.9 | 3.5 | 2.4 | 1.1 |
| Microsoft | Software | 95.0 | 3.2 | 2.5 | 0.7 |
| Phillip Morris | Tobacco & smoke-free products | 90.6 | 3.1 | 3.1 | n/a |
| HighVista Strategies | Funds of funds | 86.7 | 3.0 | 3.4 | (0.4) |
| Texas Instruments | Semiconductors | 77.6 | 2.7 | 2.2 | 0.5 |
| Axiom Asia funds | Fund of funds | 65.8 | 2.2 | 2.5 | (0.3) |
| Total | 1,247.1 | 42.6 | 51.1 |
As would be expected for a fund with a long-term approach to investments, there have been limited changes to the makeup of the top 10 holdings since our note published earlier in the year (which used data as at 31 March). Texas Instruments is the one new entry, and is explored in more detail below. It has replaced Watsco.
Oracle has risen from tenth- to fifth-largest holding due to a spectacular rally in the shares over recent months. This was driven by quarterly earnings that were well ahead of analyst expectations, and standout future guidance. This in turn was largely due to Oracle’s Cloud Infrastructure (OCI) and AI offerings; the former is growing by more than 50% year-on-year. The company has signed a $30bn cloud services agreement as part of its Stargate venture with OpenAI and SoftBank, as well as a strategic partnership agreement with Google Cloud, enabling Oracle to offer Google’s Gemini AI models through its OCI platform. Oracle is covered in more detail on page 8.
Although Oracle’s returns are particularly striking, the wider US technology sector has risen strongly in recent months, which enabled Microsoft to climb from eighth to sixth position in CLDN’s top ten.
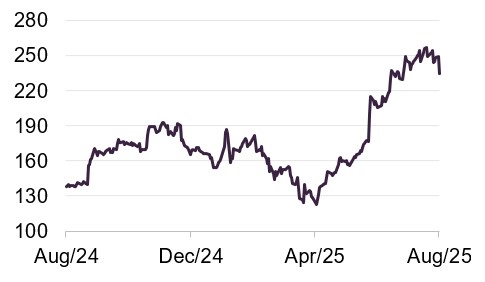
Texas Instruments
Figure 18: Texas Instruments (USD)
Source: Bloomberg
Texas Instruments (TI, ti.com) is a leading US-based semiconductor designer and manufacturer, specialising in analog chips and embedded processors. Headquartered in Dallas, TI’s technology has deep roots in innovation, from pioneering the integrated circuit and handheld calculator to powering industrial, automotive and consumer electronics with reliability and scale.
TI has moved into CLDN’s overall top 10 holdings due to a recent rally, which has seen the share price rise by a third from its April low. The company broke a nine-quarter streak of declining sales and earnings when it reported results that month, with management also presenting optimistic future revenue and earnings guidance. In addition, as a domestic manufacturer, TI secured exemptions from President Trump’s potential 100% semiconductor tariffs, and is reportedly set to increase prices across 10,000-20,000 products by between 20%-50%, providing a significant boost to margins.
Longer-term, TI has strategically increased its US manufacturing footprint, with the first fab at its Sherman mega site (SM1) due to begin production later this year. This is one of three major manufacturing sites that TI is building in the US as part of its $60bn investment in domestic semiconductor capacity. The company’s ongoing shift to more cost‑efficient 300mm fabrication is expected to significantly boost free cash flow by 2026 (larger wafers reduce cost per chip). The company also has an unbroken record of 50 years of dividend payouts.
Performance
CLDN has beaten both the FTSE All-Share Index and inflation over 10 years.
The performance of CLDN is not benchmarked against an index or peer group. Nonetheless, the fund has set itself a target of generating long-term compounding real returns that outperform inflation by 3%-6% over the medium-to-long term, and the FTSE All-Share Index over 10 years.
Figures 19 and 20 show that CLDN has surpassed both these objectives, with 10-year returns impressively ahead of both UK equities and inflation. For a fund with such a clear long-term focus, this very strong long-term performance is particularly important. For the purposes of this report, we have used the HSBC FTSE All-Share Index Fund Class C accumulation units, which seek to track the returns of the FTSE All-Share Index. As a measure of inflation, we have used UK CPIH (the consumer prices index including owner-occupiers’ housing costs, a broader inflation measure than standard CPI), which is the consumer prices index including owner-occupiers’ housing costs.
Over 10 years to 31 March 2025, the public companies pool specifically delivered an 8.4% annualised return, split 10.2% for the capital portfolio and 4.6% for the income portfolio.
As explained in more detail on page 17, whilst NAV returns have been very strong, those to shareholders have been held back by the fund’s discount to NAV, which we believe to be unjustifiably wide.
Figure 19: CLDN NAV total return performance relative to HSBC All-Share tracker and UK inflation (CPIH) over 10 years ended 31 July 2025
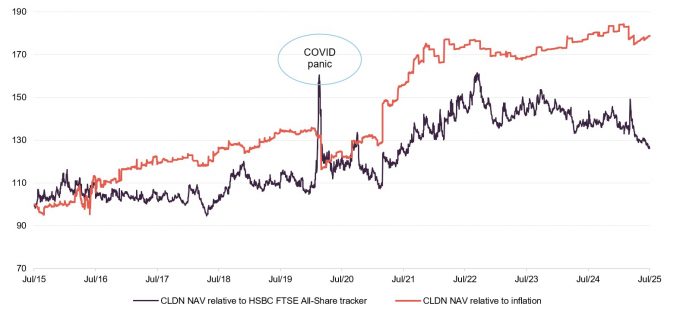
Source: Bloomberg, Marten & Co
Figure 20: CLDN total returns for periods ending 31 July 2025
| 3 months (%) | 6 months (%) | 1 year (%) | 3 years (%) | 5 years (%) | 10 years (%) | |
|---|---|---|---|---|---|---|
| Share price | (0.9) | (2.3) | 0.2 | 1.0 | 59.0 | 101.5 |
| NAV | 2.9 | (0.4) | 3.8 | 17.1 | 85.5 | 147.6 |
| Inflation (UK CPIH) | 0.6 | 2.5 | 4.2 | 14.3 | 26.8 | 38.5 |
| HSBC FTSE All-Share tracker | 9.5 | 8.8 | 12.2 | 34.9 | 78.0 | 96.2 |
| MSCI ACWI | 13.0 | 1.3 | 12.5 | 40.8 | 81.0 | 207.2 |
| Inflation plus 3% per annum1 | 1.3 | 4.0 | 7.2 | 24.4 | 46.0 | 84.4 |
| Inflation plus 6% per annum1 | 2.0 | 5.4 | 10.2 | 35.1 | 67.5 | 143.6 |
Discount
CLDN’s persistent discount seems unjustified.
We have written about CLDN’s persistent discount to NAV in all of our previous notes, and the position remains broadly unchanged. Over the 12 months ended 31 August 2025, the range was 28.1% to 39.9%, with an average of 33.6%. The current discount is 32.2%, versus 35.5% at the time of our previous note in April. It is encouraging to note the small discount narrowing but we continue to view the discount as far too wide, given CLDN’s strong long-term record and the quality of the holdings across the strategies. We still expect it to narrow over the long term, which is in common with the views of its board and managers.
Figure 21: CLDN discount over five years ended 31 August 2025
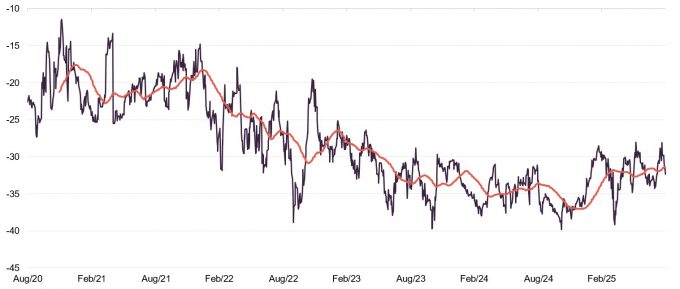
Source: Bloomberg, Marten & Co
The board actively seeks to address the continued discount. As we have covered in previous notes, shareholders approved a “Rule 9 waiver” under the Takeover Code, allowing the Cayzer family’s share of the trust to increase above 50% without the family being obliged to make a takeover bid. At the shareholder meeting in December, it was approved that the company can repurchase up to 5% of its shares in issue.
In addition, the board proposed a 10-for-1 share split, that was implemented in July 2025. Through reducing the nominal price of each share, the trust is more accessible, improving liquidity and potentially reducing bid-ask spreads (the difference between buying and selling price in the market). It should also make smaller shareholdings more feasible, potentially attracting a broader set of investors.
The board also changed the balance between the interim and final dividends. By increasing the interim dividend to be closer to 50% of the total, income is more evenly spread during the year, which again should increase the attraction of the company’s shares.
Figure 22: CLDN share buybacks by month
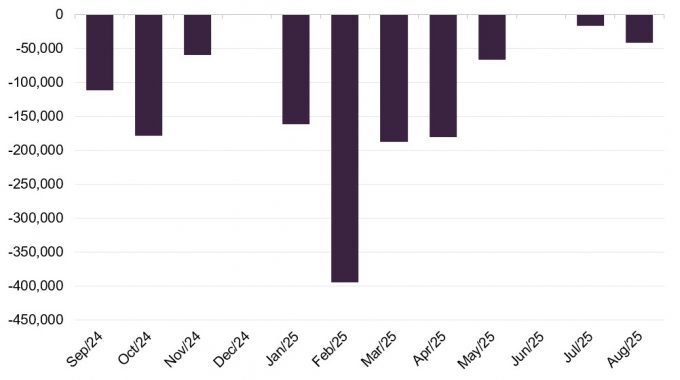
Source: Caledonia Investments. Note: repurchases after the 10-for-1 share split on 25 July have been adjusted to ensure comparability.
As shown in Figure 22, the board has actively used this approval to buy back shares. Over the past year, 1,398,885 shares have been repurchased (note that, due to the 10-for-1 share split in July, figures since then have been adjusted to ensure comparability), which enhances NAV for shareholders and provides liquidity to those wanting to sell. We fully expect this to continue, albeit the rate has slowed somewhat in recent months.
Previous publications
Readers interested in further information about CLDN may wish to read our previous notes listed below. You can read them by clicking on the links in Figure 23 or by visiting our website.
Figure 23: QuotedData’s previously published notes on CLDN
| Title | Note type | Date |
|---|---|---|
| Time, well invested | Initiation | 15 July 2024 |
| Addressing the discount | Update | 9 December 2024 |
| Playing the long game | Update | 14 April 2025 |
IMPORTANT INFORMATION
Marten & Co (which is authorised and regulated by the Financial Conduct Authority) was paid to produce this note on Caledonia Investments Plc.
This note is for information purposes only and is not intended to encourage the reader to deal in the security or securities mentioned within it. Marten & Co is not authorised to give advice to retail clients. The research does not have regard to the specific investment objectives financial situation and needs of any specific person who may receive it.
The analysts who prepared this note are not constrained from dealing ahead of it but, in practice, and in accordance with our internal code of good conduct, will refrain from doing so for the period from which they first obtained the information necessary to prepare the note until one month after the note’s publication. Nevertheless, they may have an interest in any of the securities mentioned within this note.
This note has been compiled from publicly available information. This note is not directed at any person in any jurisdiction where (by reason of that person’s nationality, residence or otherwise) the publication or availability of this note is prohibited.