GCP Infrastructure
Investment companies | Update | 17 August 2023
Merger to unlock compelling value?
GCP Infrastructure Investments (GCP) has announced a potential three-way merger between it, GCP Asset Backed Income (GABI), and RM Infrastructure Income (RMII). As we explore in this note, this has the potential to address some of the issues that may have given rise to GCP’s exceptionally wide discount.
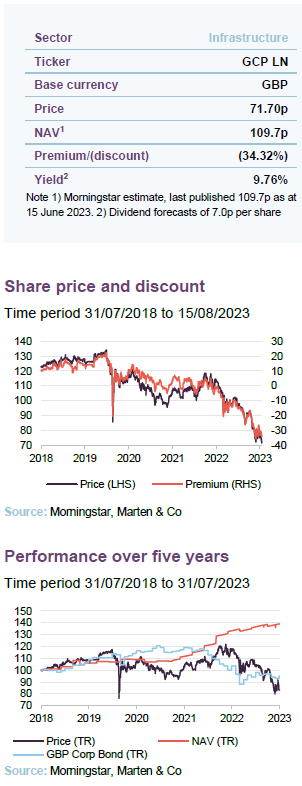
Following a period of impressive NAV growth through 2022, GCP’s half-yearly report for the six months ending 31 March 2023 and the recently published end-June NAV showed a period of consolidation for the fund, as falling energy prices and higher discount rates have weighed on returns. GCP has moved to trade on a 34.3% discount and a 9.76% yield. Despite this, the underlying performance of GCP’s assets has continued to improve, and the outlook for investors remains as promising as ever thanks to a broad range of thematic tailwinds.
Public-sector-backed, long-tern cashflows from loans used to fund UK infrastructure
GCP aims to provide shareholders with regular, sustained, long-term distributions and to preserve capital over the long term by generating exposure primarily to UK infrastructure debt and related and/or similar assets that provide regular and predictable long-term cashflows.
Potential three-way merger
On 11 August 2023, GCP and GABI announced that the boards of the two funds had agreed terms for a merger. Under the proposals, this would be achieved via a solvent winding-up of GABI and the transfer of its assets to GCP in exchange for the issue of new ordinary shares in GCP. The number of shares issued would be determined on a formula asset value (FAV) basis. FAVs are calculated based on the NAV of each company on an agreed calculation date, less each party’s transaction costs (the adviser proposes contributing £1m towards these).
The merger would create a larger, more liquid, and efficient fund.
We feel that the merger would create a larger, more liquid, and efficient fund, benefitting the shareholders of both companies.
The focus of the enlarged vehicle in the two-year period following completion would be to reduce the combined company’s existing leverage from about £150m to about £50m and to return £100m of capital to shareholders in lieu of a cash exit offer. That would absorb about £200m of the company’s cash resources, cash which would flow from natural loan maturities and prepayments.
The merger would mean that the enlarged GCP would have a shorter weighted average loan life due to the considerably lower duration of GABI’s portfolio. Consequently, it would be more agile and able to re-invest in accordance with the revised investment policy (discussed on page 23) at prevailing market rates (which are higher now than at any point during the life of GCP), at the same risk level, more quickly than it could prior to the proposals.
A larger fund may be less subject to selling pressure from wealth managers.
The increased liquidity of the fund, which would have a NAV of around £1.35bn, could also reduce some of the short-term selling pressure on the company’s shares from larger wealth managers who, as a result of their own mergers, are increasingly obsessed with liquidity.
In addition to its shorter duration, the GABI portfolio is invested in a range of different asset classes outside of the immediate remit of GCP, particularly asset finance, which makes up 12% of the fund, and property, which makes up 46%. Under the revised investment policy, some of these property assets will become a permitted exposure within GCP’s core portfolio.
GABI also has some problem loans that it has identified. We are comforted that both sides will revalue their portfolios ahead of the merger and any necessary impairment to valuations should be reflected in FAVs.
£0.8m of annual cost savings identified.
On completion of the merger, company costs would be spread across a larger asset base, resulting in a lower ongoing expense ratio, with cost savings projected to be about £0.8m per annum. In addition, GCP would adopt a new tiered fee structure, which we outline on page 24.
RM Infrastructure Income
In addition to the GABI merger, GCP’s board has also announced that it is in separate discussions with the board of RMII with the intention of agreeing a potential merger of the enlarged GCP with RMII. A further update for these developments will be provided when more information is available.
One attraction of RMII is that its portfolio also has a much shorter duration than GCP’s, permitting an acceleration of the portfolio re-shaping/capital returns discussed above. It would be cheaper all round if the RMII and GABI mergers could be done simultaneously.
Recent figures
Half-yearly results to 31 March 2023
Total income for the period was £35.6m.
Over the six-month period ended 31 March 2023, GCP’s NAV per share fell marginally from 112.80p to 112.24p, a drop of 0.5% while shares fell from 97.8p, to 85.2p, a drop of 12.9%. Total NAV return was 2.7% while shareholder total return was -9.7%.
Dividends continued to run at an annualised pace of 7.0p per share, so that GCP is trading at a weighted average annualised yield of 9.8%. On an adjusted earnings basis, dividend cover was 1.1 times, a slight improvement from the last interim report.
Operationally, the company has continued to execute well, as elevated energy prices boosted the performance of GCP’s renewable investments; particularly those able to fix higher prices under power purchase agreements. Total income for the period was £35.6m, and whilst this is well down on the previous year’s £117.6m, the comparative period last year included material positive revaluations resulting from significantly increased electricity price forecasts, which were not expected to be brought forward into 2023. In addition, income for the fund remains well ahead of pre-pandemic returns.
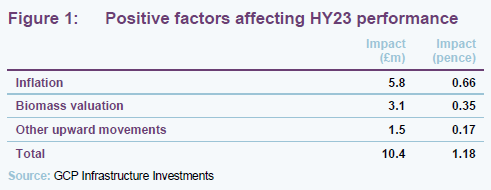
As shown in Figure 1, inflation was the leading positive contributor to GCP’s NAV during the six months to March 2023, due to higher inflation actuals and a higher OBR medium-term inflation forecast. An increase in the valuation of a biomass asset was the second-largest contributor, arising from higher electricity prices along with the implementation of cost efficiencies.
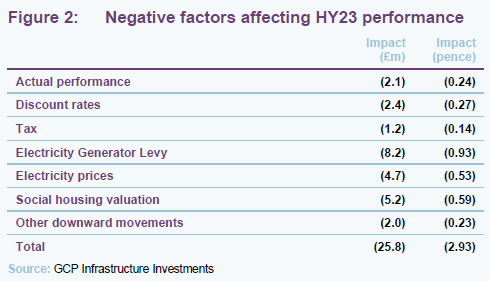
On the downside, the largest detractors were the electricity generation levy, and valuation adjustments reflecting continued uncertainty in the social housing sector. Electricity price hedging arrangements had a significant impact on overall returns, offsetting £11.9m worth of negative valuation movements. In total, these valuation shifts resulted in a net fall of just £5.5m, which is commendable in light of the current macro volatility.
Q2 2023 NAV update
GCP provided a second-quarter update for the period ended 30 June 2023, which highlighted a further 2% fall in NAV. The primary driver of this movement was the increase in discount rates, which was applied across the portfolio’s three sectors: supported living, PFI, and renewable energy. The increased discount rates reflect the current higher inflation and base rate environment, and recent market transactions that suggest the rising cost of debt has started to impact equity pricing. This has resulted in a c.40bps increase to the weighted average discount rate used by the company to value its portfolio, leading to a decrease of c.2.5 pence per ordinary share.
Further reductions in electricity prices also weighed on actual and forecast cash distributions to the company from its renewables investment portfolio, driven by decreases in short-term power prices. This was partially offset by an uplift in long-term forecast power prices and continued execution of the company’s hedging arrangements. In aggregate, movements in electricity price forecasts negatively contributed c.0.4 pence per ordinary share.
Operational performance drives long-term upside
GCP’s ability to preserve capital value is highlighted by aggregate annualised downward revaluations of just 0.31% since launch.
GCP’s focus on lending to assets/projects with predictable, Government-backed cashflows has worked in its favour over the 13 years since launch. GCP’s ability to preserve capital value is highlighted by aggregate annualised downward revaluations of just 0.31% over this period. That is much lower than the annualised default rate on sterling corporate loans, and should give investors comfort as they navigate what continues to be a difficult period for the UK economy.
Whilst not reflected in the share price, operationally the fund has also continued to execute at a high level, with profit over the most recent financial year more than tripling from its pre-pandemic peak. Energy price volatility has been a leading contributor, and this was accelerated by the unfortunate events taking place in Ukraine, among other things; however, the returns vindicate a long-term allocation to the renewable energy transition, which was identified by manager Phil Kent as one of the best opportunities to provide secular upside for the fund.
This ability for GCP to generate sustainable cashflows from its existing asset base becomes particularly relevant at the market’s current juncture, given the possibility of a structural reset in interest rates. With short-term Government debt now yielding roughly the same as infrastructure sector averages, there is reduced incentive to invest solely in alternative income and the fall in risk premiums over the last 12-18 months explains much of the recent capital flight out of the sector.
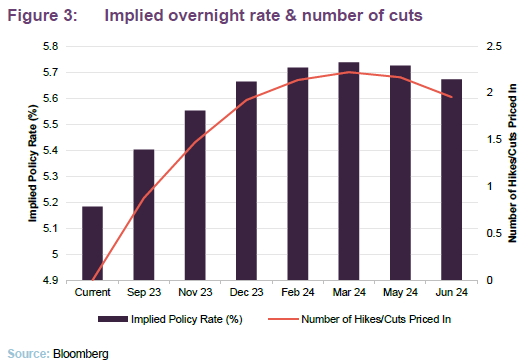
Whilst this creates challenges in the short term, interest rates are expected to fall over the next 12 to 18 months, as highlighted in Figure 3, and widening discounts offer investors attractive entry points for funds such as GCP that are able to maintain long-term structural cashflows and grow NAV through consistent operational improvement.
Market backdrop
Renewable energy infrastructure remains the main focus of the fund as investment advisor Philip Kent continues to see a disconnect between the Government’s stated aims for infrastructure investment, in particular around the decarbonisation of the economy in order to meet the legally binding net zero targets, and the investment required to deliver these goals.
According to the Independent Committee for Climate Change, the investment required to achieve net zero is significantly greater than the actual private and public sector investment made or planned to date. Phil believes that this will create opportunities for the company to support the development of new infrastructure. In addition, he believes there is an increased emphasis being placed on energy security which should ensure a continuation of policy support for renewable assets.
GCP’s portfolio is largely focused on availability or contracted revenues so the performance and valuation of the portfolio is not directly correlated to economic activity. That being said, the investment adviser has outlined a variety of prevailing macro factors that are influencing the outlook for the wider renewable energy sector; a mixture of both positive and negative factors which may offer greater upside potential, but also heightened volatility.
Power prices
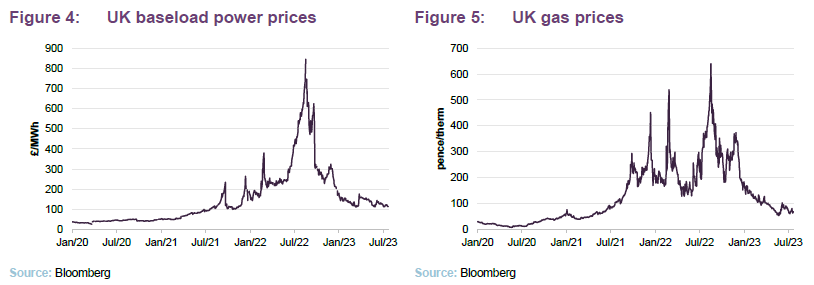
The last few years have proved to be a remarkably volatile period for energy prices which have been impacted by a raft of factors in addition to the pandemic slow down and Ukrainian invasion, including below-average production from wind and hydro resources, and reduced output from the French nuclear fleet. Volatility has begun to recede over the last few months, as shown in Figures 4 and 5; however, with the issues facing global energy production, markets appear to have priced a structural increase in long-term prices going forward. As we have discussed, GCP has been positively impacted by higher electricity prices, particularly relating to the net cash flows expected from renewable energy assets.
There do remain risks, however, particularly regarding the volatility of these prices and the potential impacts of energy switching towards other sources, including LNG. The investment adviser has successfully managed these risks through various hedging programmes over the last few years, as noted on page 4, and continues to review opportunities to hedge electricity market prices to both lock in attractive price levels relative to the original investment forecasts, and mitigate volatility in NAV.
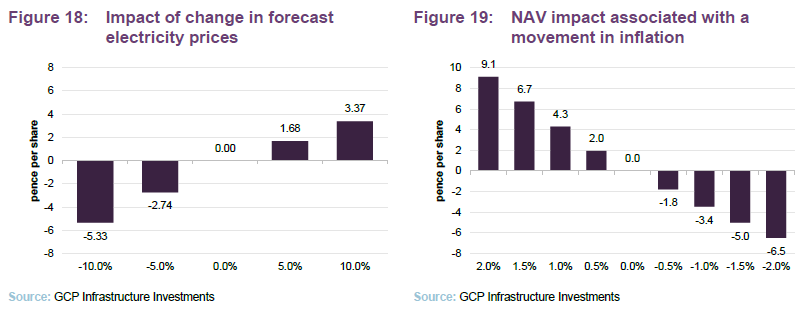
The sensitivity of GCP’s NAV to power prices is shown in Figure 18 on page 16. Phil notes that forecasts of power prices two and three years out appear to be rising.
Inflation
47% of GCP’s portfolio had some inflation linkage in returns.
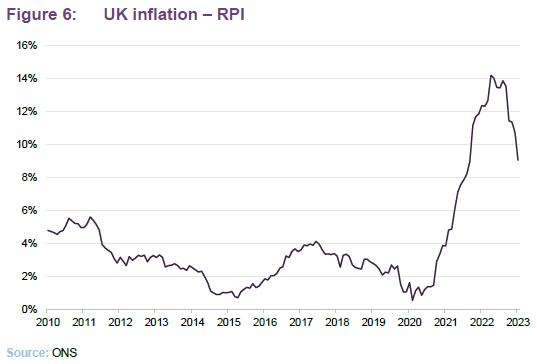
Broadly speaking, higher inflation is a positive for GCP, bearing in mind that at end March 2023, c.47% of its portfolio had some inflation linkage. In essence, the fund offers investors a way to purchase an inflation-linked, fixed-income strategy without purchasing conventional inflation-linked bonds, which offer lower returns. This inflation linkage is structured as a direct link between the return and realised inflation (relevant to the supported living assets and certain renewables) and/or a principal indexation mechanism that increases the principal value of the company’s loans outstanding by a share of realised inflation over a pre-determined strike level (typically 2.75% to 3.00%).
For those assets exposed to inflation, the current market environment does have some negative impacts, particularly related to input costs, which have risen considerably for the company’s anaerobic digestion investments. Inflation is also affecting capex costs and this needs to be factored into GCP’s assessment of the profitability of potential new investments.
Figure 19 on page 16 summarises the change in interest accruals and potential NAV impact that would be associated with a movement in inflation.
UK Government policy
As shown in Figure 2 on page 5, the Government’s energy profits levy had a tangible effect on GCP’s profitability. The levy, which was discussed in detail in our most recent note and came into effect on 1 January 2023, runs until 31 March 2028. It requires all non-fossil fuel generators generating electricity from nuclear, renewable, biomass, and energy from waste sources to pay a tax of 45% of their excess revenue from sales of power generated in the UK above a level of £75/MWh from 2023 to April 2024, and thereafter adjusted each year in line with the change in inflation (as measured by CPI) on a calendar-year basis.
Following the announcement of the level in November 2022, the investment adviser estimated the expected valuation impact on its 30 September 2022 NAV would be 1.50 pence per share. In December 2022, when the full details of the levy were announced, the actual impact of the tax was applied to the valuation of the portfolio. This impacted the NAV by 0.93 pence per share at 31 December 2022. The difference in the estimated and actual impact arose from the manner of the application of the levy to groups, demonstrating that the assumptions used were broadly accurate.
Even with the effects of the levy, broader economic trends and higher energy prices are still a net benefit for GCP and will likely provide a long-term tailwind. The fund will be able to leverage both the public and private investment necessary to meet the UK’s current legally binding climate goals. The UK Government’s 2023 Green Finance Strategy outlines a framework for its transition to a low-carbon economy, and estimates that £50–£60bn of capital each year will be required to deliver these goals.
The company has already benefitted from one of its portfolio businesses being awarded a grant under the Net Zero Hydrogen Fund, which was set up to support the development and construction of low-carbon hydrogen plants. The grant will benefit a wind farm located in Northern Ireland. A feasibility study has been undertaken in partnership with a local cement manufacturer. This presents the potential to generate additional revenue alongside a life extension for the wind farm, and also to help decarbonise an intensive manufacturing process by producing low-carbon cement. If the study is successful, it is likely to both improve the returns on an existing investment and provide further attractive investment opportunities.
Other assets
In addition to its renewable energy exposure, GCP’s portfolio also includes around £260m worth of PPI/PFI investments, accounting for roughly 23% of AUM. However, the departure by the UK Government and the devolved governments from PPP models has all but ended primary investment opportunities in this area. The investment adviser has continued to review secondary opportunities when presented, but they are typically small in scale and subject to competitive bidding processes. Further possibilities do exist for alternative funding models, including licence-based models such as the regulated asset base approach when applied to particular projects, or offshore or onshore transmission licensing frameworks.
Around 11% of the portfolio is currently invested in supported living, although (as we have discussed in previous notes) GCP stopped making new investments into the sector in 2018 as an increasing number of investors put pressure on potential returns while adding to the associated risks. Since then, GCP has actively reduced its exposure to the sector.
Risk analysis
Each year in the company’s annual report, GCP’s investment advisor, Gravis Capital releases a risk matrix which highlights its perception of risks across the various asset classes that GCP invests in. This is shown in Figure 7.
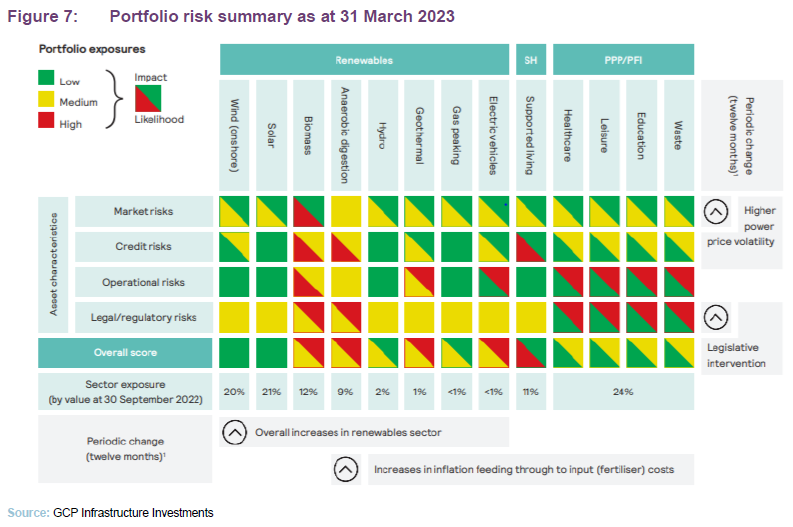
In GCP’s annual report from September 2022, Gravis noted that there has been an increase in risk across all four asset characteristics from the previous year. The major contributors to this were:
- the UK Government’s announcement of a levy on the profits made by electricity generators, which we described earlier in this note. This has clearly increased the legal and regulatory risk for any strategy exposed to UK electricity generators;
- volatility increasing in parallel, despite the higher wholesale prices for electricity. This has led to greater uncertainty to the long-term outlook for the UK power prices, as well as the overall market structure going forward;
- anaerobic digestion projects having been hit by higher input costs – particularly fertiliser – which has hit profitability;
- the collapse of a number of electricity suppliers that acted as off-takers for renewable projects, due to the costs associated with hedging their energy prices. Fortunately, GCP has no direct exposure to any impacted supplier; and
- the wider renewable energy sector having also been hit by the global supply chain issues, with there being less availability of replacement parts. However, this has yet to materially impact output levels.
The company also provides a semi-annual risk assessment and a review of the principal risks and uncertainties in its interim report, which relates to the period ended 31 March 2023. In addition to the existing principal risks and uncertainties discussed above, which are expected to remain relevant to the company for the next six months, the updated review now considers the share price discount to NAV to be a new principal risk.
The interim risk review also noted several other changes over the period.
- The investment due diligence risk has increased due to rising uncertainty around interest rates and inflation.
- Risks associated with the availability of suitable investments and reinvestment have decreased thanks to the company’s active pipeline and investment activity made during the period totalling £75.1m.
- Risks relating to the performance of – and reliance on – subcontractors have increased due to ongoing inflationary pressures and supply chain disruption.
Asset allocation
At 31 March 2023, there were 49 investments in GCP’s portfolio. There has been one new investment made since we published our last note, which was a new senior loan of £7.5m to finance the purchase of a fleet of 150 electric taxis. This is discussed in more detail on page 13. The average annualised portfolio yield at 31 March 2023 was 7.9%, and the portfolio had a weighted average life of 10 years.
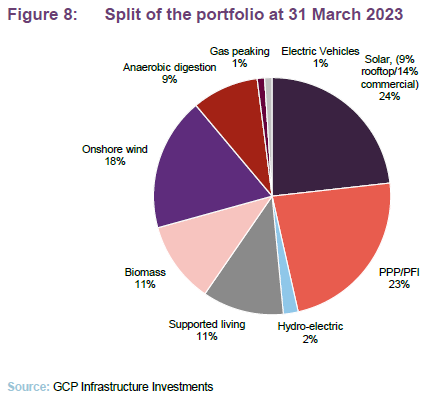
At 31 March 2023, only 1% of the portfolio was exposed to assets in their construction phase. Historically, having some exposure to these projects has allowed GCP to capture higher returns; however, limiting this has significantly de-risked the portfolio, factoring in the impact of inflation on financing costs, raw materials, and supply chains.
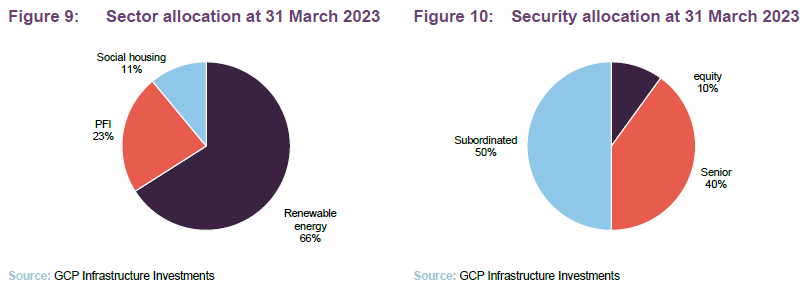
Figure 11 looks at GCP’s sources of income. Renewable energy exposure accounted for 66% of income at 31 March 2023. Roughly 47% of loans by value benefit from inflation protection.
Top 10 investments
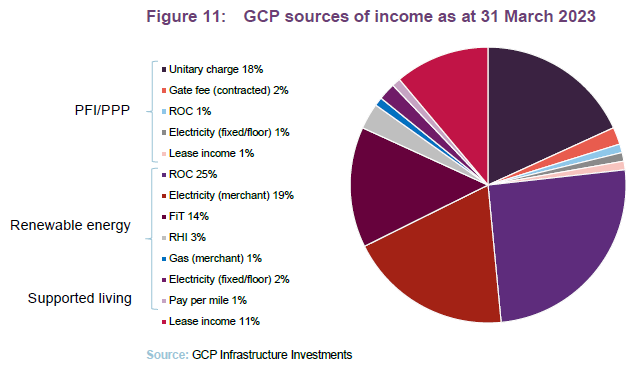
Changes in GCP’s top 10 largest investments since our last note have been minor, with GCP Green Energy 1 replacing GCP Solar 2 in the list.
Recent investment activity
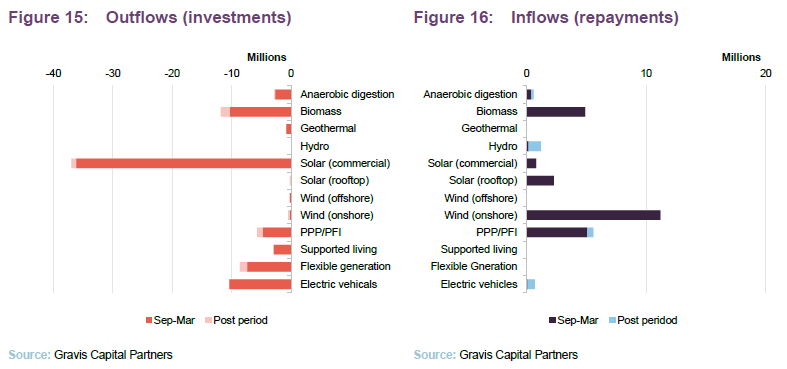
During the six-month period ended 31 March 2023, the company made seven advances totalling £75.1m: £7.5m under one new facility and £67.6m under existing facilities, increasing the number of investments to 49.
These transactions include an advanced £46.4m repayment of third-party senior debt secured against a portfolio of commercial solar projects and a portfolio of renewable and PPP assets. The company also advanced £7.4m against gas peaking plants being brought into operation by a borrower and a further £1.0m to support the ongoing development and optimisation of three anaerobic digestion plants in the period to December 2022.
Two investments totalling £10.5m were made in the electric vehicle sector in February 2023. This included a new senior loan of £7.5m to finance the purchase of a fleet of 150 electric taxis and a follow-on investment of £3.0m to grow an existing fleet. The new borrower benefitted from Government grants to reduce the effective loan to value ratio against the vehicles.
The company received 24 repayments totalling £25.0m; all of which were scheduled repayments.
Figures 15 and 16 show the full breakdown of GCP’s recent investment activity up until 31 March 2023 in addition to further advances of £2.1m and received repayments of £2.3m which were made post period end.
Pipeline of potential new investments
Allowing for the investments discussed above, GCP has an active pipeline of at least £400m, which we discussed in detail in our last note. Almost half of this concerns the opportunity to finance the construction of a portfolio of c.400MW of batteries in the UK. This is a compelling opportunity identified by the manager with an indicative return of around 8%. Additional opportunities include financing the aggregation of a farming and processing platform to produce a plant-based packaging material that is an alternative to single-use plastics, along with a range of other, more traditional, wind and solar investments.
The investment manager remains enthusiastic about the pipeline, due to the range of opportunities that can provide risk-adjusted returns which would be accretive to dividend coverage. However, the company also recognises that the use of cash resources for pipeline investments must be weighed against repayment of its RCF and/or the repurchase of shares. The latter has become an increasingly attractive option, given the discount at which the company’s shares are currently trading, which the manager believes does not reflect the fund’s ongoing execution. The assessment of both these opportunities is subject to ongoing evaluation by the board.
Conservative assumptions
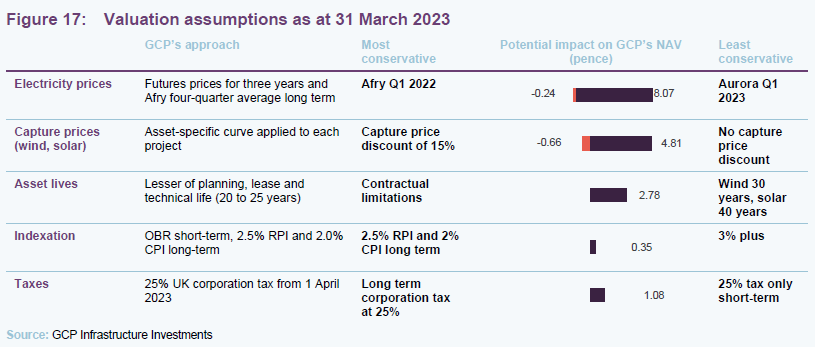
Figure 17 summarises the key assumptions used in forecasting cash flows from renewable assets in which the company is invested, and the range of assumptions that the investment adviser observes in the market. As we have highlighted in several of our prior notes, GCP’s advisers take a conversative approach to valuations, valuing companies towards the lowest value methodologies available to them.
The net effect of this is that, were GCP to assume the most conservative assumptions in every category, the end June NAV of 112.24p would be reduced to 111.5p. By contrast, were GCP to assume the least conservative assumptions in each category, the NAV would have been 129.49p.
Such an approach is admirable, as it reduces the likelihood and severity of any unexpected shocks to GCP’s NAV, e.g. a sharp reversal in wholesale gas prices. Note that valuation metrics do not affect either the dividend pay-out or the share price yield.
Sensitivities
The investment adviser also provides a sensitivity analysis for its cash flows. Figures 18 and 19 show the impact of changes in power prices and changes in its base case inflation forecast.
Performance
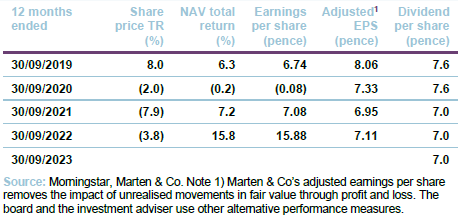
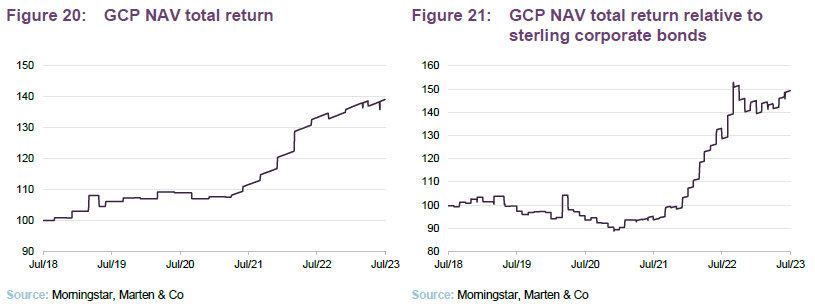
As Figure 20 shows, GCP’s NAV has rallied strongly since its plateau through the latter half of 2020/21, thanks predominantly to rising power prices during the period, with returns through 2022 the highest generated in the past five years.
Figure 21 shows the performance of the fund compared to the sterling corporate bond index, which acts as a de facto benchmark as the constituents are comparable with GCP’s investments portfolio. This figure provides another illustration of tangible returns generated by the GCP portfolio above direct market comparables.

Peer group
Up-to-date information on GCP and its peers is available on the QuotedData website.
GCP sits within the AIC’s infrastructure sector, which is made up of four funds which invest predominantly in public/private partnership project equity (3i Infrastructure, BBGI, HICL and International Public Partnerships), two digital infrastructure funds (Cordiant Digital Infrastructure and Digital 9 Infrastructure) and one fund (Sequoia Economic Infrastructure, which, like GCP, invests primarily in infrastructure debt, but using a much broader definition of what constitutes infrastructure). We have excluded the Infrastructure India fund due to its risk profile, which does not align with the rest of the sector.
Outside of DGI9, which has suffered in part due to the ongoing rotation into higher-quality assets, GCP trades on the highest discount in the sector. This is despite offering one of the highest yields and an ongoing charge rate in line with the peer group median.
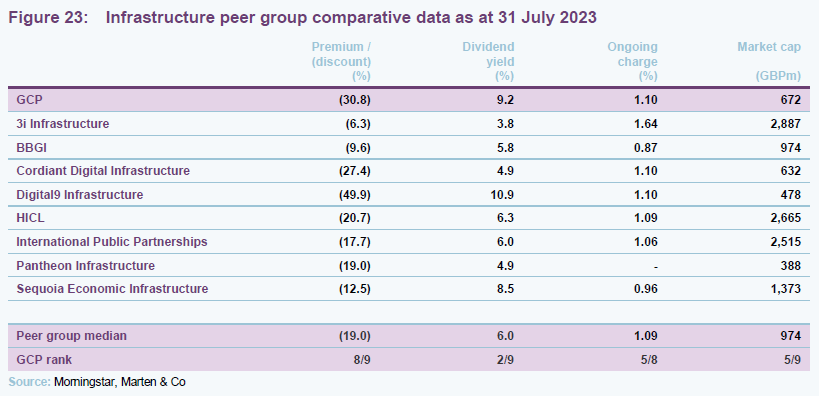
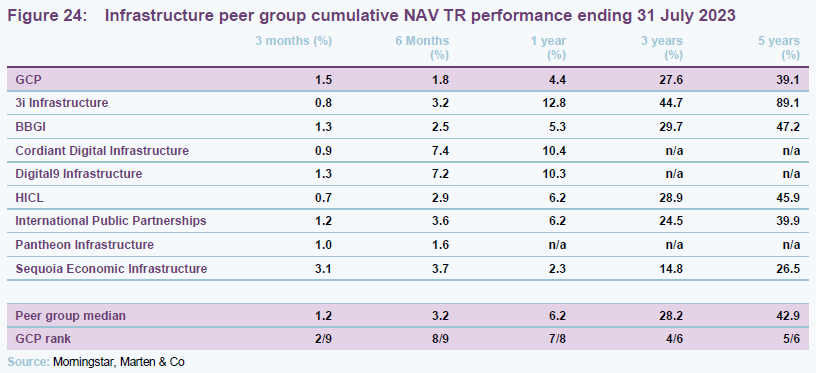
Recent NAV performance has been modest in relation to the wider sector, as shown in Figure 24, and this has weighed on GCP’s longer-term ranking, which has traditionally been towards the top of its peer group. Still, returns over the past three and five years remain closely aligned with the median.
The relative NAV growth can perhaps explain the widening discount compared to the rest of the infrastructure sector; however, this seems to place too much bearing on short-term headwinds. This includes the electricity levy and social housing impacts, while not accounting for the long-term structural drivers, particularly the secular trajectory of power prices and thematic tailwinds leading renewable energy investments.
It is also worth referring again to Figure 17, which shows the company’s conservative assumptions that go into its NAV estimates, which we feel are also underappreciated by the market.
GCP’s focus on the UK may have also contributed, taking into account the economy’s well-documented struggles with inflation, which have driven discount rates higher, further compounding the detrimental effects of last year’s mini-budget debacle. With inflation beginning to trend lower, going forward these impacts should reduce.
Alternative peer group – renewable energy finds
In light of the increasing importance of renewable energy within GCP’s portfolio, we feel it is also relevant to compare the company to the constituents of the renewable energy infrastructure sector. However, it is worth noting that this encompasses a diverse range of funds which are not all directly comparable to GCP. This particularly applies to Ecofin US Renewables and US Solar Fund, which are cushioned somewhat from energy price volatility – which has been much greater in the UK and Europe – by having much-longer-term PPAs. The energy storage funds – Gore Street, Gresham House and Harmony – and the energy efficiency funds – Aquila, SDCL and Triple Point – are also much less exposed.
We think the best comparators are probably Bluefield Solar, Foresight Solar, Greencoat UK Wind, JLEN Environmental, NextEnergy Solar, Octopus Renewables and The Renewables Infrastructure Group.
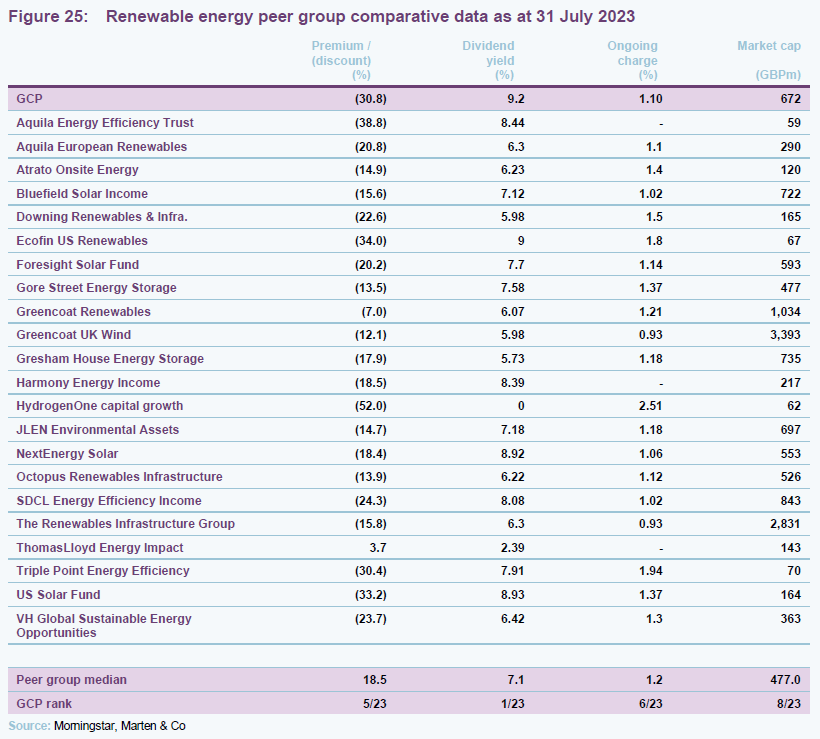
We have also compared GCP to the constituents of the renewable energy sector.
Figure 25 shows how GCP stacks up against the renewable energy sector. GCP offers the highest dividend within this group while also maintaining one of the lowest charges. Despite this, the discount remains one of the widest in the sector.
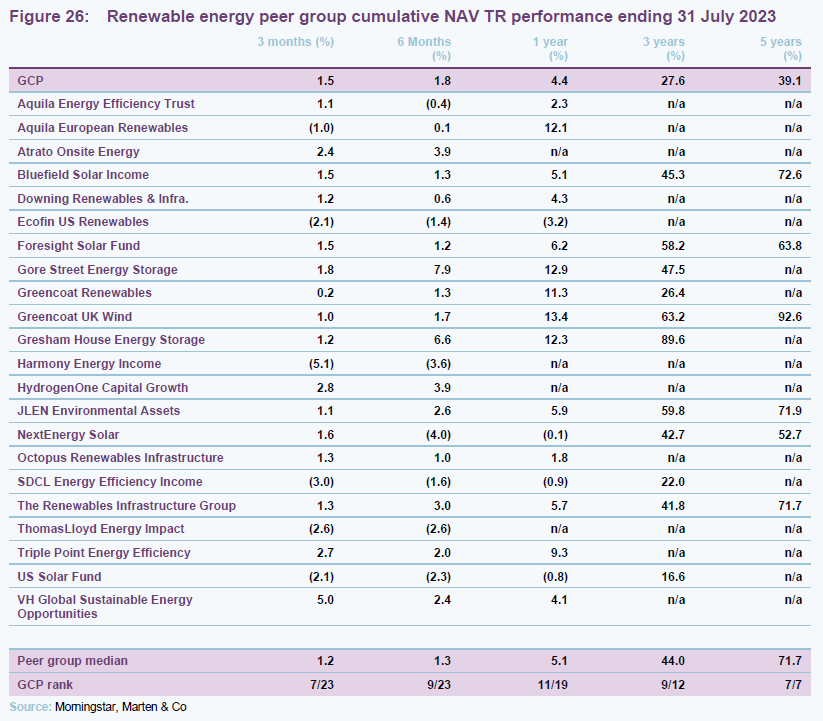
The sector has been expanding rapidly over the last few years, and consequently many of these funds have not yet built up much of a track record, as shown in Figure 26, with only seven of the 23 funds having data out past five years.
GCP’s conservatively valued NAV has dragged down its returns relative to the peer group median, with the company also suffering from its bias to debt rather than equity.
Dividend cover
Loans made by the company are valued on a discounted cash flow basis. When a loan is first made, it is typically valued using the interest rate charged to the borrower. However, loans are often revalued by the valuation agent to reflect changes in the market rate of interest or for project specific reasons, for example.
As market rates of interest have fallen since GCP was launched, higher values have been attributed to many of the loans that it has made, uplifting the NAV. That has the effect of pulling forward the recognition of income from these loans and, on an IFRS accounting basis, reduces GCP’s earnings per share and dividend cover in subsequent years (a pull-to-par effect). For this reason, the board and the investment adviser have calculated a range of alternative performance measures. In addition, the adviser cautions that looking at measures of cashflow coverage of the dividend can be misleading. Interest accrued on loans can either be paid in cash or added to the outstanding principal and repaid when the loan matures (payment in kind or PIK). This gives rise to timing differences that affect cashflow dividend coverage measures.
Figure 27 shows GCP’s dividend cover ratios on two bases – normal (IFRS) earnings cover, and an adjusted figure which strips out the impact of unrealised fair value adjustments on the company’s earnings, and better contrasts GCP’s revenue and dividend payout.
We note that the increase in the unadjusted earnings per share (EPS) coverage through FY2022 reflects a substantial increase in the unrealised value of GCP’s assets.

Emergence of a wide discount
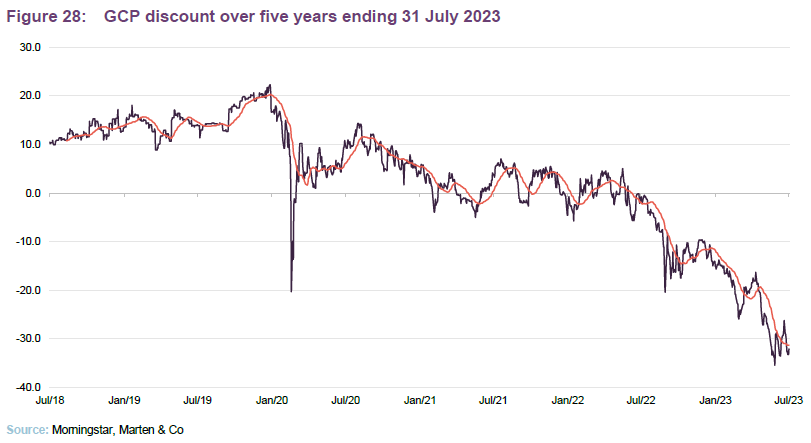
Over the past 12 months, GCP’s shares have traded on an average discount of -16.9%, a high of -0.5%, and a low of -35.5%. At 31 July 2023, the discount to the end June NAV was -32.1%. This is a considerable drop from our previous note, published at the beginning of the year, where the average 12-month discount was just -5%. Historically, the fund has traded at a long-term premium that was as high as 20% prior to the pandemic.
We have discussed several factors over this report which have contributed to the company’s discount (see pages 6, and 18), focused predominantly on rising interest rates which have put upward pressure on discount rates, as well as the relative attractiveness of other assets, including risk-free Government debt. Still, these macro factors have weighed on the entire income sector and do not explain the extent of GCP’s discount, which is wider than the vast majority of its peers.
This is in our view impossible to justify, especially given the fund’s strong ongoing execution, and with thematic tailwinds driving long term cashflows, it should only be a matter of time before a dividend yield of over 9% begins to attract attention once again, particularly if inflation/interest rates continue to trend lower.
Fund profile
Regular, sustainable, long-term income.
GCP Infrastructure Investments Limited (GCP) is a Jersey-incorporated, closed-ended investment company whose shares are traded on the main market of the London Stock Exchange. GCP aims to generate a regular, sustainable, long-term income while preserving investors’ capital. The fund’s income is derived from loaning money at fixed rates to entities which derive their revenue – or a substantial portion of it – from UK public-sector-backed cashflows. Wherever it can, it tries to secure an element of inflation-protection.
Renewable energy projects, PFI/PPP-type assets and specialist supported social housing.
In practice, GCP is diversified across a range of different infrastructure sectors although its focus has shifted more towards renewable energy infrastructure over the last few years. It has exposure to renewable energy projects (where revenue is part subsidy and part linked to sales of power), PFI/PPP-type assets (whose revenue is predominantly based on the availability of the asset) and specialist supported social housing (where local authorities are renting specially-adapted residential accommodation for tenants with special needs).
As part of the GABI merger discussed on page 3, GCP Infrastructure’s board will propose an amendment to the trust’s investment policy in recognition of the evolution that has occurred in the infrastructure landscape over the 13 years since IPO and to maximise the pool of attractive investment opportunities available moving forward. The amendment will require that at least 75% of GCP’s total assets will:
- benefit from public-sector backed, contracted, or predictable cash flows;
- have no construction risks;
- have a high standard of sustainability by reference to: (a) meeting a credible minimum standard for environmental and/or social sustainability; or (b) align with a specified environmental and/or social sustainability theme; and
- are located in the UK.
The updated arrangement will also include a continuation vote at the company’s AGM in 2028 and every four years thereafter.
The portfolio managers of the enlarged GCP will continue to be Philip Kent, Ed Simpson and Max Gilbert.
If the merger proceeds, the basis for calculating the adviser’s fee would move from a flat fee of 0.9% on fixed assets to 0.9% on the first £1.3bn and 0.8% thereafter.
The investment adviser
More information is available on the investment adviser’s website graviscapital.com.
Gravis Capital Management Limited (Gravis) is the fund’s AIFM and investment adviser and will continue to operate as such under the new arrangement. It is also investment manager of GCP Asset Backed Income, and advises VT Gravis Clean Energy Income Fund, VT Gravis UK Listed Property Fund, VT Gravis UK Infrastructure Income Fund, and VT Gravis Digital Infrastructure Income Fund. Gravis has assets under management of approximately £3bn.
At 31 March 2023, the key management personnel of the investment adviser, together with their family members, held 1,012,479 ordinary shares in the company, up from 952,614 shares at 30 September 2022.
Gearing
The company’s original revolving credit facility from 29 March 2021 has been expanded from £165.0m to £190.0m. This is set to expire on 29 March 2024 and the investment adviser is liaising with the existing lending group in order to refinance the RCF in advance of the date of expiry. As at 31 March 2023, the total amount drawn on the RCF was £154m, compared to £99m at 30 September 2022.
Previous publications
Readers interested in further information about GCP may wish to read our previous notes (details are provided in Figure 29 below). You can read the notes by clicking on the links below or by visiting our website.
Figure 29: QuotedData’s previously published notes on GCP
| Title | Note type | Publication date |
| Stable income, uncertain times | Initiation | 30 January 2020 |
| Rebased dividend | Update | 1 June 2020 |
| Compelling yield | Annual overview | 11 January 2021 |
| Penalised for being conservative? | Update | 1 July 2021 |
| The future is brighter and greener | Annual overview | 18 January 2022 |
| Improving outlook and room to grow | Update | 19 July 2022 |
| Green is good | Annual overview | 7 February 2023 |
Source: Marten & Co
Legal
This marketing communication has been prepared for GCP Infrastructure Investments Limited by Marten & Co (which is authorised and regulated by the Financial Conduct Authority) and is non-independent research as defined under Article 36 of the Commission Delegated Regulation (EU) 2017/565 of 25 April 2016 supplementing the Markets in Financial Instruments Directive (MIFID). It is intended for use by investment professionals as defined in article 19 (5) of the Financial Services Act 2000 (Financial Promotion) Order 2005. Marten & Co is not authorised to give advice to retail clients and, if you are not a professional investor, or in any other way are prohibited or restricted from receiving this information, you should disregard it. The note does not have regard to the specific investment objectives, financial situation and needs of any specific person who may receive it.
The note has not been prepared in accordance with legal requirements designed to promote the independence of investment research and as such is considered to be a marketing communication. The analysts who prepared this note are not constrained from dealing ahead of it, but in practice, and in accordance with our internal code of good conduct, will refrain from doing so for the period from which they first obtained the information necessary to prepare the note until one month after the note’s publication. Nevertheless, they may have an interest in any of the securities mentioned within this not.
This note has been compiled from publicly available information. This note is not directed at any person in any jurisdiction where (by reason of that person’s nationality, residence or otherwise) the publication or availability of this note is prohibited.
Accuracy of Content: Whilst Marten & Co uses reasonable efforts to obtain information from sources which we believe to be reliable and to ensure that the information in this note is up to date and accurate, we make no representation or warranty that the information contained in this note is accurate, reliable or complete. The information contained in this note is provided by Marten & Co for personal use and information purposes generally. You are solely liable for any use you may make of this information. The information is inherently subject to change without notice and may become outdated. You, therefore, should verify any information obtained from this note before you use it.
No Advice: Nothing contained in this note constitutes or should be construed to constitute investment, legal, tax or other advice.
No Representation or Warranty: No representation, warranty or guarantee of any kind, express or implied is given by Marten & Co in respect of any information contained on this note.
Exclusion of Liability: To the fullest extent allowed by law, Marten & Co shall not be liable for any direct or indirect losses, damages, costs or expenses incurred or suffered by you arising out or in connection with the access to, use of or reliance on any information contained on this note. In no circumstance shall Marten & Co and its employees have any liability for consequential or special damages.
Governing Law and Jurisdiction: These terms and conditions and all matters connected with them, are governed by the laws of England and Wales and shall be subject to the exclusive jurisdiction of the English courts. If you access this note from outside the UK, you are responsible for ensuring compliance with any local laws relating to access.
No information contained in this note shall form the basis of, or be relied upon in connection with, any offer or commitment whatsoever in any jurisdiction.
Investment Performance Information: Please remember that past performance is not necessarily a guide to the future and that the value of shares and the income from them can go down as well as up. Exchange rates may also cause the value of underlying overseas investments to go down as well as up. Marten & Co may write on companies that use gearing in a number of forms that can increase volatility and, in some cases, to a complete loss of an investment.
