Over the pond
From the beginning of April, Brown Advisory (Brown) is set to take over the management of Jupiter US Smaller Companies (JUS), following the retirement of the trust’s long-standing manager, Robert Siddles. Back in December, when JUS’s board announced its intention to appoint Brown, it said that the long and impressive track record of the new manager’s US small-cap growth strategy, with annualised returns of 14.5% over 10 years, stood out in a highly competitive field. It also said that it believed that the appointment of Brown should lead to strong performance, a narrower discount and ultimately the ability to grow the company over time. With this major change now approaching, this note takes an in-depth look at JUS and explores the key changes that investors should expect to see. One key difference is that the portfolio will be managed from the US, rather than remotely from the UK.
Capital growth from a diversified portfolio of US smaller and medium-sized companies
JUS aims to provide investors with long-term capital growth by investing in a diversified portfolio primarily of quoted US smaller and medium-sized companies. Brown’s long-term investment philosophy has three core tenets: to think and act differently; to exploit inefficiencies; and to focus on businesses that possess three qualities in particular: durable growth, sound governance, and scalable go-to-market strategies.
JUS discount appears to be trending back towards its longer-term trading range, although it remains at the outer edge of this, possibly due to the inherent uncertainties around the change of manager. However, if Brown can provide improved performance, we see the potential for the discount to narrow from here.
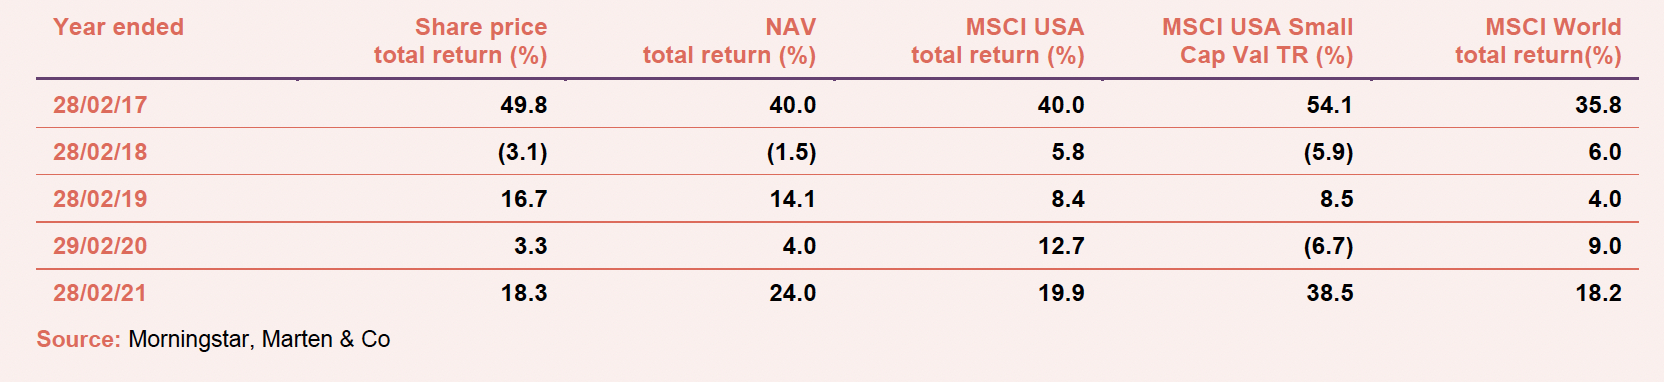
Although it has faced a number of headwinds, JUS’s NAV has exhibited a trend of strong outperformance against the MSCI US Small Cap Value index during the last three years. However, as is illustrated in Figure 10, in the performance section, over most periods, shareholders would have been better off with an investment in the Brown US Small-Cap Growth Strategy.
Fund profile
Diversified exposure to US smaller and medium-sized companies driven by long-term bottom-up analysis
JUS aims to provide investors with long-term capital growth, by investing in a portfolio primarily made up of quoted US smaller and medium-sized companies. Historically, a key differentiator versus its peers has been Robert Siddles’s risk-averse approach to investment that emphasised capital preservation. Robert’s process focused on good quality companies whose share valuation reflects limited downside risk. He has sought to identify companies with a strong franchise, free cash flow and insider ownership by management, and then purchased these when he has considered them to be cheap.
Although Brown follows its own proprietary process, there are some similarities with that of the outgoing manager. For example, Brown employs a disciplined, long-term investment philosophy based on a careful analysis of business fundamentals relative to the price of the security. It seeks to own sound businesses at attractive prices where it considers its view of the world differs from that of the consensus. Both approaches focus on backing growing businesses, although the outgoing strategy places more emphasis on value. Nonetheless, both place an emphasis on having positive free cash flow generation, return on equity (ROE) and return on invested capital (ROIC).
Although not immediately a pressing concern, it is anticipated that, subject to shareholder approval, the trust’s name will be changed to Brown Advisory US Smaller Companies Plc in due course.
Benchmark index and performance comparators
JUS’s benchmark is the sterling adjusted Russell 2000 Index, although its portfolio has not been managed with respect to this historically, and it will not be managed with respect to the benchmark once Brown takes the reins. In addition to its benchmark, the trust’s literature also includes comparisons against the S&P 500 Index (also in sterling terms). For the purpose of this note, we are including comparisons against the MSCI USA Index as an alternative for the S&P 500 Index, and we have replaced the Russell 2000 with the MSCI US Small Cap Value Index as we think this provides a more relevant comparison to the outgoing strategy. We have also included comparisons against the MSCI USA Small Cap Index. We think that readers may find this a useful comparison with which to assess the historic performance of the new strategy. All such comparisons have been made in sterling terms.
Brown Advisory
Launched in 1993 as a spin-out from Alex Brown & Sons, the oldest investment bank in the US, Brown Advisory – which was originally the private banking part of the investment bank – has grown into a fully independent investment firm with assets under management (AUM) of over $100 billion. It has clients in all 50 US states as well as in 39 countries globally. The firm is well resourced with over 700 full-time employees. All are well aligned with Brown’s long-term interests, and therefore those of its clients, as each employee has an equity interest in the firm and, collectively, employees own approximately 70% of the firm. The split between private client investment management and asset management is around 55%/45% of AUM.
Brown Advisory has managed active equity strategies since its inception. Initially these were for Brown’s private clients, but reflecting their success, these were subsequently made available to institutional investors. It now has various flagship strategies, one of which is the US small-cap growth strategy that is going to be used to manage JUS’s portfolio. Launched in 1993, this strategy now has a proven track record of successfully investing in US smaller companies for over 28 years. Christopher Berrier, discussed below, is lead manager on the strategy, which he has managed since 2006.
Lead manager – Christopher Berrier
Christopher Berrier will be lead investment manager for JUS’s portfolio. He will be supported by George Sakellaris, as well as a 30-strong experienced team of equity research analysts.
Christopher has in excess of 20 years of investment experience, 15 years of which have been with Brown Advisory, where he is based in the manager’s Baltimore office. Prior to Brown, Christopher was a vice president and equity analyst at T. Rowe Price. He has a degree in economics from Princeton University.
Assistant manager – George Sakellaris
George Sakellaris has worked closely with Chris since joining Brown Advisory in August 2014. Prior to Brown, George spent three years as a small-cap growth portfolio manager at Credo Capital Management; over six years as a director of research and analyst at GARP Research and Securities; and over four years as an assistant vice president at M&T Investment Group. He is a CFA charterholder, has a degree in physiology/neurobiology from the University of Maryland and an MBA from R. H. School of Business (UMD).
The US small-cap growth strategy
The Brown Advisory US Small-Cap Growth Strategy invests primarily in the shares of small US companies that the manager has identified as possessing above-average growth potential. The manager uses a disciplined and repeatable, fundamental approach based on deep, bottom-up research of potential investments that seeks to build a portfolio of 50 to 80 companies that represents the investment team’s best thinking and analysis.
This process, which is benchmark- and sector-agnostic, aims to exploit market inefficiencies in the US small-cap universe while taking a long-term investment horizon. The manager says that this is the foundation of the strategy’s strong risk-adjusted returns over the longer term.
The strategy has three core tenets at its heart:
- to think and act differently;
- to exploit inefficiencies; and
- to focus on businesses that possess three qualities (its “three Gs investment filter”) in particular:
- durable growth,
- sound governance, and
- scalable go-to-market strategies.
At present the strategy is available as a mutual fund and a UCITS Fund, as well as a separately managed account for larger investors. However, for UK-based investors, an investment in JUS will provide an easy route to access the Brown US Small-Cap Growth Strategy.
Investment process
The power of compounding
Brown Advisory believes in the power of compounding returns (the extra returns that accumulate from re-investing income back into holdings) in good businesses. Reflecting this, it likes to own businesses for the long term and believes that one of the benefits of having a well-resourced and well-aligned team is that it can uncover good businesses that can compound good positive returns for many years. The philosophy and process used to manage the strategy has remained constant and focused over time. Brown looks for small companies with the potential to become mid- and large-cap companies. It maintains a long-term focus in what it sees as a short-term world.
When identifying potential portfolio companies, it is key that such businesses should have the ability to go from being a $1bn company to a $10bn company over time. Brown looks for companies that have a large market relative to their revenue base and differentiated business models. This should allow a company to be able to grab an increasing share of a growing market, which should in turn allow it to grow at an above average rate and therefore allow its earnings and cash flows to grow on a multi-year basis. To achieve such growth, companies must also have the right board and management team, and these people must be well aligned with shareholders. However, this growth must be sufficient to translate for the business to provide good returns to investors while providing enough capital to reinvest in the business to keep it at the cutting edge.
Establishing a real-world view
Brown looks for businesses that fit with its philosophy. Then, rather than focusing on the near term, the investment focuses on what the company will look like in two to three years’ time. Brown says that to achieve this, it builds a broad mosaic of analysis. Ideally, it hopes to be able to establish a non-consensus view, which will allow it to get an edge over the market. In the manager’s words, it works to build a real view of a company to go alongside the PowerPoint view that is provided by company management.
Brown believes that, on average, smaller companies are more dynamic than larger companies, which can allow small-cap investment to deliver superior returns over the longer term. However, it says that there is no magic quantitative screen that can readily identify the most dynamic small caps. Fundamentally, quantitative screens are backward-looking and cannot tell you what a small-cap growth company is going to do in the future. Brown observes that stock prices tend to be governed by what is happening at the margin – this short-termism leads to inefficiencies that it seeks to exploit.
To get an edge, the investment team at Brown talk to hundreds of companies a year – both the management teams of companies that they are interested in and their competitors – to try and work out what the future holds. Brown also leverages its investment network to tap into insights beyond those of the management teams. This includes private equity and venture contacts as, for many smaller public companies, their competitors are not listed.
Brown also talks to the sell side as this helps it to gauge market thinking and establish whether it has a view that differs from the consensus. It participates in a lot of conferences to gain additional insight. Brown will comb through the client list of a potential investee company and find as many customer contacts as it can. Brown wants to establish who is making the buying decisions and why they have chosen a particular product or service. This helps the manager to form an opinion of the company’s relative competitive position, as well as its strengths and weaknesses.
Ultimately, Brown seeks to speak to as many primary sources as possible, as it believes that this gives it a better real-world understanding of a company. The manager says that it has an investable universe of about 2,000 companies and conducts in excess of 500 company meetings per year as part of its idea generation process. These are its ‘three G’ interviews, where it seeks to identify companies with that combination of growth, governance and go-to-market. Dozens of companies will then progress to the full due diligence process, in which Brown builds its own models of potential portfolio candidates. For each, Brown has a clear and concise investment thesis with two to three value drivers. It models multiple scenarios for each business and assigns probability weights to them. Brown then establishes its view on valuation based on whether it thinks that the future will be better, in line or worse than the market expects. Only companies that can clear all of these hurdles will make it into the portfolio.
Portfolio construction
Brown looks to build what it describes as an all-weather portfolio that it can own over a full market cycle. Such portfolios need to be high-quality and diversified, in its view. The portfolio is also structured so that stock selection is the driver of returns (it is not a beta-driven strategy) and its risk is managed with respect to a range of measures (the manager seeks to ensure that the portfolio is not unduly exposed to idiosyncratic risks). Reflecting the investment process, the portfolio does not have significant exposure to cyclical commodity companies. Instead, it leans towards growth stocks, albeit these need to come at an attractive valuation.
Portfolio characteristics
Brown says that it wants to invest not speculate in stocks. Consequently, its portfolios tend to be grossly underweight loss-making businesses relative to index benchmarks. Where Brown includes an unprofitable business in a portfolio, it needs considerable evidence that the company has the ability to make a lot of money in the near future.
Brown says that, looking at the US small-cap universe, as represented by the Russell 2000 Index, around 30% of the index does not make money and around 40% of the Russell 2000 small-cap growth index does not make money. In comparison, the Brown portfolio, with its strong emphasis on free cash flow generation, has around 10% of its portfolio allocated to loss-making companies.
Brown says that its portfolios have structurally higher ROEs, ROICs and margins than their benchmarks, while simultaneously having lower leverage levels. Brown says that this is a by-product of the type of businesses that it is philosophically attracted to. Its portfolio is not reverse engineered to look this way.
The portfolio tends to operate at close to full investment, which is typically within a two to four per cent cash range, as the manager likes to have some spare capacity to take advantage of good opportunities when they arise (this will be less of an issue within JUS’s closed-end structure). The manager says that it always has 10 or so names that it is working on, and it likes to have cash available to take advantage of these when the timing is right. It also aims to keep the portfolio fresh by reviewing it with a focus on swapping out lower-strength ideas.
Workiva – a practical example of the Brown process
As an example of the approach, Workiva (which is also discussed in the asset allocation section), a fast-growing software-as-a-service (SaaS) platform for business presentations, is a constituent of Brown’s portfolios.
Workiva was focused on helping companies with their US Securities and Exchange Commission (SEC) reporting. However, a new management team saw a much bigger opportunity and started to build out Workiva’s platform to include products for compliance and broader reporting requirements. With the growing importance of environmental, social and governance (ESG) reporting, Workiva’s platform is increasingly being applied to produce this analysis as well.
Brown says that it identified Workiva by talking to other software companies. It attended a ‘user conference’ and was able to see who was buying the product and to talk to them to find out why they use it. They found that Workiva’s platform is very effective at pulling together disparate records and presenting the data automatically. The company has also been very commercial, adding new products and modules in response to customers’ needs.
Whilst Workiva was not profitable when Brown first invested, it now is, and Brown sees a path towards sustained margin improvement and increased free cash flow generation for the next few years. They also think that it looks cheap when compared to peers. Ultimately, Brown was able to identify a company that was not well understood by the market, and benefit as more investors have ‘discovered’ the company, but the investment team considers that this ‘discovery process’ has further to go.
Position sizing
Brown will typically initiate a holding at around a 2% allocation (Workiva was a 3.1% position as at 31 December 2020, which is due to its strong performance post acquisition); however, position sizing will also reflect the manager’s confidence and valuation (companies that they think are great and cheap naturally get larger allocations). The smallest positions tend to be around 50 basis points, while the largest holdings tend to be around 5% of the fund. Most of the larger holdings will be in the 3% to 3.5% range, but the majority of positions will be between 1 and 2% of the portfolio.
Selling triggers
There are three primary reasons to sell down a holding:
- If an investment thesis has been violated;
- If a valuation is too high; or
- The manager sees a better opportunity elsewhere.
The Brown team says that the first of these is their biggest concern, and where an investment thesis is violated, they will trade out of the position. When Brown initiates a new position, it sets out and publishes internally, the key tenets of the investment thesis. This is a yardstick to measure outcomes by, and it anchors the manager in the facts should things go wrong. Brown thinks that while active managers need to run their winners to get the benefits of compounding, there is a tendency to run losers too long in the hope that they may recover. Brown’s analysis shows that this is flawed and that it is better to cut your ties and move out of a position aggressively where the investment rationale has broken down.
As part of its portfolio monitoring process, Brown has a draw down review whereby investments that have lost money are scrutinised. The original investment case serves as a baseline and the review helps them to be objective and to make a decision to sell out where they need to.
Brown also says that if it likes a stock, it has become more aggressive in getting to its target weight as, based on their in-house analysis, this also adds value. Overall, Brown says that sizing positions correctly is key. It believes that this can add five to 10 basis points a quarter, which adds up over the longer term.
Portfolio turnover (a measure of how quickly stocks are either acquired into the portfolio or sold) is around 30% a year, which suggests a three to three-and-a-half-year holding period on average. However, some portfolio companies have been held for over a decade and the manager says that a lot of portfolio companies have been owned for over five years, which underlines the long-term emphasis within its approach.
Asset allocation illustration and comparison
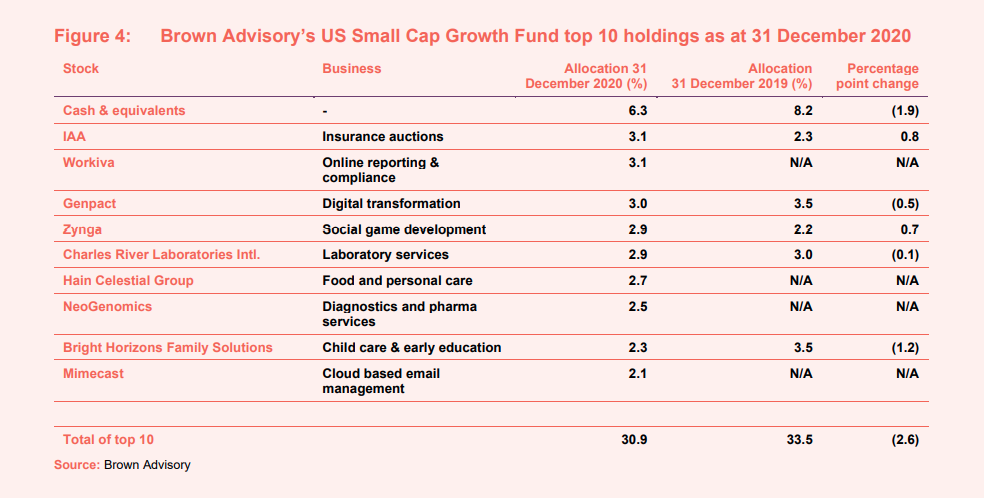
Under the outgoing manager, JUS has maintained a relatively concentrated portfolio of around 40 holdings, with the top 10 typically accounting for around 40% of the portfolio. In contrast, Brown Advisory’s US Small-Cap Growth Strategy portfolios are pitched as having between 50 and 80 holdings (as at 31 December 2020 – Brown’s US Small-Cap Growth Fund had 83 holdings), which suggests a reduction in portfolio concentration once Brown has completed the portfolio transition.
As discussed above, both strategies’ portfolios are constructed bottom-up and these bear little resemblance to any of the relevant indices. Furthermore, as can be seen by comparing the top 10 holdings of Brown’s US Small-Cap Growth Fund as at
31 December 2020 (this being the most recently available information – see
Figure 4 below) with the JUS’s top 10 holdings as at 31 January (see Figure 16 in Appendix 2), there are no names in common. This is not surprising given the sheer scale and diversity of the US small-cap market, but it means that the portfolio transition will almost certainly lead to a complete rejig of the portfolio over time.
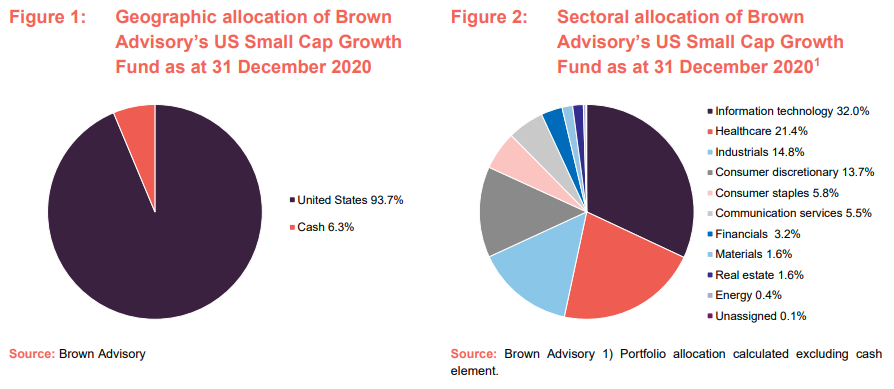
Figure 1 and 4 illustrate that the Brown Fund has an allocation to cash and equivalents of 6.3% as at 31 December 2020 and this is, in fact, larger than any of the top 10 equity holdings. We believe that this reflects the fact that the Brown Fund we are using for illustrative purposes is a mutual fund with daily liquidity and that the manager therefore needs to maintain a higher cash balance to fund potential redemptions (as a closed-end fund, this is not an issue for an investment trust such as JUS). Once JUS’s portfolio has been transitioned, we would not expect the manager to be running such levels of cash and, assuming that the manager utilises JUS’s borrowing facility, it could be geared.
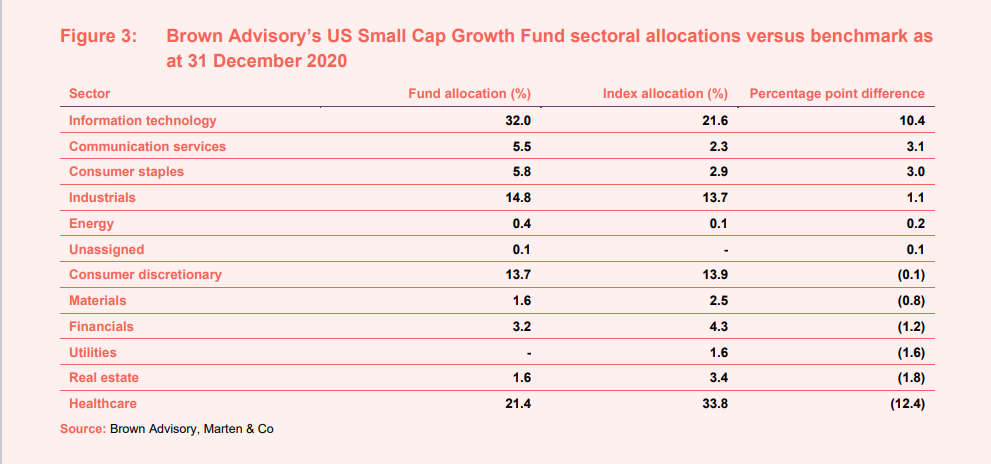
Figure 3 illustrates that the Brown Fund’s portfolio is markedly different from its benchmark and, while it offers a broad sectoral exposure, there is a large overweight to information technology and a large underweight to healthcare – the largest and second largest absolute allocations, within the portfolio, respectively.
Comparing the fund’s top 10 holdings as at 31 December 2020 and 31 December 2019 shows that six of the top 10 holdings at the end of 2020 where in the top 10 a year earlier. Reflecting the manager’s longer-term low-turnover approach, it is usually the case that many of the names in its top 10 holdings would be familiar to regular followers of the fund.
Brown Advisory’s US Small-Cap Growth Fund Top 10 holdings
Figure 4 shows the top holdings in the portfolio at the end of December 2020 and how these compare against the allocations as at the end of December 2019 (a year earlier). Details of the top five companies, including some commentary on the manager’s views on each, are provided below.
IAA (3.1%)
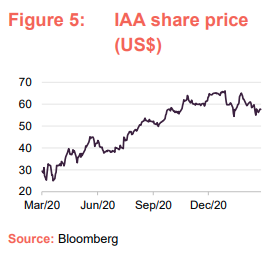
IAA (www.iaai.com/company) describes itself as “a leading global digital marketplace connecting vehicle buyers and sellers”. Originally specialising in salvage cars (Insurance Auto Auctions Inc), the company has expanded its offering so that offers a range of selling options and its platform also sells dealer stock, fleet lease and rental car companies as well as vehicles donated to charitable organisations. Vehicles are available to the full range of purchasers – vehicle dismantlers and recyclers, dealers, brokers and exporters – as well as the general public.
Brown says that, as a provider of auto auction services, IAA continues to benefit from a rebound in miles driven and elevated used car pricing in Q4 2020. These trends, combined with the transition to all digital auctions should push EBITDA growth at strong double-digit rates in 2021, in Brown’s view. Brown’s long-term thesis centres around IAA’s ability to enhance its profitability as more cars are totalled by insurance companies due to the higher technology content of vehicles elevating repair costs.
Workiva (3.1%) – highly commercial business data management and reporting platform
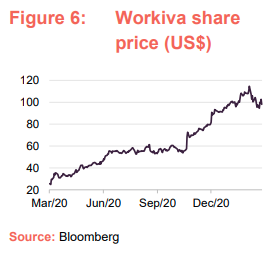
Workiva (www.workiva.com) is a cloud-based SaaS company that provides a reporting and compliance platform that helps businesses manage and report data, with the aim of simplifying complex tasks. Workiva’s platform allows business data to be connected across multiple disciplines within an organisation (for example, finance, accounting, risk, and compliance) and allows for the collection, analysis and dissemination of data to be automated.
Workiva’s platform aims to improve efficiency and transparency and therefore reduce business risk. By the nature of the services it provides, Workiva’s platform can quickly become an integral and business critical element of its clients’ reporting needs, giving it very stable recurring revenue streams. As noted, Brown says that Workiva has been very commercial, adding new products and modules in response to customers’ needs, and it sees a path towards sustained margin improvement and increased free cash flow generation for the next few years. The manager also thinks that it looks cheap when compared to peers.
Genpact (3.0%)
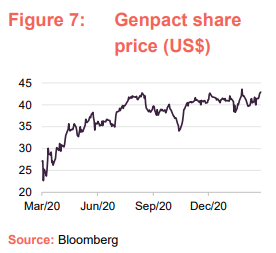
Genpact (www.genpact.com) describes itself as “a global leader in transforming and running business processes and operations, including those that are complex and industry-specific”. It was originally formed in 1997 as a business unit within General Electric, set up to provide business process services across the group, but then quickly expanded and began to service external clients in January 2005, before it had its initial public offering (IPO) in 2007. Reflecting its origins, Genpact provides its services to an extensive range of industries. Its offering includes its Cora product, an artificial intelligence (AI)-based platform that utilises open architecture that can interrogate large data sets and seamlessly integrate with customer service and financial reporting functions. In September 2020, Genpact UK was awarded a contract by the Medicines and Healthcare Regulatory Authority (MHRA) to provide an AI software tool to sift through an expected high volume of reports of adverse drug reactions to COVID-19 vaccines.
Brown considers that Genpact, as a global business processing outsourcing group, focused on digital transformation, is a relatively defensive technology holding. In Brown’s view, revenue growth is set to be solid the next couple years, aiding margin expansion and free cash flow generation. Furthermore, Brown says that, given Genpact’s balance sheet strength and attractive relative and absolute valuation, it sees compelling upside over the next 12-18 months, particularly when compared to its own assessment of downside risks.
Zynga (2.9%)
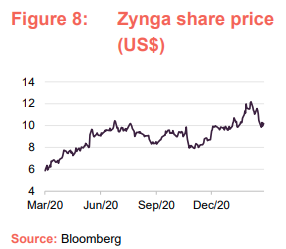
Founded in 2007, Zynga (www.zynga.com) is a social game developer, based in California, that operates social video game services. Zynga primarily focuses its products on mobile and social networking platforms, with titles such as Farmville and Toon Blast, but also has higher-profile offerings such as a Harry Potter series (puzzles and spells) and it recently announced a deal with Lucasfilm to provide ‘Star Wars: Hunters’ for the Nintendo Switch.
Brown says that it is excited about Zynga’s prospects over the next several years given the stability of its current portfolio, the sizable pipeline of upcoming game launches and their history of prudent capital allocation. Furthermore, Zynga continued to experience heightened engagement and monetization in its mobile games due to stay-at-home orders globally.
Charles River Laboratories Intl. (5.7%)
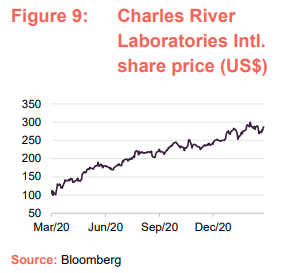
Charles River Laboratories International (www.criver.com) provides a range of preclinical and clinical laboratory services to the pharmaceutical, medical devices and biotechnology industries. It also provides services to the agro chemical sector, governments and academia. The company has over 90 facilities, spread across 20 countries, and employs over 17,000 people worldwide. Charles River says that its products and services help expedite the discovery, early-stage development and safe manufacture of novel drugs and therapeutics and it reports that in 2019 it supported the development of around 85% of drugs approved by the Food and Drug Administration in the USD (FDA) in 2019.
Brown considers that Charles River has a strong leadership position in the market, which has driven robust historical growth that is likely to continue in the future. It also thinks that the company’s recent merger and acquisition (M&A) activity has also provided an additional runway by adding new service capabilities. Brown believes that Charles River is an attractive “picks & shovels” opportunity to play growth in biotech funding and, despite its recent gains, the stock continues to have attractive upside potential. Brown highlights that it has owned the business for many, many years and that it respects the management team’s strong history of execution.
Performance comparison
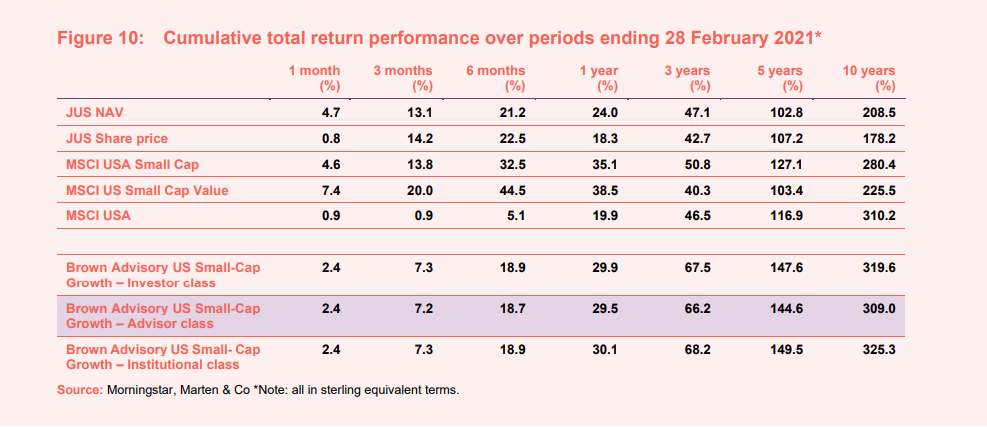
US small-cap stocks and US value stocks have suffered notable headwinds during recent years as markets have been very macro-driven and investors have sought growth opportunities in a low-interest-rate, low-growth environment. JUS, which has operated with a US small-cap value bias during this period, has faced multiple headwinds.
The impact of these headwinds is illustrated in Figure 10, with JUS’s NAV underperforming the large cap focused MSCI USA Index markedly. However, JUS’s NAV has exhibited a trend of strong outperformance against the MSCI US Small Cap Value index during the last three years. JUS’s investment approach was tweaked three years ago following a period of underperformance, and so the last three years is arguably the most representative of the outgoing manager’s revised approach.
New strategy has delivered superior historical performance
It is also clear from inspecting Figure 10 that, over most periods, shareholders would have been better off with an investment in the Brown US Small-Cap Growth Strategy, as represented by the performance of the mutual fund (all returns are in sterling equivalent terms). This is irrespective of the share class (we have included the investor class, which is most relevant to small retail investors, as well as the advisor and institutional classes). In the short term, JUS has outperformed, reflecting the recent good run of performance by value strategies.
It is also worth noting that, for all periods three years and above in Figure 10, the Brown Strategy has markedly outperformed the MSCI USA Small Cap Index (this being the most relevant comparator for the new strategy). Furthermore, the outperformance grows over time, arguably reflecting the consistency of the approach.
No dividend – capital growth-focused
JUS’s investment objective is to achieve returns primarily through capital growth. JUS does not have a formal dividend policy and has not paid a dividend since 1999. The investment objective and dividend policy are both a reflection of JUS’s underlying investments.
Traditionally, US smaller companies have been a lower-yielding area of the market – US companies tend to place less emphasis on dividends as a form of returns, instead focusing on capital growth or returning capital through buybacks, while smaller companies tend to be at a less mature stage of development and are more likely to be reinvesting profits to grow the business, rather than returning cash to shareholders.
The combined effect is that JUS’s dividend income tends to be a relatively small component of its total return and, with the majority of its ongoing expenses charged to revenue, JUS’s revenue income tends to be more than offset by the expenses charged against it. Consequently, JUS tends to accumulate revenue losses. For the year ended 30 June 2020, JUS provided a revenue return of -£131k (and a capital return of -£5.53m) bringing its accumulated revenue reserve to -£6.979m as at
30 June 2020 (equivalent to 53.7p per share).
In summary, we would expect JUS to only pay dividends to the extent required to maintain its investment trust status, and we do not envisage this changing with the portfolio moving to Brown Advisory. However, we would highlight that, given the scale of its accumulated revenue losses, JUS would need to accumulate significant revenue gains for this to become an issue.
Discount
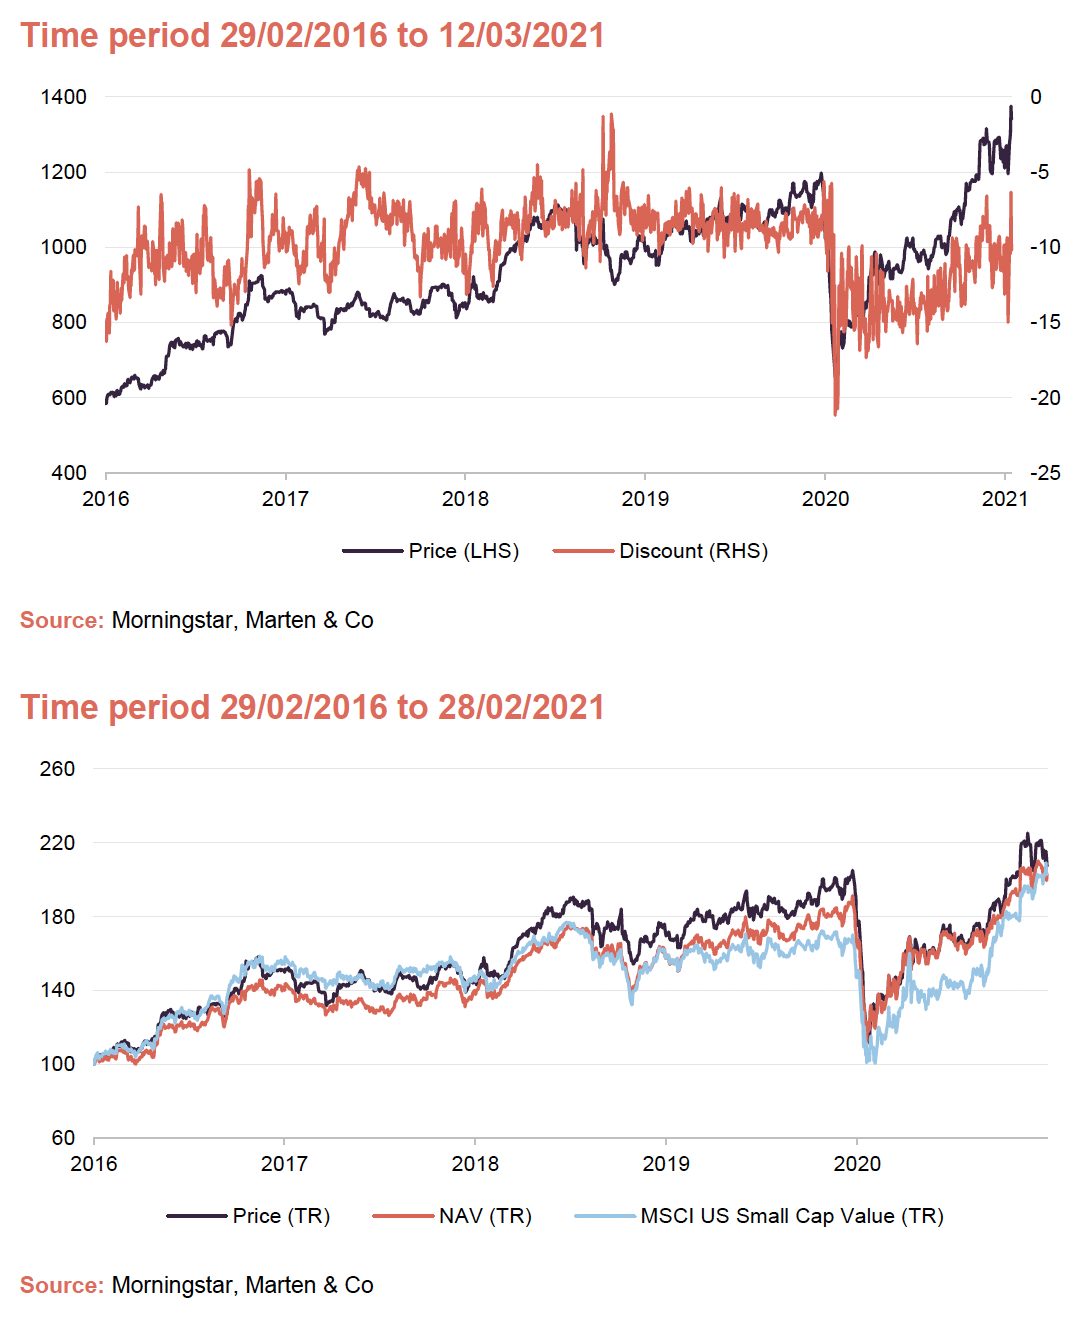
Prior to the onset of the COVID-19 pandemic, JUS has for the previous four years tended to trade within a discount range of 5–10%. Where it has broken out of this range, this has tended to be for relatively short-lived periods. This is consistent with its longer-term discount management policy, which is discussed below.
JUS discount appears to be trending back towards its longer-term trading range, although remains at the outer edge of this, possibly due to the inherent uncertainties around the change of manager. However, if Brown is able to provide improved performance, we see the potential for the discount to narrow from here.
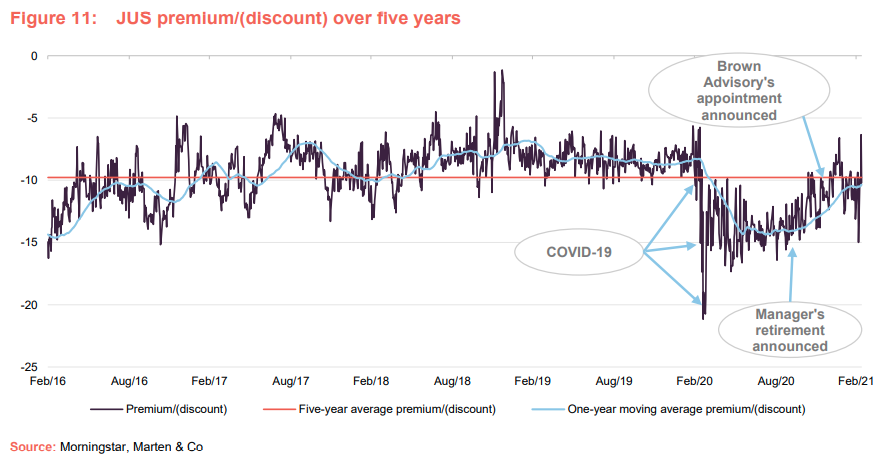
As at 12 March 2021, JUS was trading at a discount of 10.2%, which is modestly narrower than its post-market collapse average of 12.8%. Its post-pandemic range has been between a discount of 6.9% and 21.2% (pre-pandemic one-year range 5.6% to 17.4%, with an average of 8.5%). As illustrated in Figure 11, neither the announcement of Robert Siddles’s retirement on 8 October nor the announcement of the board’s intention to appoint Brown Advisory as manager on 9 December led to any significant change in the discount on the day. However, the discount continued on its narrowing trend regardless.
Discount management
JUS is authorised to repurchase up to 14.99% and allot up to 10% of its issued share capital, which gives the board a mechanism with which it can influence the premium/discount. The board has a policy of repurchasing shares “at appropriate times with a view to limiting any discount in the longer term to less than 10%”. Shares that are repurchased are held in treasury and could be reissued at a later date. JUS has previously issued shares when there has been sufficient demand. Any such issues are only done at a premium to NAV. As such, JUS’s repurchase and issuance activity should be NAV-accretive to remaining and existing holders respectively.
Fees and costs – tiered management fee and no performance fee
Under the heads of terms of the proposed alternative investment fund manager (AIFM) Agreement and Portfolio Management Agreement, Brown Advisory and FundRock will be paid fees equal to:
- 0.70% per annum of the company’s net assets on the first £200m;
- 0.60% per annum of the company’s net assets in excess of £200m up to £500m; and
- 0.50% per annum of the company’s net assets above £500m.
It is proposed that Brown Advisory’s appointment will be for an initial term of 12 months and may thereafter be terminated by either party giving six months’ notice. Neither the new nor outgoing fee structure includes a performance fee. This new fee structure is more competitive than the one that was agreed with the outgoing manager. Currently, Jupiter Unit Trust Managers Limited (JUS’s current AIFM), receives a tiered base annual management fee of:
- 0.75% of adjusted net assets up to £150m;
- 0.65% of adjusted net assets in excess of £150m but less than £200m; and
- 0.55% of adjusted net assets in excess of £200m.
The outgoing investment management agreement had a longer notice period, being terminable on 12 months’ notice by either side.
Management fee waiver until 1 April 2021 with a contribution from Brown to cover all transition costs
In addition to the improved management fee structure described above, there is a management fee waiver from the incoming manager, until 1 April 2021, to avoid any double-charging of management fees to JUS. Furthermore, Brown is providing a contribution by cover all of the JUS’s costs of transition.
Fund administration services
J.P. Morgan Europe Limited acts as JUS’s Depositary, and JUS has an arrangement with J.P. Morgan Chase Bank N.A. under which the latter acts as Custodian and provides accounting and administrative services. JAM is JUS’s company secretary, but J.P. Morgan Europe Limited provides administrative support to JAM as part of the broader fund administration services it provides to JUS. The terms of these agreements have not been made public, although they fall within the scope of JUS’s other expenses, which came to £156k in total for the year ended 30 June 2019 (2018: £238k).
Allocation of fees and costs
All expenses are charged to the revenue account with the exception of costs incurred in relation to the acquisition or disposal of investments, which are charged wholly to capital. JUS’s ongoing charges ratio for the year ended 30 June 2020 was 0.98% (2019: 0.93%). All things being equal, JUS’s ongoing charges ratio should reduce as the lower fee structure kicks in. This should be partially visible for the current financial year, but should be more apparent for the year ending 20 June 2022 as JUS shareholders will see the benefit of a full year charged at the lower management (rather than three months in the current financial year).
Capital structure and life
Simple capital structure
JUS has a simple capital structure with one class of ordinary shares in issue. Its ordinary shares have a premium main market listing on the London Stock Exchange and, as at 12 March 2021, there were 18,223,413 in issue with 6,258,715 of these held in treasury and 11,964,698 otherwise in general circulation.
The trust is permitted to borrow up to 20% of net assets and has a £30m revolving bank loan, provided by Scotiabank Europe, for this purpose. Historically, JUS has followed a geared strategy (one that utilises borrowings with the aim of enhancing returns), and we expect it to do so again once Brown has taken over the management of the portfolio. However, as at 31 January 2021, JUS was ungeared and was holding net cash equivalent to 4.3% of total net assets (presumably the outgoing manager has taken the portfolio’s gearing down in advance of its transition to Brown).
JUS’s £30m facility could theoretically provide gearing up to 16.8% (based on the trust’s NAV as at 12 March 2021), and the trust does not have any other borrowing facilities in place. JUS’s 20% limit is in place to provide flexibility and is only likely to be used in more extreme market conditions. Historically, JUS has tended to operate with relatively low levels of gearing. Going forward, the new manager says that it will use gearing selectively for specific opportunities, but there will not be a persistent, or high, use of leverage.
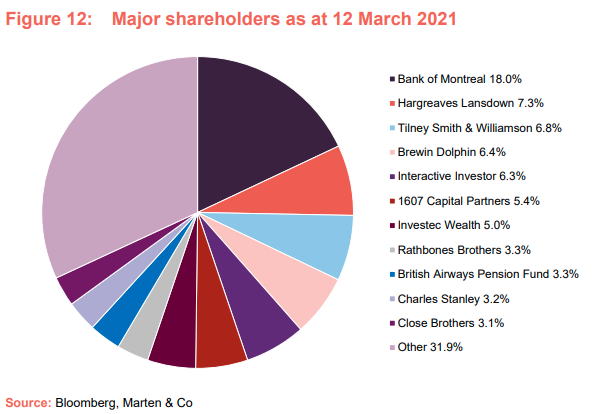
Major shareholders
JUS’s share register has a strong retail element and, reflecting this, there are a significant number of trading platforms and private client wealth managers that are prominently visible with JUS’s share register.
Corporate history
JUS was launched in March 1993 as Foreign & Colonial US Smaller Companies, changing its name to F&C US Smaller Companies in December 2002. Outgoing manager Robert Siddles was appointed as JUS’s portfolio manager in January 2001. When Robert left F&C Investment Management at the end of 2013 to join Jupiter, JUS’s board took the decision to serve notice on F&C and move the management contract to Jupiter, allowing Robert to be retained as JUS’s portfolio manager. Jupiter became JUS’s manager in February 2014. The trust was renamed Jupiter US Smaller Companies in April 2014.
On 8 October 2020, it was announced that Robert would be retiring, for family reasons, with effect from April 2021, and that the board was reviewing the management options for the company. On 9 December 2020, the company announced the board’s intention to appoint Brown Advisory as the company’s investment manager either on or before 1 April 2021.
Unlimited life with three-yearly continuation votes
JUS has an unlimited life, but offers its shareholders three-yearly continuation votes. JUS shareholders approved the last continuation vote at the November 2020 annual general meeting (AGM). The next continuation vote is scheduled for the company’s AGM in November 2023.
Financial calendar
The trust’s year-end is 30 June. The annual results are usually released towards the end of September/early October (interims in March) and its AGMs are usually held in November of each year.
Board
JUS’s board is composed of five directors, all of whom are non-executive and considered to be independent of the investment manager. Other than JUS’s board, its directors do not have any other shared directorships. Board policy is that all of JUS’s board members retire and offer themselves for re-election annually. JUS’s articles of association limit the aggregate fees that can be paid to directors to £150k per annum. Shareholder approval is required for a change to this limit.
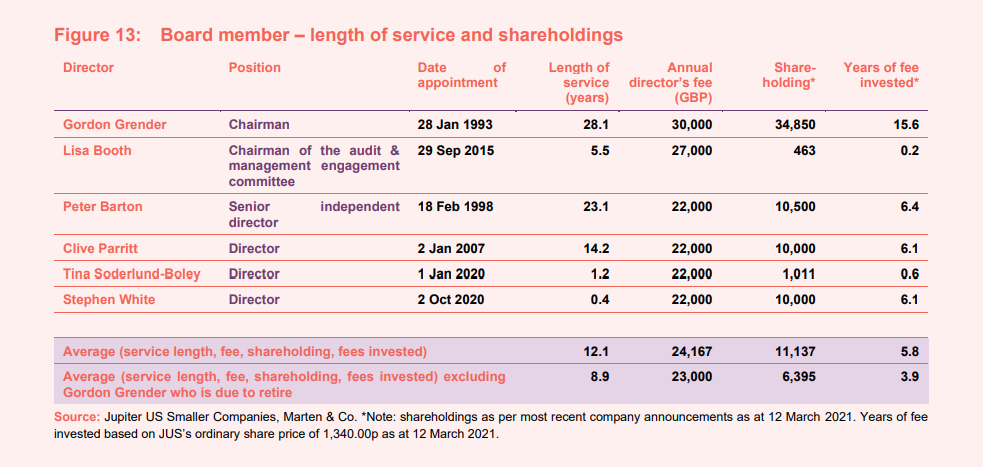
Succession plan has seen a chairman designate appointed
As illustrated in Figure 13 above, the chairman, Gordon Grender, has been a director since the trust’s launch in 1993 and has now served for over 28 years. On 29 June 2020, the trust announced that the board has put in place a succession planning process, which led to the appointment of the board-level recruitment consultancy, Nurole Limited, to undertake the search for a new director. Following the selection process, Stephen White joined JUS’s board with effect from 1 October 2020, as chairman designate. It is anticipated that Stephen will take over the responsibilities of chairman from Gordon with effect from JUS’s AGM in November 2021.
Gordon Grender (chairman)
Gordon has been actively involved in fund management in North American stock markets since 1974. He has been the investment adviser to GAM North American Growth Fund since its inception in 1985. Appointed to the board at JUS’s launch in 1993, Gordon become chairman of JUS in 1998.
Lisa Booth (chairman of the audit & management engagement committee)
Lisa is a solicitor specialising in corporate and commercial law, who has many years’ experience in private practice in London and overseas. She specialises in corporate finance and investment and in 2003 she co-founded a law firm in the City of London. Over the next 10 years she developed and managed a practice focusing on private equity and investment fund transactions. She currently works as a consultant for several law firms and businesses, both in the UK and Germany. Having joined the board in September 2015, Lisa became chairman of the audit & management engagement committee on 20 November 2018.
Peter Barton (senior independent director)
Peter is a solicitor and investment banker. He spent 20 years as a corporate lawyer, after which he acquired extensive financial services experience as an investment banker with Lehman Brothers for nine years, followed by four years with Robert Fleming & Co and then nine years as a director of Alliance & Leicester Plc (of which he was deputy chairman). Peter is also a director of easyGroup Holdings Ltd, and has previously chaired, or been a director of, a number of other financial services, real estate and other businesses.
Tina Soderlund-Boley (director)
Tina has a Swedish law degree and has extensive investment management expertise, having spent 18 years as head of sales institutional and intermediaries northern Europe for GAM. Since then, she has continued to focus on cross-territory investment in smaller companies.
Clive Parritt (director)
Clive is a chartered accountant with over 30 years’ experience of providing strategic, financial and commercial advice to medium-sized businesses. He served as the chairman of the audit & management engagement committee until 20 November 2018, when Lisa Booth took over the responsibility for this role. Clive is chairman of BG Training Limited and a non-executive director of London and Associated Properties Plc. He was also president of the Institute of Chartered Accountants in England & Wales in 2011 to 2012.
Until April 2016, Clive was Group Finance Director of Audiotonix Limited (an international manufacturer of audio mixing consoles) and until 2001 he was chairman of Baker Tilly (now RSM), having been its national managing partner for 10 years until June 1996. He has also previously chaired or been a director of a number of investment trusts, VCTs and media businesses.
Stephen White (chairman designate)
Stephen qualified as a Chartered Accountant with PwC before starting a career in investment management. He has more than 35 years’ investment experience, most notably as head of European equities at F&C Asset Management, (where he was manager of F&C Eurotrust Plc and deputy manager of the F&C Investment Trust plc) and as head of European and US equities at British Steel Pension Fund. Stephen is also a non-executive director and chairman of the audit committees of BlackRock Frontiers Investment Trust Plc and Aberdeen New India Investment Trust Plc. He is a non-executive director of JP Morgan European Smaller Companies Trust Plc and Polar Capital Technology Trust Plc.
Appendix 1 – outgoing manager details
Jupiter Asset Management
Jupiter Asset Management (JAM) has been JUS’s investment manager since February 2014. It describes itself as a high-conviction, active fund manager that offers a broad range of actively managed strategies to UK and international clients including equities, fixed income, multi-asset and alternatives.
Headquartered in London, Jupiter is a FTSE 250 company, having floated on the London Stock Exchange in June 2010. On 1 July 2020, Jupiter completed the acquisition of Merian Global Investors, an independent UK-based asset management group that is culturally similar to Jupiter. Jupiter says that the acquisition has significantly enhanced its investment capabilities, creating a strong, well-diversified line-up of active, high-conviction and high-performing investment strategies.
Robert Siddles
Robert is a fund manager in Jupiter’s US team. Before joining Jupiter in 2014, he worked at F&C, where he was a US smaller companies fund manager from 2001. Prior to F&C, he spent nine years at Gartmore Investment Management – the last five of these as head of US equities. Before Gartmore, Robert spent five years as a US fund manager at Capel-Cure Myers Capital Management and three years at Coopers & Lybrand, where he became a qualified chartered accountant. He has an MA and DPhil in Chemistry from the University of Oxford.
On 8 October 2020, it was announced that Robert would be retiring from Jupiter Asset Management in April 2021, thereby relinquishing the reins of JUS, a trust he has run for over 20 years.
Appendix 2 – Asset allocation as at the end of January 2021 (under the outgoing strategy)
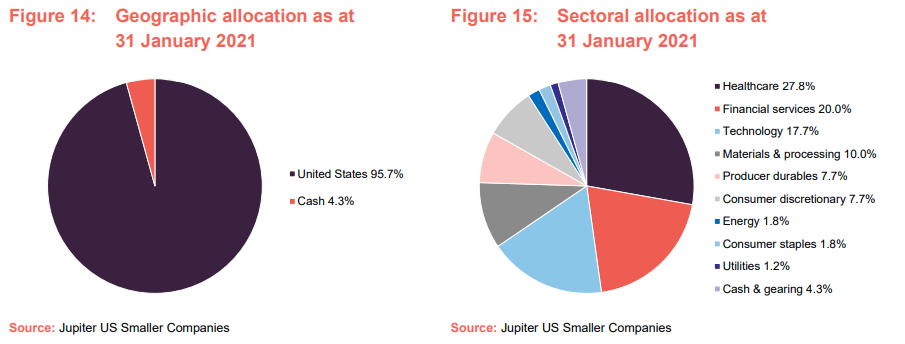
Robert maintains a relatively concentrated portfolio of around 40 holdings, with the top 10 typically accounting for around 40% of the portfolio. As noted in the main body of this note, Robert’s portfolio is constructed bottom-up and bears little resemblance to any of the relevant indices.
Elevated turnover due to COVID-19
Portfolio turnover has typically been in the region of 25% per annum, suggesting an average holding period of around four years. However, some core holdings may be held much longer than this, to capture the benefits of good stock selection. Portfolio turnover increased markedly during the global financial crisis, and again in H1 2020.
Higher volatility creates more opportunities to trade and change positioning, and Robert reviewed the portfolio as the market collapsed, selling stocks whose long-term growth he felt was threatened by the current situation, and replacing these with new stocks that he considers to have strong growth prospects over the next two to three years. In summary, Robert sold eight to nine stocks and purchased a similar number so that the number of holdings remained the same. Earlier in the year, the portfolio was geared but, as at 31 January 2021, the trust was operating with a net cash position of 4.3%.
Top 10 holdings
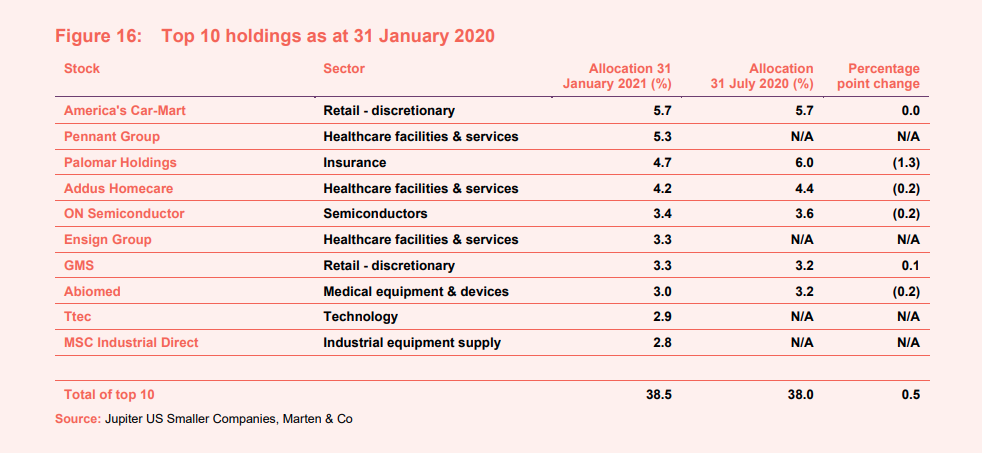
Figure 10 shows the top holdings in the portfolio at the end of January 2021 and how these compare against the allocations as at the end of July 2020 (six months prior). Reflecting both the reasonably concentrated nature of JUS’s portfolio, and the manager’s low-turnover approach, it is usually the case that most of the names in JUS’s top 10 holdings would be familiar to regular followers of the trust. However, as noted above, there is likely to be a radical change in the portfolio as the new manager transitions JUS to its strategy.
The legal bit
Marten & Co (which is authorised and regulated by the Financial Conduct Authority) was paid to produce this note on Jupiter US Smaller Companies.
This note is for information purposes only and is not intended to encourage the reader to deal in the security or securities mentioned within it.
Marten & Co is not authorised to give advice to retail clients. The research does not have regard to the specific investment objectives financial situation and needs of any specific person who may receive it.
The analysts who prepared this note are not constrained from dealing ahead of it but, in practice, and in accordance with our internal code of good conduct, will refrain from doing so for the period from which they first obtained the information necessary to prepare the note until one month after the note’s publication. Nevertheless, they may have an interest in any of the securities mentioned within this note.
This note has been compiled from publicly available information. This note is not directed at any person in any jurisdiction where (by reason of that person’s nationality, residence or otherwise) the publication or availability of this note is prohibited.
Accuracy of Content: Whilst Marten & Co uses reasonable efforts to obtain information from sources which we believe to be reliable and to ensure that the information in this note is up to date and accurate, we make no representation or warranty that the information contained in this note is accurate, reliable or complete. The information contained in this note is provided by Marten & Co for personal use and information purposes generally. You are solely liable for any use you may make of this information. The information is inherently subject to change without notice and may become outdated. You, therefore, should verify any information obtained from this note before you use it.
No Advice: Nothing contained in this note constitutes or should be construed to constitute investment, legal, tax or other advice.
No Representation or Warranty: No representation, warranty or guarantee of any kind, express or implied is given by Marten & Co in respect of any information contained on this note.
Exclusion of Liability: To the fullest extent allowed by law, Marten & Co shall not be liable for any direct or indirect losses, damages, costs or expenses incurred or suffered by you arising out or in connection with the access to, use of or reliance on any information contained on this note. In no circumstance shall Marten & Co and its employees have any liability for consequential or special damages.
Governing Law and Jurisdiction: These terms and conditions and all matters connected with them, are governed by the laws of England and Wales and shall be subject to the exclusive jurisdiction of the English courts. If you access this note from outside the UK, you are responsible for ensuring compliance with any local laws relating to access.
No information contained in this note shall form the basis of, or be relied upon in connection with, any offer or commitment whatsoever in any jurisdiction.
Investment Performance Information: Please remember that past performance is not necessarily a guide to the future and that the value of shares and the income from them can go down as well as up. Exchange rates may also cause the value of underlying overseas investments to go down as well as up. Marten & Co may write on companies that use gearing in a number of forms that can increase volatility and, in some cases, to a complete loss of an investment.