Form is temporary, class is permanent
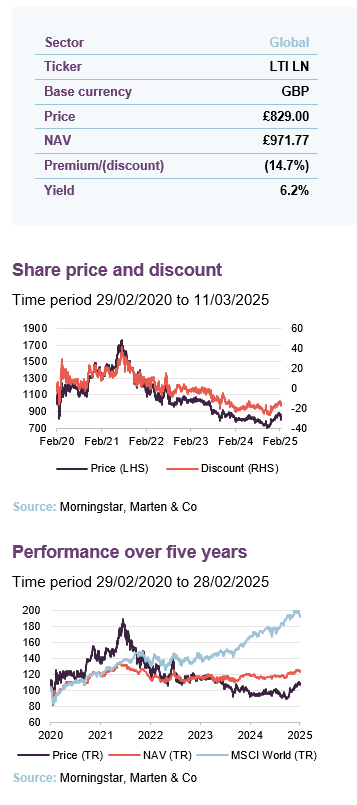
The unique nature of Lindsell Train Investment Trust’s (LTI’s) structure has weighed on its performance over the past four years, after it had enjoyed sustained and monumental success over the preceding two decades. Firstly, the active management approach that is the hallmark of Lindsell Train funds, which is centred on owning a concentrated portfolio of equity holdings that it has identified as exhibiting distinct characteristics (namely heritage companies with predictable earnings, low capital intensity and sustainably high returns on capital), meant that it has failed to keep up with the technology-induced market euphoria of recent years.
Secondly, its large exposure to its investment manager – Lindsell Train Limited (LTL) – has only magnified the issue. Investor outflows from LTL has impaired LTI’s NAV performance and hit investor confidence, with the trust now trading at a 14.7% discount. Given that LTL’s investment philosophy is based on sound fundamentals and has been proven successful through several market cycles, LTI’s rating could look cheap if the pace of outflows were to slow.
Maximise returns over the long-term
LTI aims to maximise total returns over the long term, while preserving shareholders’ capital. It invests in a concentrated portfolio of global equities that it has identified as market-leading and that benefit from high returns on equity. It also invests in a range of Lindsell Train-managed funds and the unlisted security of its investment manager, Lindsell Train Limited.
| Year ended | Share price total return (%) | NAV total return (%) | MSCI World Index (TR) |
|---|---|---|---|
| 28/02/2021 | 38.7 | 20.6 | 18.2 |
| 28/02/2022 | (9.8) | (4.6) | 15.4 |
| 28/02/2023 | (8.3) | 0.2 | 2.7 |
| 29/02/2024 | (20.0) | 3.1 | 19.6 |
| 28/02/2025 | 18.4 | 3.6 | 16.2 |
Fund profile
Concentrated portfolio of 13 global equity stocks plus Lindsell Train funds
Lindsell Train Investment Trust (LTI) aims to maximise investors’ total returns over the long term, with a minimum objective of maintaining the real purchasing power of sterling capital. It invests in a concentrated portfolio of global equities (currently 13, including Finsbury Growth & Income Trust – FGT) that it has identified as heritage companies, as well as a range of Lindsell Train-managed funds (currently just one) and the unlisted security of its investment manager, Lindsell Train Limited (LTL – the management team’s details are available on page 24). The LTL management fee for LT managed funds and other funds that LTL manages are rebated back to LTI, so as to avoid double charging of fees.
LTI’s global equities holdings accounted for 57.8% of LTI’s NAV at 31 January 2025. On a look-through basis, the company has exposure to 53 holdings. For performance measurement purposes, the trust is benchmarked against the MSCI World Index in sterling terms. The benchmark has no influence over portfolio construction and LTI’s active share is always likely to be close to 100%.
LTI was established in 2001 to help fund LTL, to seed new products and to provide investors with the opportunity to share in the manager’s potential. It is listed on the premium segment of the main market of the London Stock Exchange. LTI’s board of directors is the company’s AIFM and receives no remuneration in this regard.
The Lindsell Train approach
LTL was launched in 2000 by Michael Lindsell and Nick Train. It launched LTI and was appointed manager of Finsbury Growth & Income Trust in 2001, and throughout the 2000s it launched and was appointed manager of several funds with global, UK, Japanese, and North American mandates. All of the funds it manages have an overarching investment theme of holding what it deems to be exceptional companies for the very long term. The LT Global Equities strategy, for example, was launched in 2011 and has invested in 32 companies over its history, with just eight positions exited in almost 14 years.
Risk better reduced through owning small number of high conviction companies than through diversification
LTL’s portfolios are highly concentrated, reflecting its belief that risk can be better reduced by owning a small portfolio of high-conviction companies than through diversification. The focus is on companies with durable competitive advantages that can achieve sustainably high returns on capital, and it is not overly concerned by short-term earnings performance. These companies tend to be heritage companies, reflected in the average age of LTI’s direct equity holdings of 147 years.
Symbiotic relationship with LTL
LTI has a symbiotic relationship with LTL, where it uses its balance sheet to invest in Lindsell Train funds to help get them off the ground, and benefits from their growth.
LTI seeded LTL with a £66,000 investment at launch, and that investment has grown exponentially as LTL’s huge success with the strategy, and from growing funds under management (FUM) through its first two decades. To illustrate this, LTL made up just 0.3% of LTI’s NAV at inception, but grew to 48% at its peak in 2021. It has fallen back somewhat to 27.3% at 31 January 2025, as poor relative performance over the past four years has seen investor outflows and LTL’s FUM fall from £24.3bn (in July 2021) to £13.4bn at 30 September 2024.
Market backdrop
Market returns driven by mega-cap US tech stocks
Without doubt, the defining contribution to LTL’s and LTI’s poor performance over the past four years (and led to investor outflows from LTL) has been its lack of participation in the enormous technology rally around the emergence and prospects of artificial intelligence (AI) that has spawned the rise of the so-called ‘Magnificent 7’ mega-cap US stocks, and driven market returns. This has played into the hands of passive strategies at the expense of active managers. LTL’s fundamental principle of holding companies that it classifies as heritage for the very long term in a concentrated portfolio has meant that the largest companies in the world today do not readily fit its investment criteria, especially around low capital intensity.
The lack of LTI’s participation in the tech rally is illustrated in its performance relative to the MSCI World Index, shown in Figure 1. Prior to this, however, both LTL and LTI enjoyed tremendous success over an extended period of time, comfortably outperforming the MSCI World Index.
Figure 1: LTI NAV total return versus MSCI World Index1
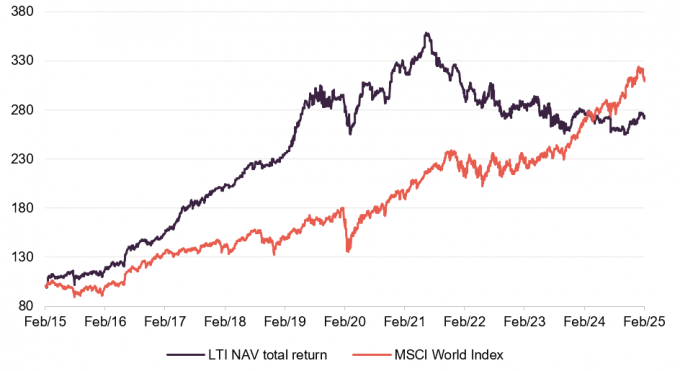
Source: Morningstar, Marten & Co. Note 1) rebased to 100 at 28 February 2015
LTI’s shares once traded on a premium in excess of 40%
Reflecting the change in the investment landscape, and its impact on the value of LTL, the company’s rating has moved from a premium in excess of 40% in 2021 to a 14.7% discount at the time of publishing this note.
It is difficult to determine when a change in market sentiment will come about and the intense investor focus on the narrow group of technology companies dissipates and broadens. In the meantime, LTL’s focus continues to be on the key business fundamentals, primarily return on equity, that have brought it great success for more than two decades.
LTL’s exposure to the technology sector has been through data companies and technology-advantaged entertainment companies, all of which exhibit relatively low capital intensity. London Stock Exchange Group (LSEG), LTI’s largest holding excluding LTL (details on the portfolio holdings are on page 10 and a profile of LSEG is on page 17), has a capex to revenue ratio of just 2%. Meanwhile, other LTI portfolio holdings Nintendo, RELX and Universal Music Group (UMG) have all reported average capex at 1% of sales over the last 10 years.
This compares to the capital intensity of the US technology leaders, which are investing vast sums in equipment and data centres to satisfy potential demand for AI products, where Meta’s equivalent capex figure over the last 10 years was 19%, Alphabet’s 13% and Microsoft’s 11%. Capex has ramped up over the last few years, however, with Meta forecasted to invest 24% of revenue in 2024, while Microsoft planned to spend 22%.
Of course, if this capex commitment earns similar or greater returns on capital than these companies have enjoyed previously, and they are able to monetise AI products, it would more than justify their market valuations. This is by no means guaranteed, however. The launch of a large language model (LLM) product by Chinese AI company DeepSeek in February was reportedly built at a mere fraction of the spend of equivalent western AI models with similar outcomes (although the reports should be taken with a degree of scepticism, given the geopolitics involved in the global AI war). If it proves to be the case that the advancement of AI can be achieved at relatively low capex, and barriers to entry fall, then the potential monetisation of AI products will be severely impaired.
High capex and valuations in tech sector has led to comparisons to the dot.com bubble
Technology capex, led by the hyperscalers, and the lofty valuations that the technology sector trades on, have led many commentators to assess that the sector has entered bubble territory, akin to the dot.com crash experienced in the early 2000s. The S&P 500 technology sector’s forward P/E is at post-global financial crash highs, and relative to the S&P 500 forward P/E is around 1.3x. There is still some way for it to go to reach the 2.0x levels of the dot.com bubble.
IT budget forecasts for 2025 have been raised to $5.75trn by Gartner; a 9.5% year-on-year increase, the highest annual growth rate since 2011. This is anticipated to follow 7.2% growth in 2024, marking the strongest back-to-back increase in expected annual IT spending so far this century.
Figure 2: Global IT spending forecast
| 2024 spend ($bn) | 2024 growth (%) | 2025 spend ($bn) | 2025 growth (%) | |
|---|---|---|---|---|
| Data centre systems | 318.0 | 34.7 | 367.2 | 15.5 |
| Devices | 735.8 | 6.2 | 805.7 | 9.5 |
| Software | 1,087.8 | 11.7 | 1,239.8 | 14.0 |
| IT services | 1,587.9 | 5.6 | 1,737.8 | 9.4 |
| Communications services | 1,530.3 | 2.0 | 1,596.9 | 4.4 |
| Total | 5,259.8 | 7.2 | 5,747.3 | 9.3 |
Other factors that have contributed to LTI’s wide discount may include the rate of outflows at LTL, succession risk and the general level of discounts that investment trusts are currently trading on due to considerations such as a historically weak UK equities market and the impact of cost disclosure rules on the sector.
Succession planning
Greater investment decision making responsibility spread throughout wider team
Both Michael and Nick state that they remain as committed today as they ever have been but are also working to ensure that the Lindsell Train business will survive for generations to come. This involves careful, strategic and patient succession planning – a process that is well underway, both in terms of transition of responsibility and equity. Nick and Michael remain at the heart of the business, but greater responsibility, idea generation, and investment decision-making contributions are coming from the ‘next generation’.
For example, James Bullock is a director of LTL and runs the North American Equity Fund and has been co-portfolio manager on the Global Equities strategy (which includes LTI) since 2015, while Madeline Wright, Alexander Windsor-Clive and Ben van Leeuwen are all deputy portfolio managers (for the UK Equities, North American Equities, and Global Equities portfolios respectively). Together, these four have a combined 43 years of service at LTL (the investment team profiles can be found on page 24).
Michael says that a huge amount of investment has been made in the new leadership team, and he expects to see their level of responsibility and decision-making authority grow.
The remuneration of the wider team reflects the evolving roles among the investment team. Remuneration paid to Nick and Michael has been falling as a percentage of LTL’s total remuneration. Profit share and one-off payments to new directors and other key staff increased by 103% to 40% of the overall remuneration. Half of these (virtually all of them after tax) are mandated to fund the purchase of LTL shares from Nick, Michael and LTI, helping to accelerate the transfer of ownership to potential successors. This equates to around 1.5% of LTL per year.
The board has stated that the changes represent part of a long-term plan to ensure that the company remains true to the investment and business principles that will remain consistent even if the personnel changes.
Economic and geopolitical backdrop
Inflation proving sticky, impacting rate cutting cycle
Globally, the economic and political landscape could not be more fraught. The pace of interest rate reductions in the western economies is proving slower than most commentators predicted. Central banks’ ability to continue on the rate-cutting cycles that began last year may be constrained by sticky inflation above the 2% target.
Inflation in both the US and the UK unexpectedly rose to 3% in January, while in Europe it ticked up to 2.8%. Taming inflation is likely to be the most influential macroeconomic factor in global equity market performance, given the strong correlation between inflation movements in developed markets and equity returns, as shown in Figure 3.
Figure 3: Performance of global equities versus change in developed market inflation
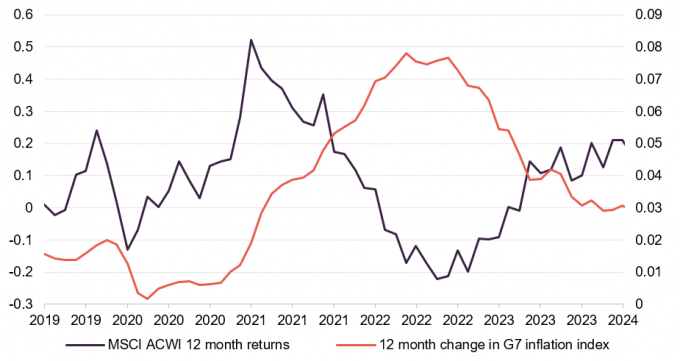
Source: Bloomberg
Geopolitical tensions risen since Trump’s election
Not only are central banks monitoring inflation, employment data and economic growth forecasts, US president Donald Trump’s bombastic first few weeks in the White House have given rise to the real prospect of global, reciprocal tariffs. Central banks will have to consider the impact of them in their decision-making.
Reciprocal tariffs a real threat
Trump has imposed 10% levies on all imports from China, plus 25% duties on steel and aluminium imports, and on 4 March placed 25% tariffs on goods from Mexico and Canada. Several senior Federal Reserve officials had already indicated that these would likely fuel fresh inflationary price pressures.
Higher-for-longer interest rates will continue to curtail economic growth. US GDP expanded 2.3% in the fourth quarter of 2024, while UK and European economic growth were both anaemic at 0.1%.
For LTL, short-term market noise has always been looked past in favour of the long-term credentials of its portfolio companies, which have survived countless market cycles. The manager is unlikely to change tact now.
The US tariffs on Canada and Mexico, plus any future tariffs on the EU and the UK and any other country that suits the Trump agenda, do leave some of LTL’s portfolio companies exposed to short-term pain. This is most noticeable in the discretionary consumer sector and alcohol companies, in particular.
Diageo would be adversely hit by US tariffs
A large portion of products from spirits giant Diageo are imported to the US from Mexico and Canada (around 45%), including tequila from Mexico and whisky from Canada. Diageo’s earnings are expected to take a hit from the 25% tariff on US imports from Canada and Mexico. Diageo scrapped its medium-term sales guidance in recent results, blaming the uncertainty that proposed tariffs had caused, as well as consumer volatility in key markets. We explore Diageo in detail on page 18.
There is currently a huge amount of uncertainty over the tariffs and their impact. In any event, the manager says that over the long term the tariffs will have little impact on the companies, and it has even taken the opportunity to add to its position in Diageo in some accounts.
Investment process
Investment universe of 150 companies
Given the strict investment criteria that LTL adheres to, under which it seeks heritage companies that have predictable earnings (through pricing power and/or intellectual property), low capital intensity and sustainably high returns on capital – it has a very small universe of potential investments, usually no more than 150 at any one time. As such, LTI has operated with a very concentrated portfolio since launch in 2001, with an average number of equity holdings over that period of 15 (currently 13).
Reflecting these characteristics, the manager says that it has found the majority of candidates fall into a select group of broad industry categories, being:
- Consumer branded goods;
- Internet, media, software; and
- Financials and networks.
Bottom-up approach without reference to benchmark
The portfolio is constructed on a ‘bottom-up’ basis and without any reference to benchmark weights. Potential investments are subjected to an intensive due diligence process (sometimes over multiple years), which includes meetings with management and an analysis of relevant industries.
The manager values potential investments using a variety of approaches, the most important being a discounted cash flow calculation, and those that are deemed ‘best value’ form the portfolio.
ESG
Signatory of UN Principles for Responsible Investment
LTI’s manager is a signatory to the United Nations Principles for Responsible Investment, UK Stewardship Code, and the Net Zero Asset Managers. It actively engages with portfolio companies on ESG matters including climate change, and calculates the total carbon emissions, carbon footprint (tCO2e/$m invested) and carbon intensity (tCO2e/$m sales) of its portfolio to identify which stocks are most exposed to climate-related risks.
LTL believes that companies which observe high ESG standards will not only become more durable but will likely prove to be superior investments over time. Therefore, the evaluation of ESG factors is an inherent part of LTL’s investment process. Factors include environmental (including climate change), social and employee matters (including turnover and culture), governance factors (including remuneration and capital allocation), cyber-resilience, responsible data utilisation, respect for human rights, anti-corruption and anti-bribery, and any other risks or issues facing the business and its reputation.
ESG factors influence portfolio decisions
If, as a result of this assessment, LTL believes that an ESG factor is likely to materially impact a company’s long-term business prospects (either positively or negatively) then this will be reflected in the long-term growth rate that is applied in the investment team’s valuation of that company, which – alongside the team’s more qualitative research – will influence any final portfolio decisions (for example, whether LTL starts a new position or sells out of an existing holding).
As a product of LTL’s investment philosophy, it does not invest in the following industries:
- capital intensive industries (energy, commodities or mining) or any companies involved in the extraction and production of coal, oil or natural gas; and
- industries that it judges to be sufficiently detrimental to society that they may be exposed to burdensome regulation or litigation that could impinge on financial returns (such as tobacco, gambling or arms manufacturers).
LTL engages proactively with the management of portfolio companies on a wide range of environmental, societal and governance related issues. Engaging with and monitoring portfolio companies on matters relating to stewardship is an essential element of LTL’s investment strategy. Its long-term approach generally leads it to be supportive of company management. However, where LTL disagrees with a company’s actions, it will try to influence management on specific matters or policies.
Investment policy and restrictions
LTI’s investment policy allows it to invest in:
- a wide range of financial assets (including equities, unlisted equities, bonds, funds, cash and other financial investments) globally with no limitations on the markets and sectors, with any one company not exceeding 15% by value of its gross assets;
- LTL-managed fund products, subject to board approval, up to 25% of its gross assets; and
- LTL, and to retain a holding in order to benefit from the expected long-term growth of the business.
LTI will not make investments for the purpose of exercising control or management and will not invest more than 15% of gross assets in other closed-ended investment funds.
Exits
Low single-digit portfolio turnover rate
LTL has a low-single-digit portfolio turnover rate, in line with its investment philosophy, and LTI’s is lower still. Once LTL has committed to investing in a company, it generally holds it for the long term, reflecting its conviction that owning great companies for the long haul makes sense. For it to reduce or exit a portfolio company, it would need a compelling reason such as persistently poor performance, the stock price moving sufficiently beyond its judgement of the company’s intrinsic value, or that the barrier to entry that it enjoyed in its particular sector no longer exists and therefore the premise for the investment was no longer valid.
Long-term holding avoids transaction fees
By holding for the very long term and dealing infrequently, the company avoids transaction costs, which it deems a tax on capital. This investment approach requires extreme patience and the ability to ignore market noise to remain focused on a company’s competitive advantages.
The last holding that was exited by LTL was publisher Pearson in 2022, which struggled to monetise its industry leading content over a prolonged period and then shifted its strategic focus to other areas.
Having an alternative investment proposition lined-up with meaningful upside potential is also a consideration in the decision on exiting or cutting a position. The manager says that, at any given time, it usually has two or three investments (which meet its criteria and on which it has completed due diligence) that it could invest in.
Asset allocation
Figure 4: Breakdown of LTI’s portfolio at 31 January 2025
Figure 5: LTI portfolio by location of underlying revenue at 30 Sept 20241
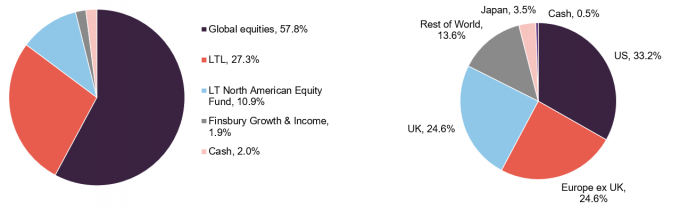
Source: Lindsell Train Investment Trust
Source: Lindsell Train Investment Trust. Note 1) On a look-through basis, aggregating direct holdings with indirect holdings held by LTL funds
At 31 January 2025, almost 60% of LTI’s portfolio value was from global equities, with LTL making up 27.3%. A third of underlying portfolio revenue originated from the US (on a look-through basis including positions in LTL), while Europe and the UK both accounted for a quarter of revenues.
Figure 6: LTI holdings at 31 January 2025
| Stock/holding | Sector | As at 31/01/25 (%) | As at 31/07/24 (%) | Change(%) |
|---|---|---|---|---|
| Lindsell Train Limited (LTL) | Unlisted security | 27.3 | 30.2 | (2.9) |
| London Stock Exchange Group | Financials | 13.7 | 11.0 | 2.7 |
| Lindsell Train North American Equity Fund | LTL managed fund | 10.9 | 9.9 | 1.0 |
| Nintendo | Communication services | 10.6 | 8.8 | 1.8 |
| RELX | Industrials | 7.1 | 6.6 | 0.5 |
| Diageo | Consumer staples | 5.0 | 5.1 | (0.1) |
| Unilever | Consumer staples | 4.5 | 5.2 | (0.7) |
| PayPal | Financials | 3.3 | 2.5 | 0.8 |
| A.G. Barr | Consumer staples | 3.1 | 4.0 | (0.9) |
| Mondelez International | Consumer staples | 2.8 | 4.0 | (1.2) |
| Universal Music Group | Communication services | 2.1 | 1.1 | 1.0 |
| Thermo Fisher Scientific | Healthcare | 2.0 | 0.0 | 2.0 |
| Finsbury Growth & Income Trust Plc | Financials | 2.0 | 1.8 | 0.2 |
| Heineken | Consumer staples | 1.7 | 2.5 | (0.8) |
| Laurent-Perrier | Consumer staples | 1.7 | 1.9 | (0.2) |
| Cash & equivalent | – | 2.2 | 5.4 | (3.2) |
Investment case studies
To illustrate LTL’s investment approach in action, we have looked at two of its more recent investments – Universal Music Group and Thermo Fisher Scientific – in greater detail here before looking at LTL and its other positions.
Universal Music Group (UMG)
Figure 7: UMG (EUR)
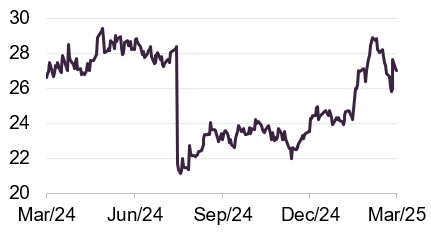
Source: Bloomberg
One of the trust’s most recent additions was UMG, in which it bought a position at the end of 2023. LTL had followed the company for two years after its spin out from Vivendi in 2021, over which period its shares had languished below the IPO price.
At a $50bn market cap, UMG is the world’s leading music company, built through generations of consolidation, and supplies roughly a third of the world’s recorded music (ahead of the other two major players Sony and Warner). The majority of its revenues come from the ‘recorded’ division, which helps artists produce, market and distribute recordings in exchange for the underlying copyright. It then licenses this content out to a huge ecosystem of partners including Spotify, YouTube and Meta. A further chunk of revenues is derived from its publishing division, where it signs multi-decade exclusive publishing contracts with songwriters, helping them to maximise the commercial potential of their songs. As a publisher, it also holds nearly a quarter of all songs ever written.
Music engagement levels are rising with the growth of subscription streaming platforms such as Spotify, Apple Music and Amazon Music, as well as YouTube and other social media, and new distribution modes such as video games rapidly emerging. Streaming music has returned the industry to health following a period where downloads dominated music consumption and heralded the rise of digital piracy that obliterated revenues, as shown in Figure 8. Revenues have still not returned to their previous peak, but have steadily grown since 2015.
Figure 8: US recorded music revenues by format ($m, adjusted for inflation)
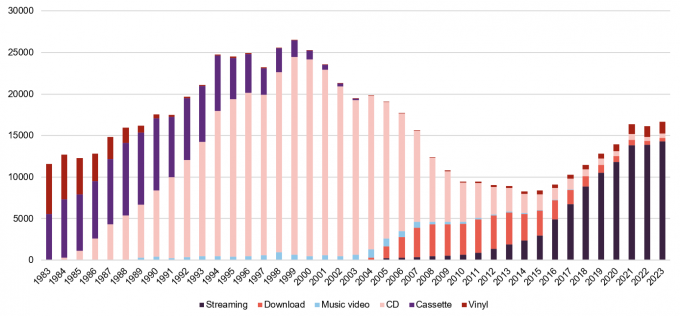
Source: Recording Industry Association of America, 2023
The advent of streaming has made record labels into better businesses and improved the quality of their earnings. Platforms incur all the customer acquisition and distribution expenses, allowing the record labels to enjoy capital-light licensing revenues. One-off album purchases have transformed into growing, annuity-like subscription revenue streams, with back catalogues being remonetised at high incremental margins (due to the costs to create the content being expensed long ago).
UMG’s existing content locks in a certain level of ongoing success, with more than half of its recorded music revenue derived from its historic catalogue. UMG then uses this foundation to invest more than its peers in new content, leverage its scale to negotiate better terms for its artists, and use its reputation to attract the best artists.
Whilst consumption of music is increasing, there remains a long runway ahead for subscriber growth. There are currently 670m users that pay for an audio streaming subscription, which is expected to surpass 1bn by 2028.
Figure 9: Total Spotify streams by record label – top 50 artists (billion)
Figure 10: Average revenue per user – cost per consumption hour ($)
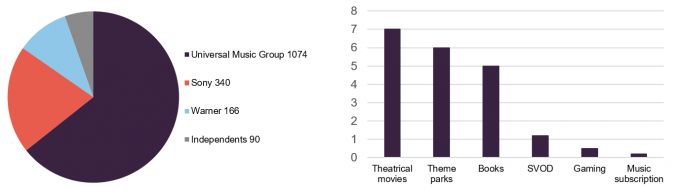
Source: Chartmasters, Spotify, IFPI, Goldman Sachs, Lindsell Train
Source: Analyst estimates, Company data, Deezer, Lindsell Train. Note: SVOD = subscription video on demand
Monetisation has so far eluded music streaming industry
There is considerable potential for the music industry to achieve better value for its content. When compared to other forms of entertainment, audio subscription is vastly under-monetised, as shown in Figure 10, and there seems sufficient scope for streaming platforms to raise their pricing levels accordingly following a decade of flat pricing. Additionally, more sophisticated pricing ladders are set to be introduced in the coming years to capture the ‘superfan’ opportunity. Spotify, for example, is mooted to be planning the launch of ‘Music Pro’ this year, which will be priced above the current premium subscription band and include ‘superfan’ perks such as early access to concert tickets, AI-powered remix features, and higher-quality audio. It is believed that more advanced features and fan engagement perks may be added in later years.
Streaming platform payout models to evolve
Furthermore, the payout model currently used by the streaming platforms – based on a simple pro-rata share of listening – is expected to improve and evolve too, and could follow a model already implemented by Deezer, the French streaming platform. This includes minimum streaming thresholds, a multiplier for more popular songs and the proactive removal of fraudulent tracks from the royalty pool. All of these initiatives would be particularly beneficial for owners of the highest quality content, like UMG, given how the most popular artists account for the vast majority of all listening consumption.
The LTL team believes that investors are underestimating the impact of these tailwinds, and UMG therefore is substantially mispriced by the market. UMG currently delivers high-single-digit revenue growth, has strong cash flow conversion, low-double-digit bottom-line growth, and an average return on equity over last three years of 40%.
Thermo Fisher Scientific
Figure 11: Thermo Fisher (USD)
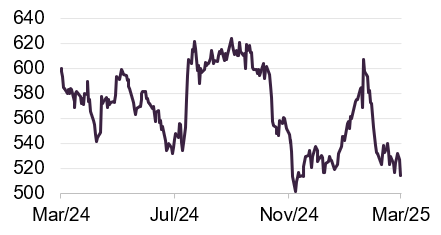
Source: Bloomberg
LTI’s most recent portfolio addition was the life science tools company Thermo Fisher, which was added at the end of 2024 with an initial portfolio weighting of 2%. As the largest player in global life sciences tools and diagnostics, Thermo Fisher provides lab equipment, analytical instruments, diagnostic tests, and contracted research and manufacturing services to the pharmaceutical industry, benefitting from an exponential rise in government and commercial healthcare spend (which has historically seen R&D budgets expand by at least 3% to 5% per annum) to $145bn in 2024.
Having been long-time admirers of the company and first meeting with management in 2021, the LTL team say they were attracted to Thermo Fisher because the company benefits from the pharmaceutical industry’s positive dynamics and increased R&D spend without having to take on the individual risk associated with the drug gaining patent approval, or expiry of that patent.
Drug companies secure patent protection for drugs for only limited periods of time (typically 15-20 years), which means it needs a conveyor belt of innovation to prevent patent expiries from denting sales. This uncertainty has led LTL to be cautious about investing in drug companies, with its only investments in pharmaceutical companies being in Japan, where valuations have been low enough to mitigate patent risk, providing an attractive entry point.
80% of $40bn annual revenue is recurring
In designing and manufacturing the advanced equipment, Thermo Fisher plays a critical role in the business of drugs companies. Often Thermo Fisher is the third largest cost on major pharmaceutical companies’ income statements, after staff wages and rent. When a company creates a brand-new drug, the patent approval will often specify the use of Thermo Fisher’s reagents or machines for all future manufacturing. This feeds into the ‘trusted partner’ status it enjoys and its extremely ‘sticky’ sales. Around 80% of its $40bn revenues are recurring, with some customers spending over a billion dollars a year with them.
Furthermore, drug manufacturing is becoming increasingly complex, with a steady shift away from small molecule drugs to biologics. Thermo Fisher is a direct beneficiary of this trend, the manager contends, as a greater amount of more expensive equipment is required.
The fundamentals of the company stack up for LTL. It boasts double-digit margins and returns to equity averaging around 20% to 25%, which should only increase with scale, and it is targeting high-single-digit revenue growth (composed of industry growth boosted by ongoing share gains, positive pricing, and bolt-on acquisitions) and mid-teens earnings growth (supported by 50bps of margin expansion and buybacks).
However, its share price has been flat for the past five years, while customers and shareholders digested the Covid boom. This has left Thermo Fisher trading on a low-20s earnings multiple, which proved an attractive entry point for LTL. Whilst the current dividend yield is low at 0.3%, the 15% dividend per share CAGR over a five-year period is impressive.
LTL and Lindsell Train funds
LTL
LTI’s largest exposure by some distance is its holding in LTL, which at the end of January 2025 was 27.3% by their valuation method. As mentioned earlier, LTI invested £66,000 in LTL at launch, with the investment making up just 0.3% of LTI’s portfolio at that time. The success of LTL in the years after its launch saw the value of this initial £66,000 investment grow exponentially and at one point was worth £114.2m.
That has since fallen back as poor performance and substantial investor outflows have seen funds under management (FUM) at LTL drop from £24.3bn (in July 2021) to £13.8bn in July 2024, as shown in Figure 12, and £13.4bn at 30 September 2024. LTL runs five Lindsell Train-badged pooled funds, which represented 60% of FUM at end of July 2024, down from 64% the year before due to outflows.
Figure 12: LTL funds under management over 10 years
| July 2024 (£m) | July 2023 (£m) | July 2022 (£m) | July 2021 (£m) | July 2020 (£m) | July 2019 (£m) | July 2018 (£m) | July 2017 (£m) | July 2016 (£m) | July 2015 (£m) | |
|---|---|---|---|---|---|---|---|---|---|---|
| Opening FUM | 17,505 | 19,562 | 24,298 | 21,151 | 22,563 | 15,304 | 11,326 | 8,045 | 5,758 | 3,897 |
| Change in FUM | (3,683) | (2,057) | (4,736) | 3,147 | (1,412) | 7,259 | 3,978 | 3,281 | 2,287 | 1,861 |
| Market movement | 603 | 1,054 | (1,271) | 3,040 | (1,385) | 4,568 | 2,044 | 1,530 | 979 | 1,053 |
| Net fund inflows/(outflows) | (4,286) | (3,111) | (3,465) | 106 | (27) | 2,691 | 1,934 | 1,751 | 1,308 | 808 |
| Closing FUM | 13,822 | 17,505 | 19,562 | 24,298 | 21,151 | 22,563 | 15,304 | 11,326 | 8,045 | 5,758 |
Figure 12 shows LTL’s FUM journey over the past 10 years, being just under £4bn in July 2015 and growing substantially over the next six years (the Covid-impacted 2020 an exception) through a combination of portfolio performance and investor inflows. Sentiment changed in 2022 as central banks moved to quantitative tightening policies to quell the impact of higher inflation and, as mentioned previously, investors turned to a small number of technology-focused stocks that have driven market returns over the past two years. This has understandably drawn substantial investor capital away from LTL. It would take a stabilisation of outflows for confidence in LTI’s future NAV performance to grow, which could in turn trigger a narrowing of its discount (more on LTI’s discount on page 22).
LTL’s investment approach, as previously described, is uniformly followed across all of its funds, and therefore recent relative performance has suffered due to not participating in the tech rally.
80% of LTL profits distributed as dividends
Annual management fees make up the lion’s share of LTL’s total revenues (around 99%), with interest income the remainder. LTL aims to distribute dividends equivalent to 80% of its net profits in each year. Total dividends paid in the year to 31 January 2024 (LTL’s latest year end) were £1,462 per share, down from £1,841 per share in the previous year. LTL has a healthy balance sheet, with just over £103m in cash reserves (at 31 January 2024, its latest year end) which should allow it to weather periods of business pressure.
LTL’s salaries and bonuses are currently capped at approximately 26% of fees. Should FUM fall below £11bn, the cap would be compromised. In this scenario, it is likely that the cap would be lifted, which would impact the level of dividends LTL is able to pay. The board already applies a higher salary cost of 45% of revenues to determine a notional figure for when calculating LTL’s net profits to determine the valuation of LTL on its books (see below), which it does to cover the eventuality that it needed to suddenly replace the founders with outside talent and/or supplement rewards to potential successors.
Valuation methodology
LTL is valued on LTI’s books monthly by calculating the ratio of LTL’s notional annualised net profits to FUM and adjusting this figure according to the table below. The corresponding percentage in the right-hand column is then applied to LTL’s FUM to devise its value.
Figure 13: LTL valuation methodology
| Notional annualised net profits1/FUM (%) | Percentage of FUM used to value LTL |
|---|---|
| 0.15 – 0.16 | 1.70% |
| 0.16 – 0.17 | 1.75% |
| 0.17 – 0.18 | 1.80% |
| 0.18 – 0.19 | 1.85% |
| 0.19 – 0.20 | 1.90% |
| 0.20 – 0.21 | 1.95% |
| 0.21 – 0.22 | 2.00% |
| 0.22 – 0.23 | 2.05% |
| 0.23 – 0.24 | 2.10% |
For instance, LTL’s annualised notional net profits were £24.7m and its FUM was £13.4bn at 30 September 2024. The ratio between the two as a percentage was calculated as 0.185% resulting in a percentage of FUM of 1.85% and a valuation of LTL of £247.1m or £9,269 per share.
For more information on LTI’s valuation methodology for LTL see page 88 of LTI’s annual report here
The current methodology was approved and applied to monthly valuations from March 2022 and was independently reviewed by JPMorgan Cazenove in January 2024. The methodology is also reviewed at the end of each quarter by LTI’s board. We believe that the valuation methodology implemented by LTI’s board is fair and accurate, and ensures future profitability of LTL is reflected appropriately in its valuation, both on the upside and the downside. LTL’s strong balance sheet and cash reserves are not accounted for in the valuation.
Lindsell Train North American Equity Fund
A top-three holding for LTI, the North American Equity fund, run by James Bullock, has generated a 56% gain since its launch in 2020 to September 2024. It holds 26 stocks, split 52% in the media and software sectors (including stocks such as Alphabet, Intuit and Oracle); 27% in consumer and healthcare (including Nike, Coca-Cola and Brown-Forman); and 20% in financials and networks (including American Express, Visa and PayPal).
Other portfolio companies and investment trust holdings
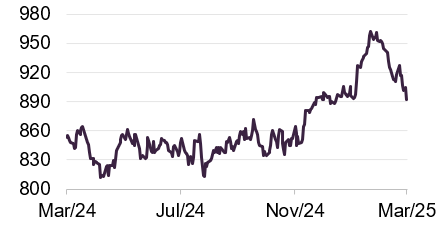
London Stock Exchange Group (LSEG)
Figure 14: LSEG (GBP)
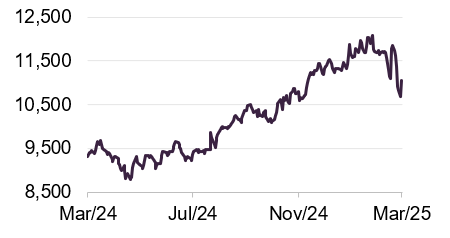
Source: Bloomberg
LSEG is LTI’s largest public-market equity holding, as well as across LTL’s client accounts. The manager believes that LSEG’s range of services to global financial institutions (including must-have data, access to deep liquidity pools and business-critical clearing services) is unmatched and impossible to replicate. After its integration of Refinitiv, which it acquired in 2021, product innovations, competitive displacements, and strong retention rates have all contributed to an accelerating top line. The manager adds that the best is yet to come for LSEG following its joint venture with Microsoft, announced in 2022, with notable upcoming product launches including Meeting Prep, Interoperability, Entra, the first Data-as-a-Service (DaaS) dataset, and Open Directory. The manager argues that the latter product is particularly noteworthy, as it represents a direct challenge to Bloomberg Chat, often cited as one of the key supporting pillars of the competing Bloomberg ecosystem. This should lead to increased pricing and revenue growth in the coming years. LSEG’s shares recently hit an all-time high and gained 24.7% over the last 12 months.
Nintendo
Figure 15: Nintendo (JPY)
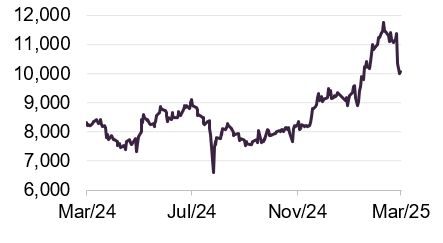
Source: Bloomberg
Nintendo’s share price rose 28% in 2024 and a further 10% in January alone as investor excitement over the launch of the Switch 2 console grows. It is expected that the new console will be released in June, and LTL says that it has high hopes the console will be well received and drive revenues and profitability to new highs, with more games sold by download (which are significantly higher-margin than physical copies). Specifications revealed by the company so far indicate a 4x increase in console storage capacity, which should support further growth in Nintendo’s digital sales ratio. Further, the new console’s memory capacity is 3x greater than the last, which should enable the company to run software at the same level as competing products and attract existing Nintendo users and other gamers.
With earnings likely to be down 40% in full-year 2025 and the share price up, the shares are not as cheap as they were a year ago. However, the manager says that if the console transition proceeds smoothly, earnings should take off and further share price gains could follow.
RELX
Figure 16: RELX (GBP)
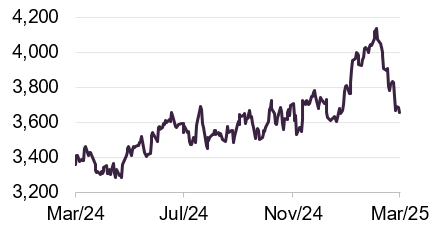
Source: Bloomberg
RELX is a major holding for LTI and across Lindsell Train’s other client accounts. The company is recognised as one of the outstanding data businesses in the world, providing services to the global scientific, legal and insurance industries. The manager believes that it has a credible opportunity to become a preferred provider of AI-powered services too. These AI-enabled offerings include its legal analytics platform Lexis+ and its next-generation personalised legal AI assistant, Protégé. Ben says that RELX’s vast and proprietary datasets, leading brands, and well-established user base stand it in good stead to be an AI beneficiary rather than victim, and its AI-enabled tools will prove a boon to the legal profession going forward. The shares are up 8.8% over the last 12 months.
Diageo
Figure 17: Diageo (GBP)
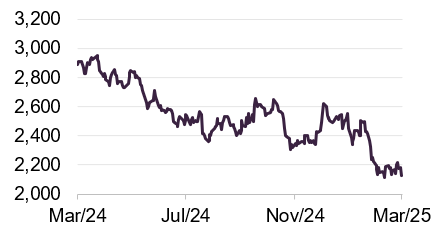
Source: Bloomberg
Another major LTI holding is drinks brand Diageo, which owns some of the best-selling premium spirit brands globally, including the number one spirit brand Johnnie Walker whisky, as well as the number one premium scotch, gin, vodka and stout. It has been an extremely difficult two or three years for Diageo, following a Covid boom in sales. In the period 2011 to 2022, its share price rose 357% (14% per annum) but over 2023 and 2024 it was down 28%.
There appear to be many uncertainties holding back its performance – with the impact of US tariffs (which we discussed on page 7) adding to fears. Alcohol consumption is falling, with the IWSR reporting that US per capita alcohol consumption down 2.6% over 2023 and predicting it to fall further in 2024. Several studies have indicated that under-25s were drinking less than older generations, although the manager points out that surveys are notoriously unreliable, as people tend to play down their drinking levels. The proportion of US adults that drink appears to have remained consistent since 1939 – between 55% and 71%, with 2023 at 62%, according to global analytics firm Gallup.
LTL maintains that premiumisation remains a vital development in the alcohol market. The trend of consumers trading up into better-quality, higher-value products has delivered a 1.5% per annum tailwind to the US market over the past 60 years, the manager states. This has seen spirits take share from other alcoholic drinks and the US per capita consumption of spirits increase versus 2019 levels.
Asia presents a growth opportunity for the company, the manager contends. Despite the continent representing 60% of the global spirits market, LTL believes that pockets of growth are still to come, such as in India where despite a 150% import tariff, scotch whisky sales have grown 60%, with Diageo the market leader. Also, the manager believes China to present a longer-term opportunity, with whisky imports growing four-fold over last decade, but international spirits still amounting to just 1% of those consumed. The no/low-alcohol market represents another growth area for Diageo.
Finsbury Growth & Income Trust
Figure 18: FGT (GBP)
Source: Bloomberg
LTI has a small holding in the £1.4bn market cap investment trust Finsbury Growth & Income (FGT), which is managed by Nick Train. Since its original investment in 2001, the share price has increased 4.8x, despite recent poor performance, and the current dividend yield on the original book cost is over 10%.
FGT is focused on the UK equity market and while a number of LTI’s holdings overlap with those of FGT, including RELX, London Stock Exchange Group, Diageo and Unilever, FGT has a far greater exposure to the consumer discretionary sector, including an investment in Rightmove. Two new holdings have recently been added to FGT’s portfolio: Clarkson, a global shipbroker; and Intertek, a chemical testing and quality assurance firm.
Performance
As discussed at length throughout this note, LTI is a unique investment proposition, and so comparisons with benchmarks and the peer group should be looked at in the context of the exceptional characteristics that have played out in the market over the past few years – namely, a small number of mega-cap technology companies driving market returns. Figure 19 illustrates the point, with LTI’s relative NAV total return performance substantially down versus the MSCI World Index and its peer group over the past five years.
Figure 19: LTI NAV total return performance relative to benchmark and peer group1
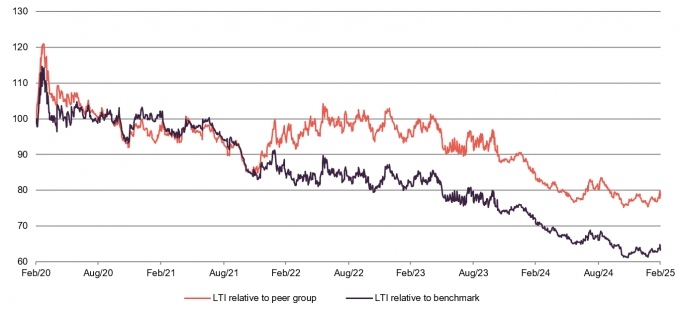
Source: Morningstar, Marten & Co. Note 1) peer group is defined on page 20.
Despite the poor performance over five years, LTI’s 10-year NAV total return is greater than both the peer group and the benchmark, as shown in Figure 20.
Figure 20: Cumulative total return performance over periods ending 28 February 2025
| 6 months (%) | 1 year (%) | 3 years (%) | 5 years (%) | 10 years (%) | |
|---|---|---|---|---|---|
| LTI share price | 8.4 | 18.4 | (13.1) | 8.7 | 174.1 |
| LTI NAV | 4.4 | 3.6 | 7.0 | 23.0 | 282.2 |
| MSCI World Index | 9.1 | 16.2 | 42.7 | 94.6 | 213.3 |
| Peer group median price | 6.6 | 12.1 | 19.5 | 76.7 | 204.6 |
| Peer group median NAV | 4.4 | 9.3 | 25.2 | 74.8 | 181.6 |
Peer group analysis
Figure 21: Peer group comparative data as at 11 March 2025
| Premium / (discount) (%) | Dividend yield(%) | Ongoing charge(%) | Market cap(£m) | |
|---|---|---|---|---|
| Lindsell Train | (14.7) | 6.2 | 0.80 | 166 |
| Alliance Witan | (4.9) | 2.3 | 0.62 | 4,688 |
| AVI Global Trust | (9.8) | 1.5 | 0.87 | 1,010 |
| Bankers | (8.2) | 2.4 | 0.51 | 1241 |
| Brunner | (7.7) | 1.9 | 0.63 | 554 |
| F&C | (4.3) | 1.3 | 0.49 | 5341 |
| Keystone Positive Change | (3.0) | 0.2 | 1.02 | 134 |
| Manchester & London | (19.3) | 2.2 | 0.47 | 250 |
| Martin Currie Global Portfolio | (1.9) | 1.3 | 0.64 | 201 |
| Mid Wynd | (3.0) | 1.1 | 0.60 | 329 |
| Monks | (10.2) | 0.2 | 0.44 | 2,250 |
| Scottish Mortgage | (10.5) | 0.5 | 0.35 | 11,423 |
| Sector median | (8.0) | 1.4 | 0.61 | 782 |
| LTI rank | 11/12 | 1/12 | 10/12 | 11/12 |
Up-to-date information on LTI and its peers is available on our website
LTI is a constituent of the AIC’s Global sector, which is currently made up of 12 companies (however, it looks like Keystone Positive Change will soon wind up, with shareholders voting on the proposal in March).
Reflecting the poor recent performance, LTI’s discount is one of the widest among the peer group. Its yield is far higher than the peer group, due to its unique structure and revenue income from LTL. The ongoing charges ratio is at the higher end of this peer group, reflecting its small market cap (the smallest in the peer group excluding Keystone), although we would argue that none of these charges are particularly high.
As already discussed, both LTI and LTL’s unique investment approach has hampered its recent performance, with the heritage companies that it backs being out of favour with investors over the past five years. The investment fundamentals and the cash-generative compounding nature of these companies should, in time, appeal to investors once again, especially if markets turn and there is a flight to quality. It is likely that it will take some time before this is translated into rising FUM at LTL.
Figure 22: Peer group cumulative NAV total return data as at 28 February 2025
| 6 months | 1 year | 3 years | 5 years | 10 years | |
|---|---|---|---|---|---|
| Lindsell Train | 4.4 | 3.6 | 7.0 | 23.0 | 282.2 |
| Alliance Witan | 5.8 | 7.9 | 38.7 | 81.5 | 184.0 |
| AVI Global Trust | 4.4 | 7.4 | 32.2 | 87.7 | 165.8 |
| Bankers | 5.5 | 9.5 | 25.2 | 59.1 | 158.2 |
| Brunner | 3.0 | 9.3 | 36.2 | 80.8 | 179.3 |
| F&C | 9.9 | 15.4 | 40.7 | 90.8 | 202.4 |
| Keystone Positive Change | 4.1 | (0.5) | 0.8 | – | – |
| Manchester & London | 3.0 | 14.9 | 73.3 | 68.7 | 278.8 |
| Martin Currie Global Portfolio | (1.7) | (4.3) | 12.2 | 35.1 | 133.0 |
| Mid Wynd | 0.3 | 2.8 | 11.4 | 55.0 | 176.7 |
| Monks | 10.3 | 13.9 | 24.0 | 63.7 | 208.0 |
| Scottish Mortgage | 25.6 | 25.6 | 15.4 | 97.7 | 383.0 |
| Sector median | 4.4 | 9.3 | 25.2 | 74.8 | 181.6 |
| AGT rank | 7/12 | 9/12 | 11/12 | 11/11 | 2/11 |
Dividend
As mentioned, LTI is unique among its peer group in paying a substantial dividend income to shareholders (which it tends to pay once annually, usually in August), due to its structure and the revenue income it receives from LTL. This is in large part due to income it receives from an LTL dividend, which makes up around 80% of LTI’s total revenue. Falling FUM at LTL has resulted in declining revenues to the company, as shown in Figure 23, with the dividend that LTI received from LTL in June 2024 16% below the level in 2023 and 7% lower than the December payment.
Dividend at current level at risk
LTI dipped into revenue reserves to maintain its 2024 dividend at the same level as 2023 – for the first time in its history – although this was limited to just £86,000. However, further declines in LTL dividends will impact LTI’s ability to maintain its dividend at the same level in 2025 without using more revenue reserves (which were just under £18m at 30 September 2024). It appears that LTI’s dividend at its current level is at significant risk, with LTL FUM continuing to decline. As mentioned earlier, LTL’s salary and bonus cap of approximately 26% will be compromised if FUM falls below £11bn and it seems plausible to us that the board will raise this level, further impacting the dividend that LTL pays and LTI receives.
Figure 23: LTI dividend history
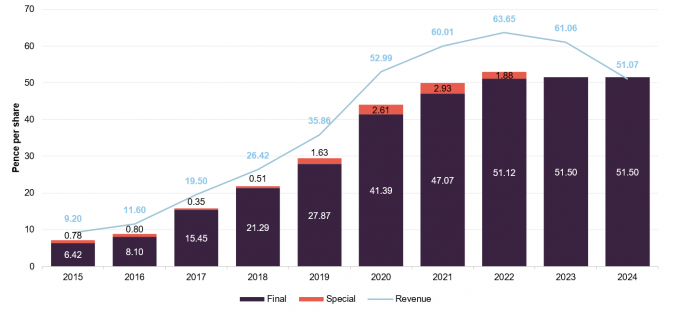
Source: Lindsell Train Investment Trust
Premium/(discount)
Figure 24: LTI discount over five years
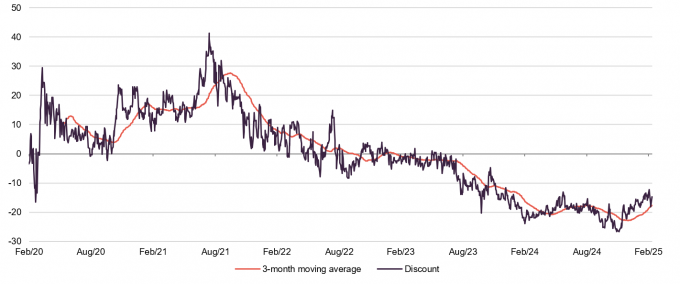
Source: Morningstar, Marten & Co
LTI’s discount has moved within a range of 13.2% to 26.7% and averaged 19.7% over the 12 months ended 28 February 2025. As of publishing, the company’s discount had narrowed to 14.7%.
As we have discussed, a range of factors have contributed to LTI’s discount (including issues impacting the entire investment trust sector, such as burdensome cost disclosure regulations and a weak UK equities sector) but the most impactful is the continued shrinking of FUM at LTL.
The board has indicated that it believes using share buybacks as an implement to reduce the discount would prove ineffective. To fund a buyback programme, the company would need to sell existing quoted investments, which would result in an increase in LTL’s percentage weighting within LTI’s portfolio and an increased expense ratio for remaining shareholders.
Fees and costs
Investment management fee of 0.6% of the lower of market cap or NAV
Under the terms of the investment management agreement, Lindsell Train Limited is entitled to receive an annual fee of 0.6%, calculated on the lower of adjusted market capitalisation or adjusted NAV. In the year to 31 March 2024, the manager was paid £976,000 (2023: £1.138m).
The manager is also entitled to receive a performance fee, which is calculated annually at a rate of 10% of the value of any positive relative performance versus the benchmark in a financial year. Relative performance is measured by taking the lower of the NAV or average market price, taking into account dividends, at the end of each financial year and comparing the percentage annual change with the total return of the benchmark. A performance fee will only be paid out if the annual change is both above the benchmark and is a positive figure. No performance fee has been paid since 2021.
For the year ended 31 March 2024, LTI’s ongoing charges ratio was 0.83% (2023: 0.87%).
Capital structure
LTI has a simple capital structure with one class of ordinary share in issue. Its ordinary shares have a premium main market listing on the London Stock Exchange and, as at 12 March 2025, there were 200,000 in issues and none held in treasury.
Gearing
LTI is permitted to borrow up to a maximum of 50% of NAV, but it does not currently use gearing to enhance returns, in part reflecting the size and risk associated with the company’s unlisted investment in LTL.
Financial calendar
The trust’s year-end is 31 March. The annual results are usually released in June (interims in December) and its AGMs are usually held in September of each year. An annual dividend is usually paid in August.
Major shareholders
Figure 25: Major shareholders as at 12 March 2025
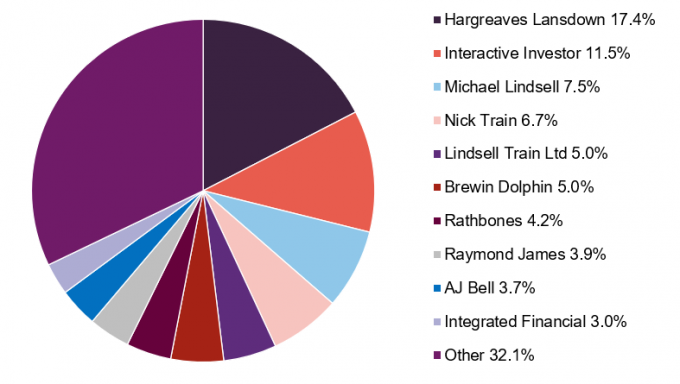
Source: Bloomberg
Management team
Wider investment team has combined 43 years’ service at LTL
LTI’s investment manager, LTL, is headed up by Michael Lindsell and Nick Train, who co-founded the business in 2000. These are both well-known and very well-regarded fund managers. The wider investment team comprises four members with a combined 43 years of service at LTL. The input and investment decision-making responsibility of the wider team has grown over a number of years, and will continue to grow as the company considers succession planning.
Biographies of the key personnel responsible for managing LTI’s portfolio are provided below.
Michael Lindsell
Michael co-founded LTL in 2000 and is the firm’s chief executive. He is the portfolio manager for Japanese equity portfolios and jointly manages global equity portfolios. Michael has over 40 years’ experience in investment management, including as chief investment officer at GT Management’s Tokyo office before heading up all of GT’s global and international funds. Following the acquisition of GT by Invesco in 1998, he was appointed head of the combined global product team. His previous experience included working at Mercury Asset Management, where he was director and head of Japanese fund management; at Scimitar Asset Management in Hong Kong where he ran Pacific and Japanese mandates; and at Lazard Brothers as an investment manager. Michael has a degree in Zoology from the University of Bristol.
Nick Train
Nick co-founded LTL and is the firm’s chairman. He is the portfolio manager for UK equity portfolios and jointly manages global equity portfolios. Nick has over 40 years’ experience in investment management, including as head of global equities at M&G Investment Management. He previously he spent 17 years at GT Management, where his final role was as chief investment officer for pan-Europe, having built long investment track records in both UK and global equities. Nick has a degree in Modern History from the University of Oxford.
James Bullock
James joined Lindsell Train in 2010 and is a portfolio manager, and has jointly managed global equity portfolios since 2015. He is also responsible for the North American Equity Fund. James has a Master’s degree in physics from the University of Oxford and a doctorate in Zoology from the University of Cambridge.
Madeline Wright
Madeline joined Lindsell Train in 2012 and was promoted to deputy portfolio manager in 2019. She has a degree in English Language and Literature from the University of Oxford and previously spent a semester as a visiting student at Yale University. After leaving Oxford, she studied in Japan for a year, where she learnt to speak the language to a high standard.
Alexander Windsor-Clive
Alexander joined Lindsell Train in 2016 and was promoted to deputy portfolio manager in 2021. Alexander has a degree in History from the University of Bristol.
Ben van Leeuwen
Ben joined Lindsell Train in 2019 and was promoted to deputy portfolio manager in 2023. He has a degree in English Language and Literature from the University of Oxford.
Board
LTI’s board is made up of six directors, all being non-executive and all but Michael Lindsell being independent of the manager.
The company’s articles of association limit the aggregate fees payable to the directors to a total of £200,000 per annum, which has a comfortable amount of headroom at the current fee levels.
Board policy is that all of LTI’s board members retire and offer themselves for re-election annually. Neither the chairman nor any other non-executive director should normally serve for more than nine years, although a director may serve for a limited time beyond that where it is in the interests of the company, shareholders or other stakeholders. Having served more than 10 years, senior independent director Vivien Gould will retire at the 2025 AGM. She had been scheduled to retire in 2024, but has stayed on to assist with succession planning and board continuity.
As is illustrated in Figure 26, all of LTI’s directors have personal investments in the trust, which we consider to be favourable as it helps align directors’ interests with those of shareholders.
Figure 26: Directors
| Director | Role | Date of appointment | Length of service (years) | Annual fee (£) | Shareholding 1 |
|---|---|---|---|---|---|
| Roger Lambert | Chair | 23/09/2022 | 2.5 | 43,000 | 50 |
| David MacLellan | Chair of the audit committee | 30/08/2023 | 1.6 | 36,000 | 75 |
| Vivien Gould | Senior independent director | 29/01/2015 | 10.2 | 29,000 | 25 |
| Nicholas Allan | Non-executive director | 18/09/2018 | 6.5 | 29,000 | 150 |
| Helena Vinnicombe | Non-executive director | 23/09/2022 | 2.5 | 29,000 | 23 |
| Michael Lindsell | Non-independent director | 13/07/2006 | 18.7 | – | 11,549 |
Roger Lambert (chair)
Roger Lambert was appointed chair of the board in January 2024. He has had a 40-year career in investment banking, mostly with JPMorgan Cazenove, where he advised companies in the consumer and financial services sectors and gained experience of corporate finance, public equity investments and public company boards. Roger was a non-executive director of Young & Co’s Brewery Plc where he was the senior independent director and chair of the audit committee. He is currently chair of trustees of the Imperial War Graves Endowment Fund, a governor and chair of the finance & estates committee of King’s Schools, Taunton, and a trustee of the Wykeham Crown & Manor Trust and the Hestercombe Gardens Trust. In addition, he is an adviser and trustee to a number of family trusts. Roger has an MA in History from Oxford University.
David MacLellan (chair of the audit committee)
David MacLellan is chair of the audit committee. He founded and chairs RJD Partners, and is currently a director of J&J Denholm Limited, Aquila European Renewables Plc and chairman of Custodian Income REIT Plc. David also chairs the audit committee at J&J Denholm and Aquila European Renewables. He was previously a director of a number of public and private companies including John Laing Infrastructure Fund, a FTSE 250 company where he was latterly chairman. David is a past council member of the British Venture Capital Association and a member of the Institute of Chartered Accountants of Scotland. He has a Bachelor of Commerce degree from the University of Edinburgh.
Vivien Gould (senior independent director)
Vivien Gould is senior independent director. She holds non-executive director positions at Baring Emerging EMEA Opportunities Plc, Schroder AsiaPacific Fund Plc, Third Point Investors Limited and National Philanthropic Trust UK. Vivien has worked in the financial services sector since 1981. She was a founder director of River & Mercantile Investment Management Limited and served as a senior executive and deputy managing director with the group. She then worked as an independent consultant and served on the boards of a number of investment management companies, listed investment trusts, other financial companies and charitable trusts.
Nicholas Allan (non-executive director)
Nicholas Allan is chair of the nomination committee. He has significant experience of investment management, being a founder of Boyer Allan Investment Management and joint fund manager of the Boyer Allan Pacific Fund Inc. Prior to that he worked in various roles in UK merchant bank Kleinwort Benson and its affiliates in London, Boston, New York, Tokyo and Hong Kong in the 1980s and 90s. This included setting up a pan-Asian securities business and running its global emerging markets securities area. Nicholas is a non-executive director of Walled City Hotels Pte Limited (India), trading as RAAS Hotels, and is also a director of several charities. He has an MA in Natural Sciences from Cambridge University.
Helena Vinnicombe (non-executive director)
Helena Vinnicombe was appointed to the board in 2022. She is a member of the advisory committee for M&G Charifund, Charibond and Charity Multi-Asset fund and is a non-executive director on the board of Lowland Investment Company plc, where she also serves as a member of the audit and remuneration committees. She also provides independent investment consulting to clients with long-term investment objectives, typically charities and family trusts. Helena was previously a director at Smith & Williamson, where she spent most of her career, focused on private client investment management. Additionally, she is a governor of Aureus Primary School, and a trustee and member of the finance & investment committee of The Child Health Research CIO. She has an MA in Modern Languages from Cambridge University.
IMPORTANT INFORMATION
This marketing communication has been prepared for Lindsell Train Investment Trust Plc by Marten & Co (which is authorised and regulated by the Financial Conduct Authority) and is non-independent research as defined under Article 36 of the Commission Delegated Regulation (EU) 2017/565 of 25 April 2016 supplementing the Markets in Financial Instruments Directive (MIFID). It is intended for use by investment professionals as defined in article 19 (5) of the Financial Services Act 2000 (Financial Promotion) Order 2005. Marten & Co is not authorised to give advice to retail clients and, if you are not a professional investor, or in any other way are prohibited or restricted from receiving this information, you should disregard it. The note does not have regard to the specific investment objectives, financial situation and needs of any specific person who may receive it.
The note has not been prepared in accordance with legal requirements designed to promote the independence of investment research and as such is considered to be a marketing communication. The analysts who prepared this note are not constrained from dealing ahead of it, but in practice, and in accordance with our internal code of good conduct, will refrain from doing so for the period from which they first obtained the information necessary to prepare the note until one month after the note’s publication. Nevertheless, they may have an interest in any of the securities mentioned within this note.
This note has been compiled from publicly available information. This note is not directed at any person in any jurisdiction where (by reason of that person’s nationality, residence or otherwise) the publication or availability of this note is prohibited.
Accuracy of Content: Whilst Marten & Co uses reasonable efforts to obtain information from sources which we believe to be reliable and to ensure that the information in this note is up to date and accurate, we make no representation or warranty that the information contained in this note is accurate, reliable or complete. The information contained in this note is provided by Marten & Co for personal use and information purposes generally. You are solely liable for any use you may make of this information. The information is inherently subject to change without notice and may become outdated. You, therefore, should verify any information obtained from this note before you use it.
No Advice: Nothing contained in this note constitutes or should be construed to constitute investment, legal, tax or other advice.
No Representation or Warranty: No representation, warranty or guarantee of any kind, express or implied is given by Marten & Co in respect of any information contained on this note.
Exclusion of Liability: To the fullest extent allowed by law, Marten & Co shall not be liable for any direct or indirect losses, damages, costs or expenses incurred or suffered by you arising out or in connection with the access to, use of or reliance on any information contained on this note. In no circumstance shall Marten & Co and its employees have any liability for consequential or special damages.
Governing Law and Jurisdiction: These terms and conditions and all matters connected with them, are governed by the laws of England and Wales and shall be subject to the exclusive jurisdiction of the English courts. If you access this note from outside the UK, you are responsible for ensuring compliance with any local laws relating to access.
No information contained in this note shall form the basis of, or be relied upon in connection with, any offer or commitment whatsoever in any jurisdiction.
Investment Performance Information: Please remember that past performance is not necessarily a guide to the future and that the value of shares and the income from them can go down as well as up. Exchange rates may also cause the value of underlying overseas investments to go down as well as up. Marten & Co may write on companies that use gearing in a number of forms that can increase volatility and, in some cases, to a complete loss of an investment.