
Montanaro European Smaller Companies
Investment companies | Annual overview | 01 August 2023
No Continental Drift
Despite the headwinds it has faced – chief among them higher interest rates – Montanaro European Smaller Companies (MTE) remains committed to investing in high-quality, high-growth companies. MTE’s manager, George Cooke, has been unflinching in his approach, making little change to MTE’s portfolio other than increasing its concentration by trimming lower-conviction holdings.
Over the long term, MTE’s track record demonstrates the opportunities that small cap investing can present, with MTE continuing to be one of the best performing European small cap strategies available to investors. Yet despite this, the trust trades on a wide discount, currently 12.7%, as MTE has been swept up in the wider style-selloff, rather than being judged on its own merits. This may represent an attractive opportunity for long term investors.
Continental European smaller companies
MTE aims to achieve capital growth by investing principally in Continental European quoted smaller companies. The benchmark index is the MSCI Europe ex UK Small Cap Index (in sterling terms).
Fund profile
More information is available from the manager’s website www.montanaro.co.uk.
Montanaro European Smaller Companies Trust (MTE) aims to achieve capital growth by investing principally in smaller, quoted, Continental European companies (those within the European Union, Norway and Switzerland) but is not restricted from investing in smaller companies quoted on other European stock exchanges. The benchmark index is the MSCI Europe ex UK Small Cap Index (in sterling terms).
The original company dates back to 1981, but Montanaro Asset Management Limited (MAML) took on the management of the trust in September 2006 and the European small-cap investment approach dates from then.
The manager
MAML was established in 1991 and is chaired and 95% owned by Charles Montanaro and family. Head of investments Mark Rogers owns 5%. However, the wider team has options over about half of the equity. The CEO is Cédric Durant des Aulnois, the lead manager on MTE is George Cooke (who is also head of fund management at MAML), and Stefan Fischerfeier acts as George’s back-up. Charles, Mark and George are all members of the investment committee, which also includes Alex Magni (see page 22 for more detail on the team).
MAML believes that it has the largest and most experienced team in Europe,
They are supported by what MAML believes is the largest and most experienced team in Europe, specialising in researching and investing in quoted small and mid-cap companies. The team is multi-lingual and multi-national. All but two of the fund managers also have research responsibilities.
Montanaro’s managers believe that the company is best served by operating with a maximum of 40 staff members, as to preserve the advantages of a boutique outfit. With 38 current staff members (17 of whom are analysts and fund managers), Montanaro is now effectively maturing as a boutique and as such will continue to devote its resources towards its current strategies, as opposed to aggressively growing the company for example.
In addition to MTE, the team manages a range of funds focused on UK and European equities, the Montanaro Better World Fund (an open-ended fund investing in small and mid-cap companies supporting the UN Sustainable Development Goals), and two global equity funds. MAML has about £4bn of assets under management.
Stormy waters, but a clear path remains
Europe has been a difficult market for investors to navigate in recent months, if not years. A combination of rising inflation, slowing growth, and an ongoing war on European soil have piled on the pressure for European investors. As is the case in the UK, Europe has been hit by significant inflation. This is thanks in large part to rising fuel and food costs, both of which are direct results of the war in Ukraine, whereby sanctions on Russia led to a near complete cut-off of Russian energy, and disruption to two of the world’s largest grain exporters – Ukraine and Russia.
The combination of high inflation and a global slowdown has weighed on Europe’s major economies.
While Europe is a region of many distinct nations (and degrees of economic development), the rise in inflation has been felt everywhere, although western Europe is perhaps worst-affected. While France and Germany have seen their rate of inflation decline in recent months, there has been a substantial hit to aggregate European economic activity, as well as impacting the market’s wider confidence in the region.
Central banks have hiked interest rates in response. The effects of this are felt most keenly by growth stocks, given their valuations reflect larger volumes of future cash flows and are thus more sensitive to any increase in the cost of capital.
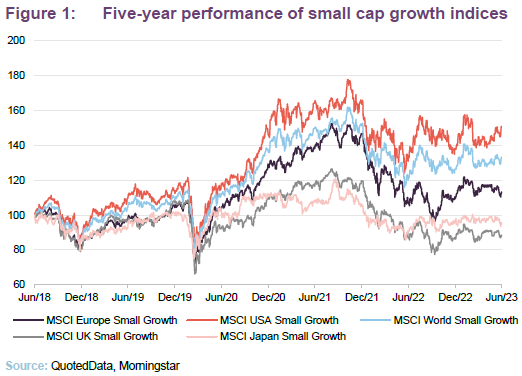
Looking at their developed market counterparts, in sterling terms, European small cap growth stocks have fared a bit better than those in the UK and Japan, but have lagged those in the US by some margin.
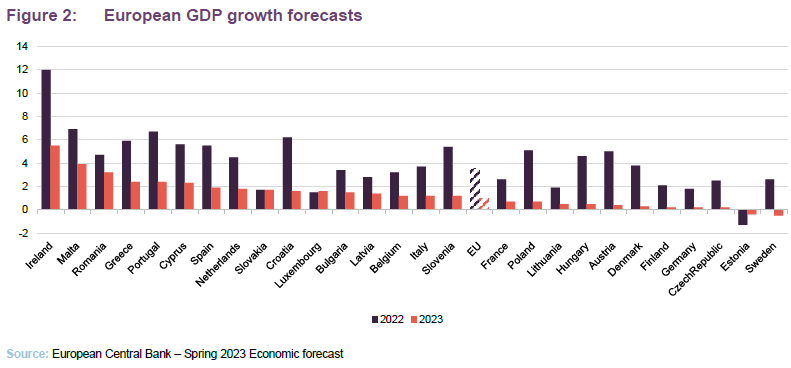
European GDP growth faces a painful 2023.
Europe has not only been hit by its domestic headaches, but it has also been impacted by a wider global economic slowdown, with Germany (by far Europe’s largest economy) being particularly hard hit by China’s economic woes given that it is a major export market for industrial goods and services.
As Figure 2 shows, German and French GDP growth are expected to be amongst the weakest in Europe. At the time of writing, Europe has in fact entered a recession, having posted a negative -0.1% quarterly GDP growth for Q1 2023, following a -0.1% fall in Q4 2022.
The weakness of Europe’s economy makes the underperformance of MTE’s style of quality-growth investing somewhat paradoxical, as historically speaking the quality and growth factor come to the fore during recessions. These types of companies should be better able to continue to generate cash, grow their revenues and capture market share from weaker players despite the wider economic slowdown.
More than the macro
Thankfully, the European equity market is more than a reflection of the economic outlook. There are numerous opportunities for managers to add value by identifying under researched gems, exploiting the ‘small cap effect’ as George coins it. With its myriad of economic regions, and idiosyncratic local markets, Europe’s professional small cap managers ought to have plenty of opportunities to set themselves apart from both index benchmarks, and each other.
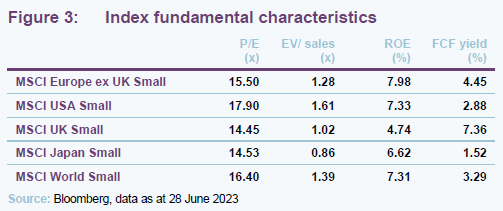
Figure 3 suggests that valuations of European small cap growth stocks are comparable with peers. However, Europe scores highly on ‘quality’ metrics such as ROE and ROIC, running second only to the UK. We show how MTE scores on some of these metrics in Figure 7 on page 11.
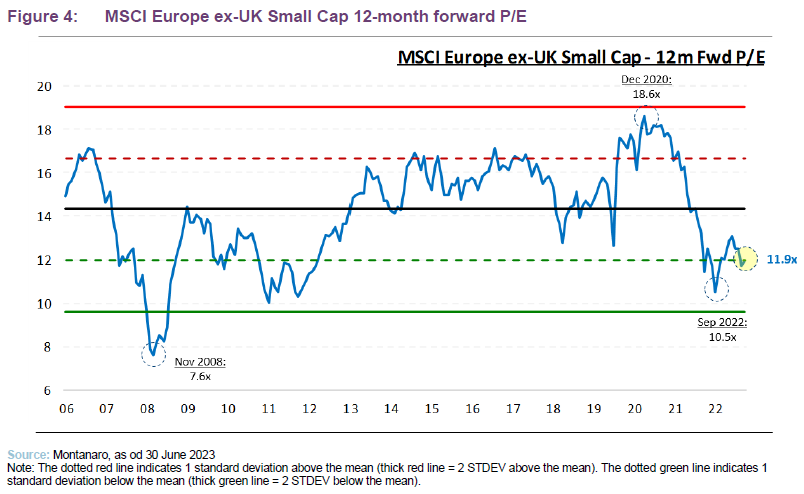
The European small-cap opportunity is not only relative to its international peers, but also when we consider the current valuations of European small caps relative to their historical levels. As can be seen in Figure 4, the MSCI Europe ex-UK Small Cap index is currently trading at a historic P/E level that we have seen only a handful of times before, 1 standard deviation below its long-term average.
Less than a year ago, the European market was trading on a decade-low P/E ratio, indicative of how unloved the sector was and, arguably, how irrational investors were in respect of the European equity market. Investors are placing as great a discount on European equities today as they were during the COVID-19 crash, and back at levels seen during the European debt crisis. Both of these were arguably greater threats to Europe’s economic outlook than today’s current inflationary pressures.
Investment approach and process
MAML avoids trying to time macroeconomic shifts, preferring to focus on the long term.
Simple, niche, market leaders with high and sustainable returns, profitable and with good management.
It wants to invest in:
- simple businesses that it can understand;
- niche businesses in growth markets (non-cyclical companies, growing organically rather than businesses that tend to focus on acquisitions);
- market leaders (strong, defensible market positions and pricing power);
- companies with high operating margins and high returns on capital (barriers to entry/a sustainable competitive advantage);
- profitable companies trading at sensible valuations; and
- good management that it trusts (aligned to shareholders and demonstrating sound ESG practices).
This could be summed up as investing in high-quality businesses at sensible prices. Furthermore, MAML believes it is important to:
- do the work yourself (rather than relying on brokers);
- be passionate; and
- learn from mistakes (humility goes a long way)
Easier to add value through stock selection for a small-cap portfolio.
In addition, MAML believes that it is easier to add value through stock selection for a small-cap portfolio, especially given the relative paucity of research available on these companies. MAML observes that some large companies are covered by 50 or more brokers, while many European smaller companies have little or no coverage. Firm evidence for the success of this approach is provided in
Figure 21 on page 17.
Sifting through the universe
Deep pool of stocks to choose from.
The constituents for MTE’s portfolio are drawn from a universe of about 4,000 companies listed in Europe. The focus is on those with a market cap between €100m and €5bn (about 2,300) and, as described below, unprofitable companies are excluded which reduces the pool to about 1,700 stocks. The benchmark index currently includes stocks with market caps of up to about €7bn.
MAML has always generated its own investment ideas rather than relying on external analysts.
MTE is a true stock-picking portfolio; index-weightings play no part in forming its portfolio construction. MAML has always generated its own investment ideas rather than relying on external analysts. There are many good reasons for this, but it is also fortunate as the availability and quality of external analysis – which MAML believes has been on a declining trend for some time – was exacerbated by MiFID II. This gives MAML a competitive edge, which is sharpened by the strength and depth of its research team.
The depth and experience of MAML’s team gives the firm a competitive edge.
MAML is an entrepreneurial boutique with a flat structure that allows for quick decision-making and avoids the politics that bog down more bureaucratic large asset managers. MAML does not encourage the development of ‘star’ fund managers, but is focused on staff retention, including the granting of staff options over MAML equity. MAML’s ‘back office’ functions are carried out in-house rather than being outsourced (as they are in many smaller investment management boutiques).
Research responsibilities are distributed amongst the team on a sector, global basis. Emphasis is placed on being well-prepared for meetings, which is possible as the research team is well-resourced. MAML’s analysts can then set the agenda, challenge management and get the information that they need. Site visits are encouraged (another perk of having a large team is that it is not desk-bound).
On average, each analyst will seek to identify 20 stocks within their sector coverage worthy of closer scrutiny. These will form the pool from which portfolio constituents are drawn. The first part of the process is to eliminate poor-quality companies. These stocks are identified by applying a quantitative screen to the wider universe. Loss-making companies, those with poor cash flow and highly indebted businesses are rejected. Stocks that fit structural growth themes that the team has identified may be prioritised. Each company within the universe is assigned a quality rating.
All stock ideas are reviewed and approved by an investment committee.
The analysts then build a financial model and conduct a proprietary checklist for each stock. They also check whether a stock meets MAML’s ESG criteria (see below). Then the idea is put before MAML’s investment committee, who challenge assumptions and ask for more information if they feel this is warranted. Stocks that pass these quality thresholds may then go on to an approved list of approximately 270 companies. No fund manager can buy a company that is not on the approved list.
Value is assessed on a range of measures but only after the quality evaluation is complete.
Various valuation tools are considered (primarily discounted cash flows) but include P/E, free cash flow yield, dividend yield and relative to peers and the team operates with a time horizon of five to 10 years. The ideal investment should provide a margin of safety in excess of 25% over its intrinsic value. Analysts will also look at risk factors. Analysts will then assign a recommendation to each stock. These will be presented to the whole team at weekly meetings and the fund managers will then decide which stocks make it into portfolios. Once a stock makes it into a portfolio, it will usually remain there for many years.
Portfolio construction
MTE’s investment policy is more fully described in its annual report. It only invests in listed securities and MAML says that unquoted companies are not eligible for consideration.
Some other rules apply:
- MTE does not hedge its currency exposure;
- MAML will hold no more than 10% of the voting rights in any company (across all funds managed by MAML); and
- no more than 10%, in aggregate, of the value of its total assets at the time of investment will be invested in other investment trusts or investment companies admitted to the Official List of the UK Listing Authority. Currently, MTE has no holdings in other investment trusts, nor does it expect to ever do so.
Position sizes determined by strength of conviction.
Typically, the target weighting for a position will be between 1% and 3.5%, depending on both the strength of conviction that the manager has in the stock, and its liquidity. The total number of holdings is typically around 50. There is no obligation to sell a company if its market cap exceeds €5bn, but these will be gradually recycled into lower market cap companies. The manager will ensure that a single position does not exceed 7.5% of the portfolio.
George does however have a tendency to let his winners run, which can see their position sizes increase rapidly. This can mean that in periods of particularly strong tailwinds, MTE can demonstrate a strong exposure to the momentum factor, as well as rapidly shifting asset allocation biases. Though this is only done in the context of George being confident in the investment case of his companies, rather than intentionally trading around momentum. We note that this ability to hold onto winners does explain part of MTE’s high beta, which is currently at 1.1 over a five-year period, based on monthly data.
ESG analysis
ESG principles are at the heart of MAML’s stock selection decisions.
MAML’s focus on quality is supported by its commitment to ESG principles, which have been ingrained within its investment approach for many years. It believes that there is a clear correlation between how well a business fares on ESG grounds and the value it creates for its shareholders.
Ed Heaven chairs an internal sustainability committee of seven, which meets quarterly and oversees MAML’s efforts in this area. The team includes two dedicated ESG and impact specialists, Kate Hewitt and Harriet Evans. MAML also has its own ESG handbook, policies and checklists. It votes the shares it controls, and it engages with companies. MAML expects the companies that it invests in to improve their ESG awareness and it monitors their progress.
Some sectors are excluded from portfolios on ESG or ethical grounds. MAML portfolios will not contain tobacco companies; companies manufacturing weapons, facilitating gambling or manufacturing alcohol; companies engaged in oil-, coal- and gas-related E&P; companies involved with pornography; companies making high interest-rate loans; or companies engaged in animal testing unless it is required by law. Corporate governance checks include an assessment of a company’s remuneration policy.
MAML’s attention to ESG issues extends to its own business. Following an extensive evaluation process, it was made a Certified B Corporation in June 2019 (more information is available at bcorporation.net). Early in 2021, MAML joined the Net zero asset managers initiative (more information at netzeroassetmanagers.org), supporting the goal of net zero greenhouse gas emissions by 2050 or sooner. MAML is a member of the GFANZ taskforce (see gfanzero.com) and sits on the real economy transition workstream group.
MAML has won several ESG & Impact awards and has most recently been awarded the “Best Small & MidCap Sustainable Investment Boutique” award by Ethical Finance.
Sell discipline
Stocks exit the portfolio for a variety of reasons – for example, when they become significantly overvalued, if they become too big, or due to takeovers.
Furthermore, stocks may leave the portfolio if the analysts identify unfavourable changes in the fundamentals of the business or an unfavourable management change.
Stocks will also be sold if they no longer pass MAML’s quality threshold, or if a new opportunity comes along that offers better prospects.
Asset allocation
There were 49 holdings in the portfolio at the end of June 2023, down from 58 at the time of our previous note (which had data as of May 2022). Last time, the figure was elevated as the market turmoil threw up a number of attractive opportunities. George has since been focusing on his highest conviction ideas.
MTE’s portfolio has become more concentrated.
Gearing remains low, at 2.6%, about the same as it was when we last published. The level of gearing reflects the stock-specific opportunities available to the team, rather than the prevailing macroeconomic environment.
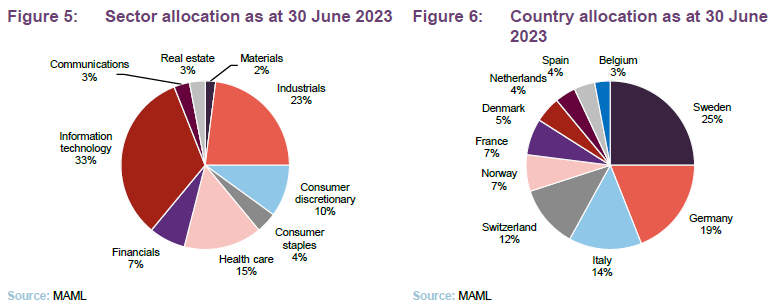
Geographic and sector allocations are determined by stock selection, but MTE has had a long-term overweight exposure to healthcare and technology companies relative to its benchmark. There has been relatively little change in both the sector and regional allocations of MTE between this note and our most recently published. We note that an overweight to healthcare and technology is a common by-product of the quality-growth style, given the innovation which occurs in these sectors, and the often-non-cyclical nature of their cash flows. Conversely, MTE retains its underweight to financials, energy, and materials, all of which are more cyclical and typically lower-quality industries.
As discussed on page 15, this stance has had an impact on MTE’s relative performance, given the recent tailwinds behind these specific industries (be it rising energy costs or higher interest rates charged on loans).
Portfolio characteristics
As can be seen in Figure 7, MTE continues to demonstrate the same high quality, high growth characteristics that it has in prior years (as discussed in our previous note). However, valuation multiples are much lower, and the slowing economic growth has reduced the aggregate earnings-per-share (EPS) growth and dividend growth. Though it in the case of dividend growth it is also due to the sampling period, reflecting the dividend cuts made during COVID-19 and the figure should hopefully normalise next year.
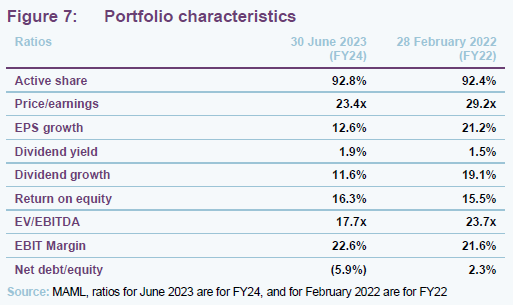
One ratio that is worth emphasising is the net debt/equity figure. This was low last time, but now on average MTE’s portfolio companies have net cash. This could be an important factor when it comes to navigating this period of elevated (or perhaps more accurately in a longer-term context, normal) interest rates.
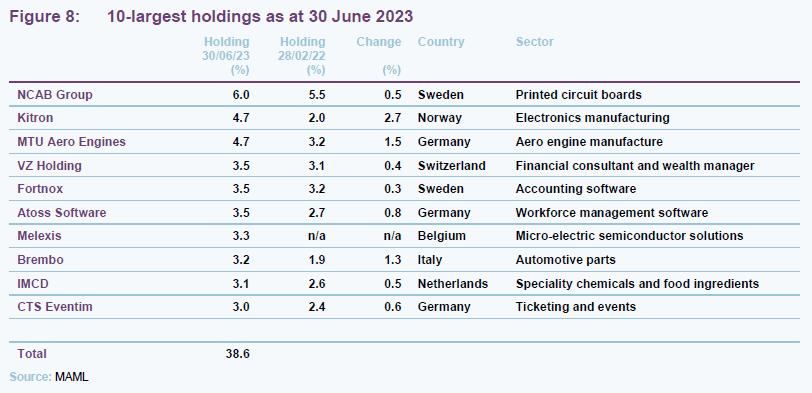
10-largest holdings
George usually remains sanguine in the face of steep drawdowns.
Despite the clear headwinds facing Europe, George has made few changes to his holdings since our last note, bar selling out of companies to reduce the number of portfolio holdings. George comments that it is usually a mistake to be caught up in panic sell offs, whereby the average investor overestimates the actual damage that crises will do to a high-quality business. While this was evidenced by the lack of outright-sales of core holdings during COVID-19, George also points to the European debt crises as a good example of how selling out of quality-growth during panicky markets can be a disastrous mistake. Even though the style suffered immediately after the ECB announced their intention to intervene in bond markets, the quality-growth style went on to substantially outperform the wider small cap sector in following years.
Kitron
Kitron (kitron.com) is a Norwegian electronics manufacturing services business, with operations across Europe, the US, and China. Kitron provides a manufacturing outsourcing solution focusing on electronics, offering its clients cost efficient and more effective manufacturing options than they themselves are capable of.
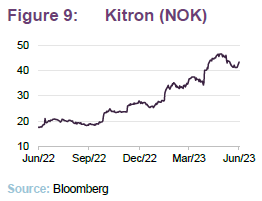
Kitron saw substantial orderbook expansion during COVID-19, as the demand for electronics skyrocketed thanks to the global lockdown. However, delivery on this was restricted by the supply chain bottlenecks which affected virtually all industries. As these bottlenecks have eased, Kitron’s revenue and profit figures have picked up. Q1 2023 revenue was up 32% year-on-year and EBIT rose by 119% on the same basis. Nevertheless, the order book continues to build as demand from the defence sector augments already strong positive trends in energy efficiency, energy grids and EV charging. This has driven an impressive share price uplift. The MTE team have been adding to Kitron continually over the past year, frontrunning the rise in its share price.
Brembo
Brembo (brembo.com) is an Italian manufacturer of automotive brakes, with its brakes being considered as some of the best in the world.
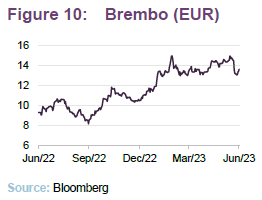
Brembo is perhaps a quintessential example of a high-quality company, a market leading business which need only maintain the standards of its products and expand its production and distribution in a sensible manner. In that regard, Brembo is focusing on expanding its production capacity in three key countries: Mexico, China, and Poland. In doing so it ensures it can meet demand in the world’s major economic centres.
Brembo recently changed guidance for its revenue growth, and now expects 10% growth over 2023, almost double its previous level. With Q1 revenues beating analysts’ estimates, its share price has performed well. We note that Brembo is trading on a 14.6 times p/e ratio (well below the 22.9 times of the MSCI Europe Small cap growth index) despite the rise in its share price.
CTS Eventim
CTS Eventim (Eventim.com) is a leading ticketing and live entertainment provider based in Germany. As we mentioned earlier in this note, CTS Eventim suffered greatly during the COVID-19 lockdown, with the suspension of in-person gatherings effectively freezing all sales. CTS Eventim’s post-COVID rebound has been profound however, with 2022 being a year of record sales. CTS Eventim was the world’s third-largest distributor of tickets over the year.
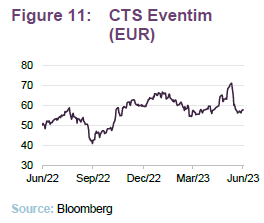
2023 has followed a similar pattern, with CTS Eventim’s Q1 2023 revenues being twice that of Q1 2022. The company has fully recovered from the effects of COVID-19 now, with all of its major metrics having normalised and its share price having returned to its pre-pandemic level, meaning it continues to touch it all-time highs.
Melexis
Melexis (melexis.com) is a Belgium-based supplier of micro-electric semiconductor solutions, designing and producing semiconductors for a range of different end users.
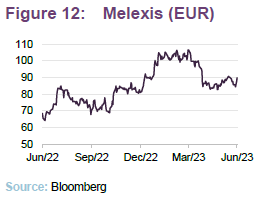
Melexis is a clear beneficiary of the proliferation of semi-conductor usage, especially within the automotive sector given the startling quantity of semiconductors used in electric vehicles. These tailwinds can be seen in its Q1 2023 earnings, which were up 25% year-on-year.
Melexis’s growth has begun to slow however, with possible over-production in the semiconductor sector and easing global growth impacting sales. None-the-less Melexis still expects full year sales growth of 11–16%, and a gross profit margin of 45%, both of which would be considered high when compared to non ‘quality growth’ companies.
Just outside the top 10 – it featured in the list during May – is Brunello Cucinelli.
Brunello Cucinelli
Brunello Cucinelli (brunellocucinelli.com) is a high-end Italian luxury goods designer, named after its founder who still leads the company, as well as owning the majority stake in it. While it designs a range of clothing for men and women, it is arguably best known for its cashmere and wool products.
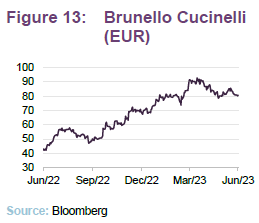
The company has over 100 stores worldwide, with a presence in Europe, North America, and East Asia. It is its East Asia business that the MTE team are particularly excited by, as it means that Brunello Cucinelli is primed to capitalise on the reopening of China’s economy, and the subsequent surge in consumer spending. The company’s sales rose by one third in Q1 2023 alone. The team topped up their holding in Brunello Cucinelli at the start of 2021, which was a well-timed trade as its shares have more than doubled since then.
Brunello Cucinelli is also an example of MTE ‘letting its winners run’ as its shares have surged over 2023, so much so that it may soon be considered for inclusion in Italy’s FTSE MIB index, its large cap index.
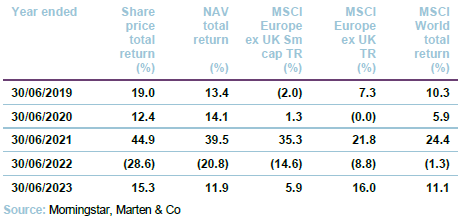
Performance
MTE’s performance, over all the time periods we sample, demonstrates the benefits of not only quality-growth investing, but also provides evidence to the alpha potential that can be found in the European small cap space. Despite the obvious headwinds that growth stocks have faced (even high-quality ones), as we described on
page 3, MTE has kept its head well above water, having generated positive NAV returns over all sampled periods. In fact, its NAV returns have been so great that MTE has generated a 5-year return of almost three times that of its benchmark, the MSCI European Smaller Companies Index ex-UK. MTE’s outperformance has also been fairly consistent, as its 12-month performance has been higher than its benchmark’s 71% of the time (sampled daily).
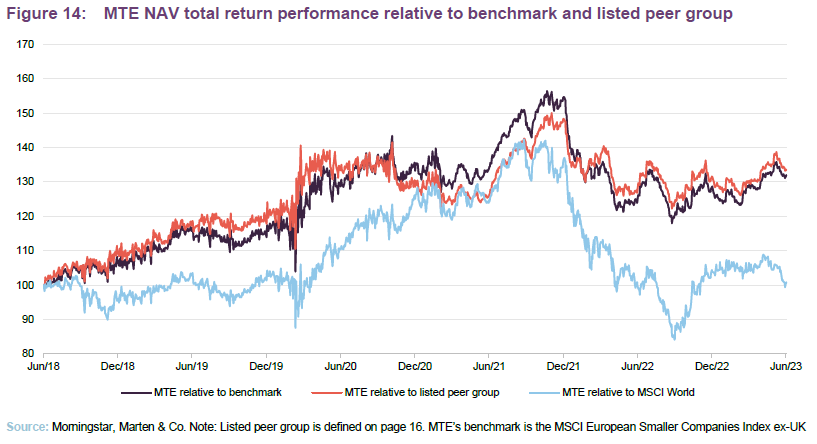
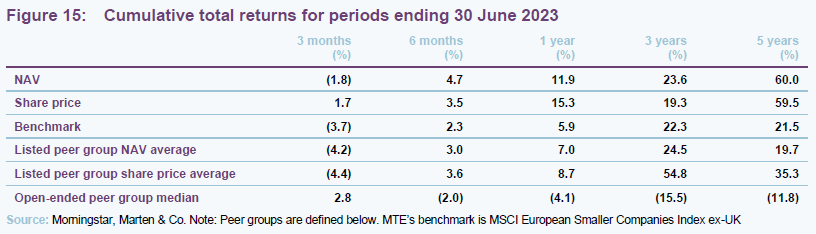
MTE remains the best performing European small cap trust over the long term.
What is arguably most impressive is the fact that MTE’s returns are objectively high, not simply high for a European strategy. MTE has achieved something which most European investors would have found a monumental task, having performance that is comparable to the MSCI World over the longer term. This is impressive because US equity markets have barnstormed ahead of virtually all other asset classes, with US large cap equities being particularly strong. The parabolic rise of the US technology sector is well documented and has been the largest driver behind the rise in global equity markets. Thus, MTE’s ability to keep up with the MSCI World despite being have zero direct exposure to its primary drivers is particularly noteworthy.
Attribution
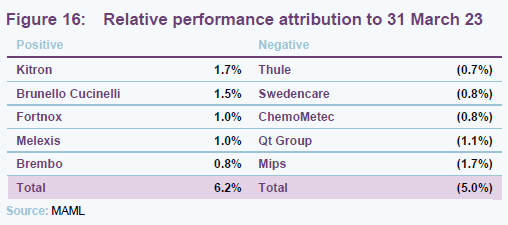
There were a number of standout performers as well as key detractors over the 12 months to 31 March 2023. The top and bottom five performers are listed in
Figure 16, and more information about some of them is detailed in the following pages. We note that Kitron, Brunello Cucinelli, Melexis, and Brembo are described earlier on page 12.
Fortnox
Fortnox (fortnox.se – in Swedish) is Sweden’s leading provider of internet-based applications for accounting, invoicing, and payroll administration. Fortnox is the dominant player in the Swedish market, with c.0.5m customers. The upside for Fortnox could come from it becoming the first choice for Swedish business as they increasingly digitise their financial operations (an example of a secular growth trend). Fortnox’s target customer base is 1.5m, so there remains a strong runway for growth with the company’s profitability scaling directly with the number of clients it has.
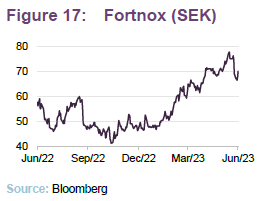
Another benefit of its dominance is the ability to expand its margins by selling additional services to its current clients. In its recent quarterly earnings update, it reported operating margins of 38%, as well as profits which exceeded analyst estimates.
Mips
Mips (mipsprotection.com) is a Swedish firm which designs safety systems of helmets. Rather than produce the helmets themselves, Mips designs a proprietary safety device which can be incorporated into helmets produced by other firms.
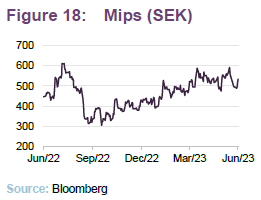
Having been a huge beneficiary of the change in lifestyle habits during COVID-19, Mips share price tumbled as demand for bike helmets faded subsequently. Mips reported 46% drop in net sales (thanks to a 50% drop in bike helmet sales) in the fourth quarter of 2022. Nevertheless, the share price appears to be recovering.
Qt Group
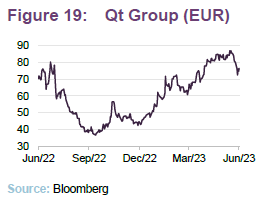
Qt Group (qt.io) is a Finnish software firm that develops mobile and desktop applications for other companies, offering companies a range of solutions, from user interface design to quality management, with the company having recently signed a deal with General Motors to provide software development tools to aid in their vehicle design. Qt group was a clear victim of the growth-stock rotation, being a quintessential high-growth tech company, having traded on a P/E of over 100 in 2020 and 2021, it was swept up in the wider sector selloff. The team sold out of their position in Qt Group some time ago however, and its presence within the top detractors is a hangover from previous exposure.
ChemoMetec
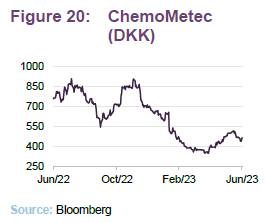
ChemoMetec (ChemoMetec.com) is a Danish manufacturer of automated cell counters and analysis equipment. Having reported 50% revenue growth in its last financial year, ChemoMetec reported slower than expected revenue growth for the second half of 2022 and a 6% drop in revenue in its recent quarterly update. This fall in revenue came as a result of subdued demand from ChemoMetec’s target clients, though it did report positive growth in the US.
The share price fall was initially triggered by the resignation of the CEO on 14 December 2022.
Information ratio
MTE has been able to generate a largely positive information ratio over the last five years. This is a common measurement of manager skill, based on rolling one-year monthly NAV performance, relative to its index the MSCI Europe ex UK Small Cap Index. The only period in which MTE failed to generate positive NAV performance was during the first half of 2022, when virtually every growth stock underperformed their respective indices.
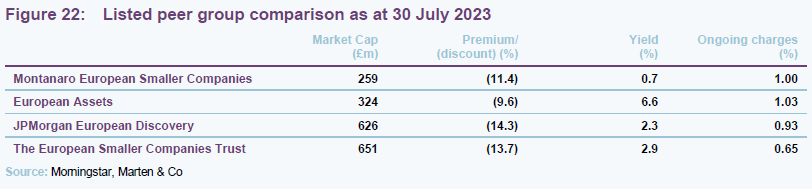
Peer group
Up-to-date information on MTE and its listed peer group is available on the QuotedData website.
For the purposes of this note, we have compared MTE with the other trusts in the AIC’s European smaller companies sector. Although a respectable size, MTE is the smallest of these, despite its superior track record. MTE still has a low yield, reflecting the focus on growth companies. None of the trusts have a high natural yield though, with European Assets paying its dividend from its NAV. MTE’s ongoing charges ratio is in line with funds of an equivalent size. Even after the recent share price fall, MTE trades on the narrowest discount, which is most likely a reflection of its superior performance record.
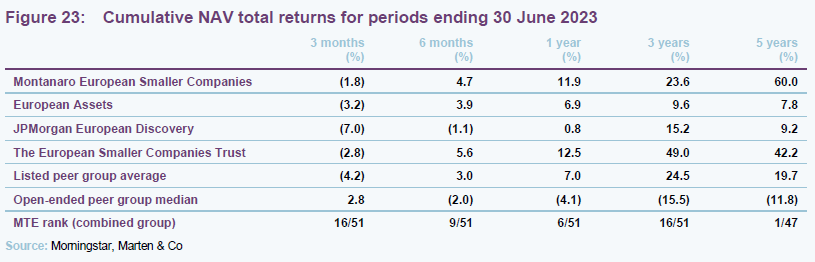
In Figure 23 below, we have also included data from MTE’s open-ended peers – a group of 51 funds available for sale in the UK and European Union. MTE beats the peer group averages over a five-year time period and, if we combine both peer groups, MTE is the best-performing fund over five years as well. What is equally, if not more, impressive is the fact that MTE’s performance ranks in the top third in all sampled periods, despite the obvious headwinds MTE’s style has faced.
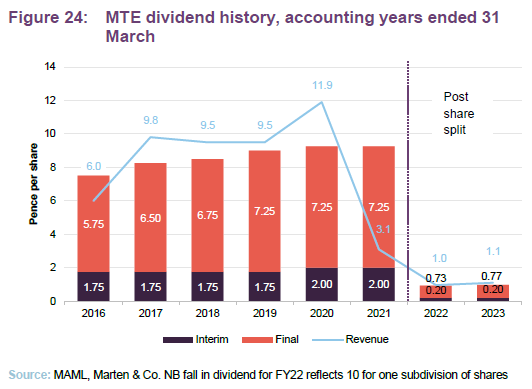
Dividend
MTE’s primary aim is to deliver capital growth to its shareholders, and its dividend is thus a by-product of its investment process, with MTE having a modest yield of 0.7% as at 03 July 2023. MTE does however have a substantial revenue reserve, enough to cover its dividend 1.9 times, thanks to the growth in dividends paid by its invested companies. MTE’s most recent divided was fully covered by its revenues also. The reserve stood at £3.9m at the end of September 2022 (September 2021 £3.4m), equivalent to 2.0p per share.
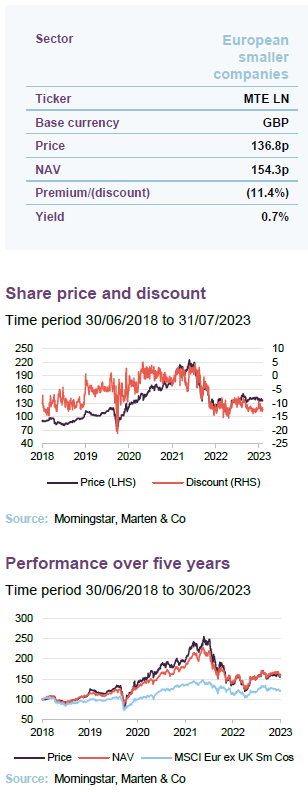
Premium/(Discount)
MTE’s discount has been caught up in the growth-stock selloff.
Over the 12 months to the end of June 2023, MTE’s shares traded within a range of a 15.5% to a 7.7% discount and an average discount of 11.2%. At 30 July 2023, the shares were trading at a discount of 11.4%.
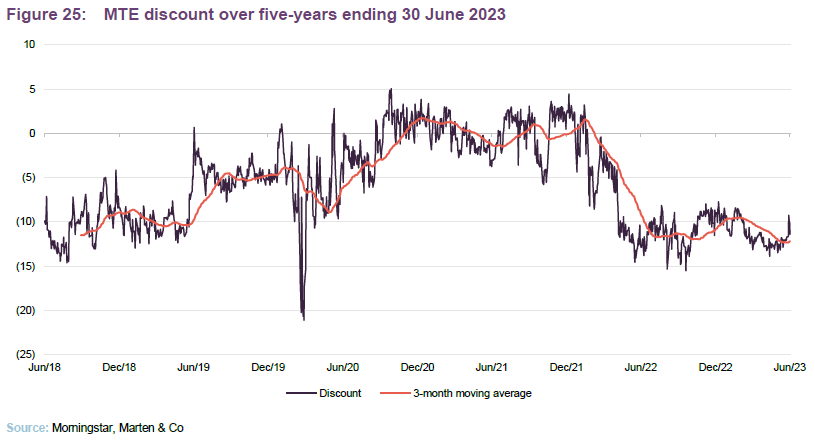
We note that few European investment trusts have managed to trade on a premium in the last few years. However, MTE did trade at a sustained premium through 2020 and 2021, reflecting the strength of the trust’s returns during this period. That reversed during the growth-stock selloff of 2022, and especially over the first quarter of 2022. As interest rates began to climb and the Ukraine war hit sentiment, MTE’s discount widened.
MTE has powers to issue and buyback shares, which it renews regularly at the AGM. Shares repurchased can be held in treasury and may be reissued. The board has said that these would only be reissued at a higher absolute price than the weighted average purchase price of the shares in treasury, and at a premium to NAV at the time of reissue or at a discount, provided this discount was lower than the weighted average discount at the time the shares were repurchased.
The net effect of this should be that purchasing the shares and reissuing them again is profitable for ongoing shareholders.
The board has stated that it will consider a buyback of shares where the discount of the share price to the NAV per share is greater than 10% for a sustained period and is significantly wider than the average for similar trusts. The board will take into consideration the effect of the buyback on the liquidity of the company’s shares. The board have yet to buy back shares since MTE began to trade on a discount.
In addition, the board encourages the manager to market the company to new investors.
Fees and costs
MAML is the company’s investment manager and AIFM. It is entitled to receive a management fee of 0.9% of the first £500m of MTE’s market capitalisation and 0.75% of the balance up to £750m and then 0.65% on any amount above £750m, payable monthly in arrears. Charging the fee on market capitalisation incentivises the manager to keep the company’s discount narrow. The tiered structure of the fee (introduced with effect from 1 April 2021) will help to lower the trust’s ongoing charges ratio, in time.
MAML is also entitled to a fee of £50,000 a year for acting as the AIFM. There is no performance fee. The management contract can be terminated by either side on six months’ notice. MTE charges 35% of the management fee against revenue and the balance against capital. The same methodology is applied to the accounting treatment for interest on MTE’s borrowings.
From 1 July 2023 Juniper Partners Limited was appointed as company secretary and administrator, replacing the previous secretary, Link Company Matters Limited, and the previous administrator, Link Alternative Fund Administrators. Equiniti Limited acts as Registrar and The Bank of New York Mellon (International) Limited as the company’s Depositary and Custodian. The company’s auditor is Ernst & Young.
The company’s ongoing charges ratio for the year ended 31 March 2023 was 1.0%.
Capital structure and life
MTE has 189,427,600 ordinary shares in issue and no other classes of share capital. No shares are held in treasury. The company has an unlimited life.
Following shareholder approval, MTE split its shares on 14 September 2021 such that shareholders received 10 new ordinary shares in exchange for each existing ordinary share that they held.
MTE’s accounting year end is 31 March. Annual accounts are published around the end of June/beginning of July and the AGM is usually held in August or September.
Gearing
The board has set a maximum limit on borrowing, net of cash, of 30% of shareholders’ funds at the time of borrowing. The board, in discussion with the manager, regularly reviews the company’s gearing strategy and approves the arrangement of any gearing facility. The board believes that the ability to use gearing offers a strong competitive advantage over alternative open-ended investment funds. Therefore, it strongly encourages the active use of gearing by the manager.
MTE has a €10m secured loan maturing on 13 September 2023 that carries a fixed rate of interest of 1.33%, and a €15m revolving credit facility until 13 September 2023, both provided by ING Bank NV. Drawdowns from the revolving credit facility are charged at a margin over the relevant EURIBOR rate.
At the end of June 2023, MTE had net gearing of 2.6%.
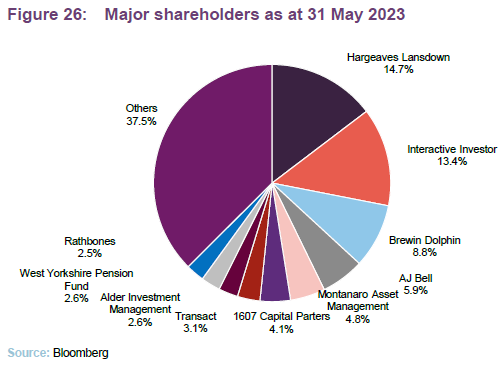
Major shareholders
Management team
George Cooke
George joined MAML in July 2010. He graduated from the University of Nottingham in 2005 with an undergraduate degree in Management Studies. He spent a further year of study there, at the end of which he was awarded a Masters (with Distinction) in Corporate Strategy & Governance. Immediately following this, he joined the graduate scheme at Aon Benfield (formerly Aon Re). Having completed this scheme, George settled as an analyst within the ReSolutions department, where he specialised in assisting with the capital and runoff issues of insurance and reinsurance companies. During his time at the company, George received a Diploma in Insurance. He is also a CFA Charterholder.
Stefan Fischerfeier
Stefan joined MAML in 2007. He holds a B.A. in Business Administration from the University of Cooperative Education in Mannheim (1995) as well as a Diplom-Kaufmann (MBA equivalent) from the University of Mainz (1998). He graduated from the London Business School with an MSc in Finance (2006). After graduating from University of Mainz, Stefan spent more than six years at Accenture in Germany, Switzerland, France, and the UK as a management consultant for European banks and asset managers. He then worked as an analyst at Nordwind Capital, a Munich based private equity company, analysing the automotive industry, and as an investment consultant for a property fund in Romania assessing real estate investment opportunities in Eastern Europe.
Board
The board consists of three directors, all of whom are independent of the manager and who do not sit together on other boards. Each director offers himself or herself up for re-election at each AGM.
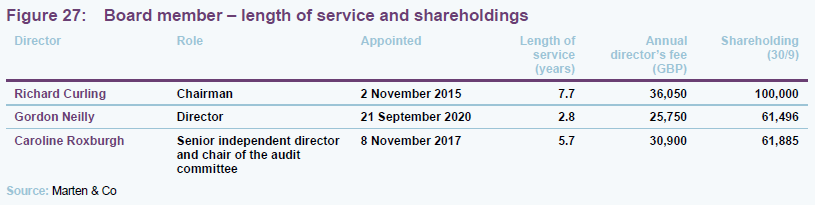
Richard Curling
Richard was appointed to the board in 2015 and became chairman in 2018. He has over 30 years’ experience as a fund manager and is currently an investment director at Jupiter Fund Management Plc. He also has extensive experience of investment trusts. Richard is also chairman of the nominations committee.
Gordon Neilly
Gordon was, until the end of August 2020, chief of staff at Standard Life Aberdeen, prior to which he was global head of strategy at Aberdeen Standard Investments and was responsible for developing the group’s strategy and overseeing its implementation as well as overseeing all corporate activity for the Group and its closed end fund business. He joined Aberdeen in 2016 from Cantor Fitzgerald, where he held the position of joint CEO. Gordon is currently a non-executive director of Personal Assets Trust Plc.
Caroline Roxburgh
Caroline is a Chartered Accountant with over 30 years’ experience in finance and audit across a number of industries and sectors, and was formerly a partner at PricewaterhouseCoopers LLP until her retirement in 2016. She chairs the audit committee and is the senior independent director. Caroline also holds a number of other board positions, including a non-executive directorship of the Edinburgh Worldwide Investment Trust Plc.
Previous notes
Readers interested in further information about MTE may wish to read our other notes. Click the links in the table or visit the QuotedData website.
Figure 28: QuotedData’s other notes on MTE
| Note | Date published | Note type |
| Quality businesses at sensible prices | March 2019 | Initiation |
| Focus on the small picture | September 2019 | Update |
| Impressive returns in difficult market | October 2020 | Annual overview |
| Unfazed by market turmoil | March 2022 | Annual overview |
Source: Marten & Co
Legal
This marketing communication has been prepared for Montanaro European Smaller Companies Investment Trust Plc by Marten & Co (which is authorised and regulated by the Financial Conduct Authority) and is non-independent research as defined under Article 36 of the Commission Delegated Regulation (EU) 2017/565 of 25 April 2016 supplementing the Markets in Financial Instruments Directive (MIFID). It is intended for use by investment professionals as defined in article 19 (5) of the Financial Services Act 2000 (Financial Promotion) Order 2005. Marten & Co is not authorised to give advice to retail clients and, if you are not a professional investor, or in any other way are prohibited or restricted from receiving this information, you should disregard it. The note does not have regard to the specific investment objectives, financial situation and needs of any specific person who may receive it.
The note has not been prepared in accordance with legal requirements designed to promote the independence of investment research and as such is considered to be a marketing communication. The analysts who prepared this note are not constrained from dealing ahead of it, but in practice, and in accordance with our internal code of good conduct, will refrain from doing so for the period from which they first obtained the information necessary to prepare the note until one month after the note’s publication. Nevertheless, they may have an interest in any of the securities mentioned within this not.
This note has been compiled from publicly available information. This note is not directed at any person in any jurisdiction where (by reason of that person’s nationality, residence or otherwise) the publication or availability of this note is prohibited.
Accuracy of Content: Whilst Marten & Co uses reasonable efforts to obtain information from sources which we believe to be reliable and to ensure that the information in this note is up to date and accurate, we make no representation or warranty that the information contained in this note is accurate, reliable or complete. The information contained in this note is provided by Marten & Co for personal use and information purposes generally. You are solely liable for any use you may make of this information. The information is inherently subject to change without notice and may become outdated. You, therefore, should verify any information obtained from this note before you use it.
No Advice: Nothing contained in this note constitutes or should be construed to constitute investment, legal, tax or other advice.
No Representation or Warranty: No representation, warranty or guarantee of any kind, express or implied is given by Marten & Co in respect of any information contained on this note.
Exclusion of Liability: To the fullest extent allowed by law, Marten & Co shall not be liable for any direct or indirect losses, damages, costs or expenses incurred or suffered by you arising out or in connection with the access to, use of or reliance on any information contained on this note. In no circumstance shall Marten & Co and its employees have any liability for consequential or special damages.
Governing Law and Jurisdiction: These terms and conditions and all matters connected with them, are governed by the laws of England and Wales and shall be subject to the exclusive jurisdiction of the English courts. If you access this note from outside the UK, you are responsible for ensuring compliance with any local laws relating to access.
No information contained in this note shall form the basis of, or be relied upon in connection with, any offer or commitment whatsoever in any jurisdiction.
Investment Performance Information: Please remember that past performance is not necessarily a guide to the future and that the value of shares and the income from them can go down as well as up. Exchange rates may also cause the value of underlying overseas investments to go down as well as up. Marten & Co may write on companies that use gearing in a number of forms that can increase volatility and, in some cases, to a complete loss of an investment.