
Ready for a growth revival
Montanaro European Smaller Companies (MTE) is an unapologetically growth-focused European smaller companies fund. As such, it has faced significant headwinds in recent years, with value investing much more in favour in Europe and elsewhere. Earlier this year, performance was affected by a sell-off in software companies as investors considered the potential impact of agentic artificial intelligence. More recently, however, MTE’s performance has recovered – for reasons covered in this note – and the manager remains optimistic about the outlook.
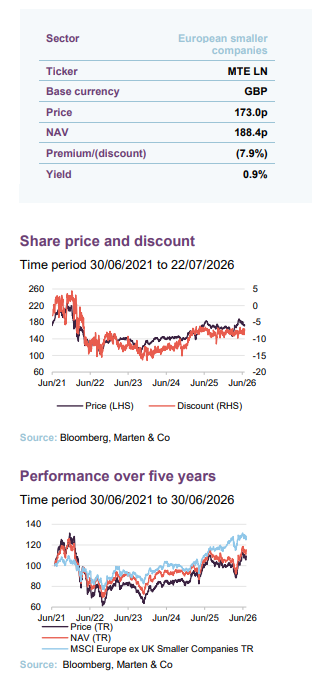
The steps announced by the board last year have had early success in enhancing shareholder value. The second 5% tender offer has just completed, and the trust’s discount has consistently traded in single figures for more than a year, in line with the discount policy.
Continental European smaller companies
MTE aims to achieve capital growth by investing principally in Continental European quoted smaller companies. The benchmark index is the MSCI Europe ex UK Small Cap Index (in sterling terms).
| Year ended | Share price total return(%) | NAV total return(%) | MSCI Europe ex UK small cap TR. (%) | MSCI Europe ex UK TR(%) |
|---|---|---|---|---|
| 30/06/22 | (29.9) | (22.0) | (16.5) | (9.8) |
| 30/06/23 | 16.8 | 14.7 | 9.2 | 20.1 |
| 28/06/24 | 0.3 | 2.2 | 9.1 | 12.9 |
| 30/06/25 | 28.5 | 20.1 | 13.3 | 9.8 |
| 30/06/26 | 0.8 | 2.3 | 11.4 | 22.7 |
Fund profile
More information is available from the manager’s website www.montanaro.co.uk
MTE aims to achieve capital growth by investing principally in smaller quoted, Continental European companies (those within the European Union, Norway, and Switzerland), but is not restricted from investing in smaller companies quoted on other European stock exchanges. The benchmark index is the MSCI Europe ex UK Small Cap Index (in sterling terms).
The original company dates back to 1981, but Montanaro Asset Management Limited (MAML) took on the management of the trust in September 2006 and the European small-cap investment approach dates from then.
The manager
MAML was established in 1991 and has an AUM of around £2.5bn. Charles Montanaro and his family together own 65% of the business. Furthermore, the CEO, Cédric Durant des Aulnois, owns 5%, with the remaining 30% being owned by Montanaro’s staff through an employee benefit trust established in 2025.
Lead manager of MTE is George Cooke, supported by Stefan Fischerfeier.
Chief investment officer and lead fund manager of MTE is George Cooke, with Stefan Fischerfeier acting as George’s back-up. Charles and George are members of the investment committee, which also includes Alex Magni, Adam Montanaro and Guido Dacie-Lombardo. MAML also owns around 10.8% of the outstanding shares of MTE (excluding treasury shares), having increased its holding in April 2025.
MAML has one of the largest and most experienced specialist teams in the UK dedicated to quoted smaller companies. The team is multi-lingual and multi-national. All but three of the fund managers also have research responsibilities.
Montanaro’s managers believe that the business is best served by operating with no more than around 40 staff, helping it preserve the advantages of a boutique investment firm. With £2.5bn of assets under management as at 31 December 2025 and an established range of UK, European and global equity strategies, Montanaro has reached a scale at which it intends to focus its resources on supporting and developing its existing offering rather than pursuing aggressive expansion.
In addition to MTE, Montanaro manages a range of UK and European equity funds, the Montanaro Better World Fund – an open-ended fund investing in small- and mid-cap companies that support the UN Sustainable Development Goals – and two global equity funds.
Board update
Gordon Neilly became chairman of MTE on 1 January 2026, succeeding Richard Curling. Neilly had already served on the board for more than five years, providing continuity during the transition. He has considerable experience of the investment management sector, having previously been chief of staff at Standard Life Aberdeen, global head of strategy at Aberdeen Standard Investments and joint chief executive of Cantor Fitzgerald. He is also a non-executive director of Personal Assets Trust.
The change represents continuity rather than a shift in the trust’s strategic direction, given that Neilly was already on the board when the current buyback and tender-offer policies were developed (see below).
The board comprises three independent non-executive directors: Gordon Neilly as chair, Caroline Roxburgh as senior independent director and chair of the audit committee, and Hillary Williams as chair of the remuneration committee.
Tender offer
Tender offers are one of the measures taken by the board to enhance shareholder returns.
As we covered in our last note (which can be read here), in March 2025 MTE’s board announced a series of value-enhancing initiatives designed to improve the trust’s appeal to shareholders. These included a more active share buyback policy, a reduction in management fees and the introduction of twice-yearly tender offers – all aimed at improving liquidity.
The first tender offer, completed in November 2025, saw 29,792,053 shares validly tendered, representing 20.5% of the issued share capital (excluding shares held in treasury). As this was well above the 5% maximum available under the tender, shareholders who tendered up to their basic entitlement had their shares purchased in full, while those who tendered more than this were scaled back.
Six-monthly 5% tender offers at a 5% discount to NAV.
The second tender offer under the new facility has recently closed. It again allowed eligible shareholders to tender up to 5% of their holding, with the tender price set at a 5% discount to the prevailing NAV per share on the calculation date. The board says this discount reflects the wider spreads associated with smaller companies and the costs of carrying out the exercise. It also means that shareholders who wish to realise part of their holding can do so at a price close to NAV, while continuing shareholders may benefit from a modest uplift to NAV per share.
The offer closed on 9 July, with the results announced on 13 July. Applications for a total of 17,966,998 shares were validly tendered, representing 14.6% of the total share capital (excluding treasury shares). As with the first tender, those shareholders who tendered more than the 5% basic entitlement have been scaled back. Purchases under the offer are expected to take place on 28 July.
The tender offers are structured to avoid forcing too much realisation at any one time.
The level of demand for both tenders suggests that there was a meaningful pool of shareholders looking for liquidity close to NAV. However, the facility is structured to avoid forcing too much realisation from the underlying portfolio at any one time, which is particularly relevant for a smaller companies strategy, where liquidity could be an issue.
In combination with the trust’s buyback programme and lower management fee, the tender facility forms part of the board’s wider attempt to address the discount while preserving the long-term investment proposition.
Market update
Figure 1: Performance of various indices, 12 months to 30 June 2026
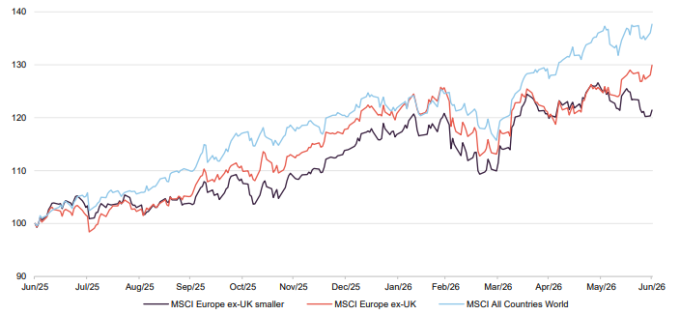
The 12 months to the end of June were generally very positive for equity markets. As shown in Figure 1, European equities were strong participants in this global rally, albeit they lagged somewhat behind the MSCI All Countries World index. This gap was primarily due to their lower exposure to AI and mega-cap technology names that powered the US market higher. In turn, smaller European companies were behind their larger counterparts, although they had kept pace until the beginning of June.
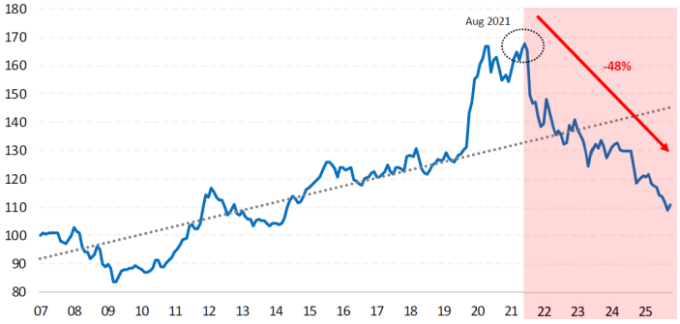
Looking longer-term, the period following the GFC up to late 2021 was an almost uninterrupted story of strong relative performance for growth investing. This was generally the case globally, and certainly for European small-cap investors. Figure 2 clearly shows this, including a particularly pronounced period during the Covid pandemic.
However, the market turned decisively in August 2021, as fears about rising inflation and interest rates began to set in, and since then there has been an equally extreme underperformance from growth sectors and holdings, of 48% to the end of the first quarter of this year.
Figure 2: MSCI Europe ex-UK small-cap growth vs value index since 2021
This has been a tough environment for MTE, as an unapologetically growth-biased small-cap investor. However, there are signs that the backdrop is becoming less difficult for MTE’s investment style, even if it is too early to call a decisive rotation back into growth. European markets have been led in recent years by value-oriented areas such as banks, energy and other rate-sensitive cyclicals. However, as the pressure from rising rates has eased, valuations in small- and mid-caps are looking more attractive, and a number of structural growth themes are gaining greater investor attention. Two of these, AI infrastructure and defence, are explored below. These are areas where Europe has a meaningful opportunity set and where MTE has exposure.
Similarly, following four straight years of small-cap underperformance in Europe (as measured by the performance of the MSCI Europe ex-UK small cap versus large-cap index), 2025 saw a small 1% outperformance from smaller companies. This was consolidated by a further 2% outperformance in the first quarter of this year. MTE has itself performed strongly in recent months (see page 12).
Companies exposed to AI bottlenecks have been pushed up sharply.
Artificial intelligence
The European smaller companies sector has not been immune to the impact of the ongoing artificial intelligence (AI) revolution. George notes that investors have been quick to look for perceived bottlenecks in the AI data centre supply chain, pushing up the shares of some European companies exposed to this theme very sharply.
Many AI businesses do not meet MTE’s quality criteria.
In many cases, this has included businesses that do not fit MTE’s usual quality criteria, including loss-making companies or businesses where George does not see the same durable barriers to entry, compounding potential or strength of business model that he looks for in portfolio holdings. This has been frustrating, as a number of MTE’s own companies have continued to perform well fundamentally, but have not always been rewarded by the market.
MTE’s exposure to AI is through high-quality business the manager regards as attractive in their own right.
That does not mean that MTE has no exposure to the AI theme. Technoprobe (see page 13), for example, has been a strong recent contributor to performance. However, George emphasises that this is a profitable, high-quality business that he already regarded as attractive in its own right, rather than a speculative AI trade. Indeed, he remains focused on whether underlying companies have the quality, profitability and barriers to entry needed to compound over the long term.
The same disciplined approach is being applied to software. The so-called “SaaSpocalypse” has put pressure on a number of software names, as investors question whether AI could erode the competitive advantages of companies whose products are built around narrow workflows or functionality that agents may increasingly be able to replicate. This was particularly the case earlier in the year, when the release of a new Claude security tool in February led to a sell-off in software names.
The “SaaSpocalypse” has gone too far.
George accepts that this is an important issue, but argues that it should not lead investors to treat all software companies in the same way. MTE’s exposure is concentrated in businesses where the barrier to entry is not simply the code, but factors such as embedded workflows, specialist functionality or ownership of hard-to-replicate assets. George believes that the selloff has gone too far, and there is no need to simply sell all software exposure.
European defence
European defence has been much in focus, and MTE stands to benefit.
Strong performance from defence companies has been one of the major themes in European equities in the past year, supported by higher government spending and a broader reassessment of Europe’s security needs, in light of a notably less-supportive American administration. NATO allies have agreed to invest 5% of GDP annually in defence and related security spending by 2035, including at least 3.5% of GDP on core defence requirements, while the European Commission’s Readiness 2030 plan is designed to mobilise more than €800bn of defence-related investment.
Germany’s spending commitment is particularly significant. Berlin has moved to loosen its strict fiscal rules and is planning a major increase in defence expenditure, with spending expected to rise towards the NATO 3.5% core defence target well ahead of the 2035 deadline. As Europe’s largest economy, any sustained shift in Germany’s defence budget could provide a major source of long-term demand.
MTE does not have large direct exposure to the defence sector. This partly reflects Montanaro’s quality-growth process, but also certain ethical restrictions around weapons and munitions. Where MTE does have exposure, it tends to be through specialist suppliers whose products sit around the defence ecosystem rather than through prime contractors or weapons manufacturers.
Invisio (invisio.com) is one such example. The Swedish company develops advanced communications and hearing-protection systems for defence and public-safety customers. Kitron (kitron.com – see page 13) is another; the company provides electronics manufacturing services and has benefitted from strong demand in defence and aerospace. In the first quarter of 2026, defence & aerospace accounted for 59% of Kitron’s order backlog, compared with 45% a year earlier. George says the strength of this demand has been notable because the defence side of the business had previously been regarded as relatively steady rather than the main growth engine. That this has changed in a big way is symptomatic of the sector.
Asset allocation
Figure 3: Sector allocation as at 31 May 2026
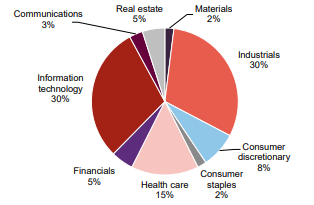
Figure 4: Country allocation as at 31 May 2026
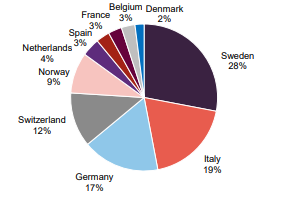
Figure 3 shows that sector allocation has remained relatively steady since our last note, which used data as at 30 April 2025. Industrials and information technology remain comfortably the largest sectors, and indeed both have increased their relative weighting. These are followed by healthcare and consumer discretionary, which have held steady at 15% and 8%, respectively.
In terms of geographic allocation, per Figure 4, Sweden remains MTE’s largest weighting at 28% of the total. Italy and Germany have switched places in second and third, respectively, with Italy’s share rising from 14% to 19%. Switzerland is the only other country with a double-digit percentage allocation.
These relatively modest changes in sector and country allocation are in line with George’s clear preference for taking a long-term view, holding companies through periods of market cyclicality and rarely selling positions due simply to shifts in market sentiment. Similarly, the country allocation is principally a result of George’s stock picking.
Overall, there were 47 holdings in the portfolio at the end of May 2026, one down on the figure at the time of our previous note.
Top 10 holdings
Figure 5: MTE’s 10 largest holdings as at 31 May 2026
| Holding 30 April 2025 (%) | Holding 31 May 2026 (%) | Change (%) | Country | Sector | |
|---|---|---|---|---|---|
| Technoprobe | 1.4 | 5.4 | 1.0 | Italy | Semiconductor testing equipment |
| NCAB | 2.7 | 5.4 | 2.7 | Sweden | Printed circuit board |
| Kitron | 4.9 | 4.9 | – | Norway | Electronics manufacturing |
| Plejd | 4.0 | 3.9 | (0.1) | Sweden | Smart lighting manufacturer |
| Belimo | 3.9 | 3.5 | (0.4) | Switzerland | Ventilation and air conditioning |
| Carel Industries | 1.7 | 3.5 | 1.8 | Italy | HVAC and refrigeration controls |
| Brembo | 2.0 | 3.1 | 1.1 | Italy | Automotive braking systems |
| Melexis | 1.9 | 3.0 | 1.1 | Belgium | Semiconductor sensors |
| Merlin Properties | 2.0 | 2.8 | 0.8 | Spain | Real estate |
| CTS Eventim | 4.4 | 2.7 | (1.7) | Germany | Ticketing and events |
| Total | 38.2 |
There has been significant change to MTE’s top 10 holdings since our last note, with six new names: Technoprobe, NCAB, Carel Industries, Brembo, Melexis and Merlin Properties. However, George confirms that none of these are new names in the portfolio, and instead their elevation has been largely due to market movements. He is a big believer in “letting the winners win”, rather than necessarily selling once a holding starts to perform well.
Technoprobe
Figure 6: Technoprobe (EUR)
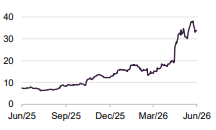
Technoprobe (technoprobe.com) is an Italian semiconductor equipment company specialising in probe cards, which are used to test chips during the manufacturing process. Its products are particularly important for complex semiconductors used in high-performance computing, artificial intelligence, consumer electronics, automotive and industrial applications.
The company has benefitted from the strong investment cycle in advanced semiconductors, with demand linked to AI and data centre applications helping to drive a sharp improvement in trading, and a very strong rally in the share price. Technoprobe reported record first-quarter 2026 revenues of €187m, up 19% year-on-year and raised its full-year guidance. Management said that capacity availability had become a critical factor in meeting demand during the current semiconductor expansion cycle.
NCAB
Figure 7: NCAB (SEK)
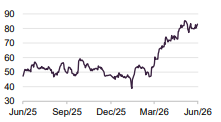
NCAB (ncabgroup.com) is a Swedish printed circuit board specialist, supplying PCBs to customers across sectors including industrials, automotive, medical technology, telecoms and aerospace. The company operates as an asset-light supplier, working with a network of factories rather than owning large-scale manufacturing capacity itself. Relatively small-scale buyers can use NCAB rather than going direct, as NCAB has aggregate buying power that its customers would not have individually.
George emphasises that NCAB gives the portfolio exposure to a broader set of structural growth themes, rather than being a pure AI-related holding. The shares have been supported by improving demand and a strong recovery in order intake. In the first quarter of 2026, NCAB reported net sales of SEK 1,074m, up 12%, while order intake rose 27%. The company said that demand was helped by large project orders, price increases and stronger activity in industrial markets, while its supply-chain model helped it manage a more turbulent environment.
Carel Industries
Figure 8: Carel Industries (EUR)
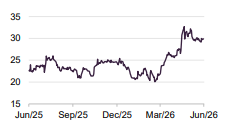
Carel Industries (carel.com) is an Italian company that designs and manufactures control systems, sensors and software for heating, ventilation, refrigeration and other energy-efficient applications. Its products are used across commercial refrigeration, building management and industrial cooling.
Most broadly, Carel’s appeal lies in its exposure to energy efficiency and more sophisticated cooling systems. George says that there have also been specific openings in relation to data centres, given their need for advanced cooling technology. Demand has also been helped by structural growth in areas such as refrigeration and lower-energy building systems, where regulation and customer behaviour are both pushing towards more efficient solutions. This gives the company a useful combination of industrial technology exposure and sustainability-linked growth, with recent performance showing that these end-markets remain supportive.
Brembo
Figure 9: Brembo (EUR)
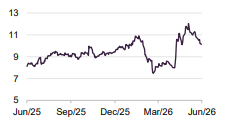
Brembo (brembogroup.com) is an Italian manufacturer of braking systems for cars, motorcycles and commercial vehicles, with a strong position in premium, high-performance and motorsport applications.
Brembo has built a strong brand and technology position in a specialised area of the car supply chain, where performance, safety and reliability are crucial. Its Sensify intelligent braking system also points to the way the company is trying to move beyond traditional components and into more software-led, higher-value systems. The near-term backdrop for autos remains mixed, but Brembo’s margins and premium positioning have helped it remain more resilient than many suppliers.
Melexis
Figure 10: Melexis (EUR)
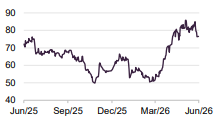
Melexis (melexis.com) is a Belgian semiconductor company focused on mixed-signal chips, sensors and driver integrated circuits, with a particularly strong position in automotive applications. Its products are used in areas including electrification, safety, thermal management, lighting and position sensing.
The company has been affected by a softer period for automotive semiconductors, as customers worked through inventories and vehicle production growth moderated. However, the longer-term attraction remains the rising semiconductor content per car, particularly as vehicles become more electrified, automated and digitally controlled. Melexis therefore gives MTE exposure to automotive technology without relying solely on vehicle volumes. The shares had struggled until recently, but have rebounded strongly since the end of March.
Merlin Properties
Figure 11: Merlin Properties (EUR)
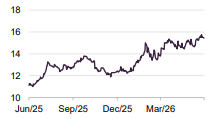
Merlin Properties (merlinproperties.com) is a Spanish listed real estate company with a portfolio spanning offices, logistics, shopping centres and data centres. Its assets are mainly in Spain and Portugal.
At a time when many listed property companies are still being judged mainly on interest rates, valuations and office demand, Merlin has differentiated itself with the increasing importance of its data centre platform. The company is using land it already controls in markets across the “Iberian Digital Diagonal” where it believes power availability, renewable energy, fibre connections and lower development costs give it an advantage over more constrained European hubs such as Frankfurt, London and Paris.
For MTE, the holding therefore adds exposure to digital infrastructure through a property company with an established Iberian asset base.
Performance
Figure 12: MTE NAV total return performance relative to the MSCI Europe ex UK Small Cap Index, over the five years to 30 June 2026
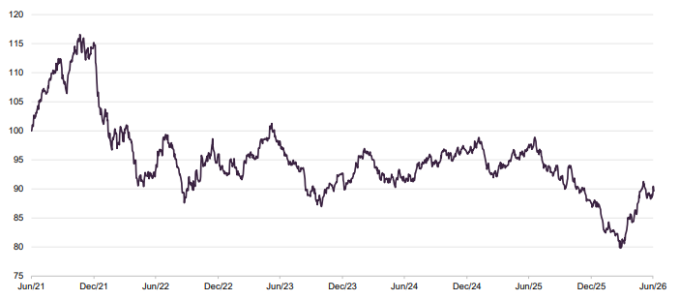
As is illustrated in Figure 12, over the past five years, MTE’s NAV return has underperformed its benchmark, the MSCI Europe ex UK Small Cap Index. During 2020 and 2021, the fund delivered significant outperformance – the tail end of which can be seen in Figure 12 – as low interest rates and the pandemic-driven acceleration of structural trends provided a strong tailwind for growth stocks globally. Much of this outperformance was unwound during a difficult 2022, as rising inflation and expectations of higher interest rates prompted a sell-off in growth stocks, while value-style investing enjoyed a relative resurgence.
Relative performance since has generally been steadier. The fund saw a further reversal at the end of 2025, as European markets experienced an unusually severe rotation away from growth and quality towards value, cyclicals and macro-sensitive areas. George describes this as particularly frustrating, with many of the companies in the portfolio performing well operationally, but seeing their share prices fall. In part this was caused by concerns over valuations of growth stocks, as the market’s focus shifted from the initial hype around AI to demanding proof of actual profits. However, rising trade tensions and shifting monetary policies also caused investors to favour more stable, cash-generating companies. Early in 2026, performance was held back by the software selloff triggered by concerns about the possible negative impact of agentic AI.
Very recent performance has been good – Figure 13 shows a marked outperformance of the benchmark in both NAV and share price terms in the past months. George says that there has been no outstanding reason for this turnaround, although MTE has been on the right side of positive momentum in some stocks.
Figure 13: Cumulative total returns for periods ending 30 June 2026
| 3 months (%) | 6 months (%) | 1 year (%) | 3 years (%) | 5 years (%) | 10 years (%) | |
|---|---|---|---|---|---|---|
| NAV | 18.1 | 6.0 | 0.8 | 29.9 | 6.3 | 254.5 |
| Share price | 17.9 | 6.7 | 2.3 | 25.5 | 12.4 | 209.5 |
| Benchmark1 | 6.2 | 4.4 | 11.4 | 37.8 | 25.6 | 144.7 |
| MSCI European ex UK | 12.8 | 10.5 | 22.7 | 52.2 | 64.9 | 190.9 |
Figure 13 also shows much longer-term performance, which remains very strong. MTE’s total NAV return has been more than 100% ahead of the benchmark over 10 years, and also comfortably ahead of the larger-cap index over the same period.
Top contributors and detractors
Figure 14 shows the top contributors and detractors to MTE’s returns for the 12 months to 31 March 2026.
Figure 14: MTE top contributors and detractors
| Top contributors | % contribution | Top detractors | % contribution |
|---|---|---|---|
| Kitron | 2.1 | ChemoMetec | (1.7) |
| Technoprobe | 0.7 | ATOSS Software | (1.3) |
| NCAB | 0.6 | CTS Eventim | (1.1) |
| IMCD | 0.3 | Reply | (0.7) |
| Merlin Properties | 0.3 | Belimo | (0.6) |
Technoprobe and NCAB were covered in some detail above (see page 9-10), but it is worth examining Kitron here, as well as the three biggest detractors.
Kitron (kitron.com) is a Scandinavian electronics manufacturing services provider, producing complex electronic assemblies for customers in sectors including defence, industrials, electrification, connectivity and medical devices. The shares contributed strongly as investors responded to accelerating demand across the business, particularly in defence and aerospace. This reflected increased European defence spending and the need to expand manufacturing capacity in sensitive electronic systems. However, growth was not limited to this area, with Kitron also reporting progress across its other end-markets.
ChemoMetec (chemometec.com) fell after a period of weaker momentum and uncertainty around its earnings outlook. Although the company later upgraded its 2025/26 guidance, this followed an earlier reduction in expectations and was helped partly by an accounting adjustment that had a positive one-off effect on sales and EBITDA. The shares were held back by concerns around the pace of underlying growth, particularly after a strong earlier period for the life sciences tools business.
ATOSS Software (atoss.com) weakened despite continuing to report growth in its workforce management software business. The shares were affected by a broader derating of highly valued European software and quality growth companies. A planned leadership transition, with founder and chief executive Andreas Obereder set to move to the supervisory board, also added to near-term uncertainty, although management maintained the company’s previously announced 2026 growth trajectory.
CTS Eventim (eventim.de) detracted after investors reacted negatively to a weaker-than-expected second quarter in 2025. The ticketing and live entertainment group reported lower profit, with earnings affected by weaker revenue from its own events and the cost of integrating acquisitions. Subsequent trading showed signs of recovery, including a strong first quarter in 2026.
The company has also faced wider scrutiny over some of its consumer practices. In February 2025, a German court ruled that the way Eventim repeatedly promoted ticket insurance during the online checkout process breached the EU Digital Services Act, although the judgment was not final and Eventim appealed. Separately, in January 2026, it reached an out-of-court settlement with a German consumer organisation over fees retained from refunds for pandemic-era cancellations. More than 5,000 registered claimants were offered €20 vouchers, although the settlement did not establish a general right to the repayment of fees.
Peer group
MTE is one of three funds in the AIC’s European Smaller Companies sector.
MTE is a member of the AIC’s European Smaller Companies sector, which includes two other funds: JPMorgan European Discovery Trust and The European Smaller Companies Trust. The peer group has reduced in number since our last note, with the merger of The European Assets Trust into The European Smaller Companies Trust in October 2025.
Per Figure 15, MTE’s strong short-term performance puts it at the head of its peer group over three months, although its difficulties at the beginning of the year see it at the bottom over six months.
Similarly, MTE has underperformed the peer group median over the last three and five years. The fund performed particularly strongly when growth stocks were highly favoured during 2020 and 2021, but much of the subsequent relative weakness occurred in the first half of 2022. Russia’s invasion of Ukraine and the resulting surge in fuel and commodity prices intensified inflationary pressures and expectations for higher interest rates, creating a difficult backdrop for growth companies. Although this period has now dropped out of the three-year figures, it remains fully reflected in the five-year numbers.
Over 10 years, MTE’s performance has been much more competitive, with its NAV total return ahead of the peer group median. This longer period captures the strong post-COVID rally in growth stocks, when low interest rates and abundant liquidity provided a supportive backdrop for the types of smaller companies held by the fund. Whilst subsequent weakness has weighed heavily on the five-year figures, the 10-year numbers give a fuller picture of MTE’s longer-term record across different market conditions.
Figure 15: Listed European smaller companies peer group NAV total return performance over
periods ending 30 June 2026
| 3 months (%) | 6 months (%) | 1 year (%) | 3 years (%) | 5 years (%) | 10 years (%) | |
|---|---|---|---|---|---|---|
| MTE | 17.9 | 6.7 | 2.3 | 25.5 | 12.4 | 209.5 |
| JPMorgan European Discovery Trust | 11.1 | 8.5 | 16.3 | 60.1 | 34.0 | 157.2 |
| The European Smaller Companies Trust | 14.9 | 8.4 | 16.8 | 49.9 | 37.8 | 242.1 |
| Peer group median | 14.6 | 7.9 | 11.8 | 45.2 | 28.1 | 202.9 |
| MTE rank | 1/3 | 3/3 | 3/3 | 3/3 | 3/3 | 2/3 |
Figure 16 shows fund statistics for MTE’s peer group. As a result of the aforementioned merger, MTE is now notably the smallest trust in the sector. However, its assets are of a sufficient size that this should not be a significant impediment to demand for its shares.
MTE also has the lowest yield of its peers, a consequence of its greater exposure to high-growth companies, which typically pay lower dividends.
MTE’s discount remains the narrowest in its peer group, though it also sits close to the peer group average, with the range being narrow. MTE’s ongoing charges ratio is higher than its two peers, reflecting its smaller size. However, the historic cost in Figure 16 does not yet reflect the full benefit of the management fee reduction that took effect from 1 April 2025, which should move the trust closer to the peer-group median over time.
Figure 16: Listed European smaller companies peer group stats, as at 25 June 2026
| Market cap(£m) | Discount(%) | Dividend yield(%) | Ongoing charge(%) | |
|---|---|---|---|---|
| MTE | 219 | (8.1) | 0.7 | 1.00 |
| JPMorgan European Discovery Trust | 584 | (8.7) | 2.5 | 0.88 |
| The European Smaller Companies Trust | 796 | (9.3) | 2.1 | 0.68 |
| Peer group median | 584 | -8.7 | 2.1 | 0.88 |
| MTE rank | 3/3 | 1/3 | 3/3 | 3/3 |
Dividend
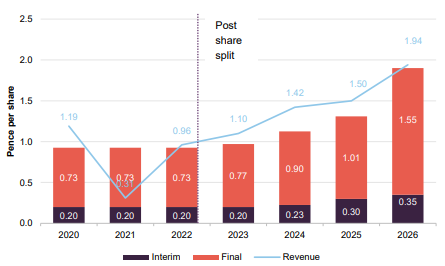
MTE is managed with capital growth as its primary objective. Any revenue income generated is therefore a consequence of the manager’s stock selection process, rather than an explicit target, meaning that the level of income can vary considerably over time. However, given the trust’s focus on high-quality companies, many of which are cash-generative and dividend-paying, MTE is able to pay a yield, which currently stands at 0.74%.
Figure 17: MTE dividend history, accounting years ended 31 March
of MTE’s shares
In 2025, MTE made a third interim dividend of 0.05p in addition to the usual initial two payments. For ease of reference, this has been included within the final dividend in Figure 17. The company has not provided a specific explanation for the additional payment. However, it appears to reflect a small subsequent adjustment to the distribution for the year ended 31 March 2025.
A second interim dividend of 1.2p has been announced and will be paid on 28 August 2026. In addition, in order to meet the minimum distribution requirements and to reflect the recent significant reduction in the number of shares in issue, a special dividend of 0.35p will also be paid on the same date, bringing the total dividends for the year to 1.9p per share.
Figure 17 shows that the dividend has been comfortably covered by revenue in recent years. MTE also has a substantial revenue reserve, which increased to £5.8m at 31 March 2026. This is equivalent to approximately 4.8p per share, or more than three times the total dividend of 1.31p per share paid in respect of the year, providing the board with a meaningful cushion should earnings come under pressure.
Premium/(discount)
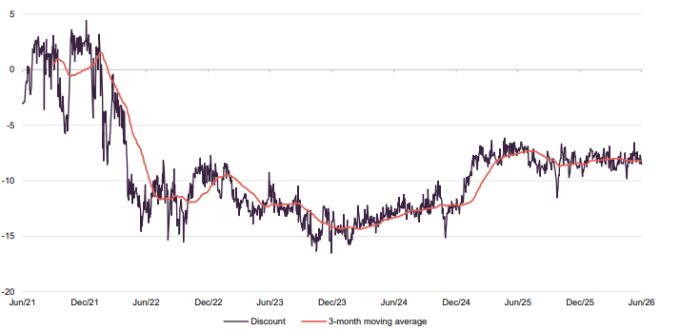
Over the 12 months to the end of June 2026, MTE’s shares traded within a range of a 7.3% to an 8.7% discount, at an average discount of 8.1%. As of 22 July 2026, the shares were trading at a discount of 7.9%.
MTE’s discount widened sharply during 2022 as rising inflation and interest-rate expectations reduced investors’ appetite for growth companies. It subsequently reached over 15% in late 2023, before narrowing materially from the end of 2024 as the outlook for inflation and interest rates became less difficult and the board adopted a more active approach to discount control.
Specifically, in March 2025 the board introduced a policy aimed at maintaining a single-digit discount in normal market conditions, supported by regular market buybacks and twice-yearly tender offers (see page 4). The policy appears to be working. Since early 2025, MTE’s discount has generally remained in the high single digits, compared with the much wider levels seen during 2022 to 2024.
The board has also continued to use market buybacks between the tender offers. A further 12.51m shares were repurchased between completion of the first tender and the second tender circular, equivalent to around 9% of the shares remaining immediately after the first tender.
Figure 18: MTE discount over five years ending 30 June 2026
SWOT analysis
Figure 19: SWOT analysis for MTE
| Strengths | Weaknesses |
|---|---|
| MTE has a differentiated, quality-growth approach to European smaller companies. The manager focuses on businesses with strong market positions, recurring revenues, high returns on capital and the potential to compound earnings over long periods. This has supported a strong record over the very long term, with MTE ahead of the peer group median over 10 years.
The trust benefits from a specialist and well-resourced manager. George Cooke has substantial experience investing in European smaller companies and is supported by Montanaro’s wider research team, whose dedicated focus on smaller businesses can be an advantage in a relatively under-researched part of the market. Gearing can enhance returns when the portfolio performs well. The trust may borrow up to 30% of shareholders’ funds, net of cash, although gearing has generally been used conservatively and stood at 1.6% at 29 May 2026. This gives the manager scope to increase exposure when attractive opportunities arise without making gearing a dominant source of risk. The board has taken a more active approach to discount control. Its single-digit discount policy, regular buybacks and twice-yearly tender offers have helped keep the discount broadly in the high single digits since early 2025. |
MTE’s pronounced quality and growth bias can leave it behind when value, cyclical or lower-quality companies lead the market, even if the underlying portfolio businesses continue to perform well operationally.
The portfolio is sensitive to interest-rate expectations. Higher bond yields reduce the present value placed on companies whose earnings are expected further into the future. This was a major factor behind the trust’s relative weakness from 2022 and remains an important source of style risk. The five-year performance remains weak relative to peers. Although the most recent three-month performance has improved and the 10-year record is stronger, the five-year figures still capture the sharp derating of growth companies during 2022. A quality-focused process can lead the manager to avoid cheaper parts of the market. The emphasis on financially strong businesses means MTE may miss rallies in highly leveraged, economically sensitive or lower-quality companies that do not meet its investment criteria. Gearing can magnify losses as well as gains. Current gearing is modest, but the trust has authority to borrow materially more. Increased gearing introduced at the wrong point in the cycle would amplify declines in NAV. |
| Opportunities | Threats |
| A decline in interest rates could provide a more supportive backdrop. Lower discount rates would be helpful for long-duration growth businesses and could encourage investors to place greater value on MTE’s portfolio of compounders.
European smaller companies remain relatively overlooked. Investor attention and capital have been concentrated in US mega-cap stocks, leaving scope for a broader market rotation towards smaller businesses and less-crowded areas of Europe. The portfolio has exposure to structural growth themes, including artificial intelligence, healthcare innovation and increased European defence spending. The opportunity is not limited to direct beneficiaries, but also includes specialist suppliers and enabling technologies. Improving earnings delivery could prompt a rerating. If portfolio companies continue to compound earnings while their valuations remain subdued, returns could benefit from both profit growth and a recovery in valuation multiples. The discount-control measures could improve shareholder returns. Repurchasing shares below NAV is accretive to NAV per share, while the tender offers provide a regular exit mechanism and may help reduce the risk of the discount returning to the much wider levels seen in 2022 to 2024. |
Interest rates could remain higher for longer. Renewed inflation or rising bond yields would be likely to weigh on growth-company valuations and could again place pressure on MTE’s relative performance.
The market may continue to favour value or cyclical businesses. A prolonged rotation away from quality growth would remain a difficult environment for the trust, irrespective of the operational progress made by its holdings. Smaller companies can be less liquid and more economically sensitive. In periods of stress, their shares may fall more sharply than those of larger companies and can be harder to trade without affecting the price. Valuation discipline remains important. High-quality companies can still produce poor investment returns when bought at excessive valuations. Earnings disappointments can lead to particularly sharp falls where strong growth has already been priced in. MTE has concentrated geographic and style exposure. It is focused on continental European smaller companies rather than offering broad global diversification, leaving returns sensitive to the European economy, political developments, regulation and currency movements. The discount could widen again despite the board’s policy. Buybacks and tenders can influence supply and demand, but they cannot remove the effect of weak sentiment towards European smaller companies or investment trusts more generally. |
Bull vs. bear case
Figure 20: Bull vs. bear case for MTE
| Aspect | Bull case | Bear case |
|---|---|---|
| Performance | MTE offers focused exposure to high-quality European smaller companies, an area that has historically generated attractive long-term returns. Its 10-year record remains strong and recent performance has improved as the market backdrop has become more supportive. If investors continue to move beyond US mega-cap technology stocks and return to European smaller companies, MTE could benefit from both earnings growth and a recovery in valuations. Modest gearing can also enhance returns in rising markets. | MTE’s quality-growth bias leaves it vulnerable when value, cyclical or lower-quality companies lead the market. The five-year record remains weak relative to peers, reflecting the sharp derating of growth stocks from 2022. If interest rates or bond yields remain elevated, investors may continue to apply lower valuation multiples to the portfolio’s longer-duration earnings. Gearing, although currently modest, can magnify losses during falling markets. |
| Dividends | MTE’s dividend has been comfortably covered by revenue in recent years. At 30 September 2025, its £6.4m revenue reserve was equivalent to around 4.29p per share, providing a meaningful cushion relative to the annual dividend. This gives the board some flexibility to maintain or gradually increase distributions if portfolio income fluctuates. | MTE is principally a capital-growth investment rather than an income vehicle. Its yield is modest and the dividend is unlikely to be a major contributor to total returns. Income may also vary because the portfolio is concentrated in smaller growth companies, where reinvestment in the business often takes priority over paying high dividends. |
| Outlook | The long-term opportunity in European smaller companies remains attractive. The portfolio contains businesses exposed to structural trends including artificial intelligence and increased European defence spending. A stabilisation or decline in inflation and interest rates would provide a more favourable backdrop for growth-company valuations, while continued earnings delivery could encourage a rerating. | The outlook remains sensitive to macroeconomic conditions. Renewed inflation, higher-for-longer interest rates or weaker European economic growth could place pressure on both company earnings and valuation multiples. Smaller businesses can also be more exposed to changes in customer demand, financing conditions and supply chains. If growth investing remains out of favour, operational progress may not translate into stronger share prices. |
| Discount | The board’s more active discount-control policy appears to be working. Regular market buybacks and twice-yearly tender offers have helped keep the shares on a broadly single-digit discount since early 2025. Between the first and second tenders, MTE repurchased approximately 12.5m shares in the market, equivalent to around 9% of the shares outstanding immediately after the first tender. Buybacks at a discount are accretive to NAV per share and the tenders provide shareholders with a regular exit mechanism. | Discount-control measures cannot eliminate weak market demand for investment trusts or European smaller companies. The discount could widen again if performance disappoints, interest-rate expectations rise or investors move away from growth-oriented strategies. Regular buybacks and tenders also reduce the trust’s size, which may lower liquidity and increase the ongoing-charges ratio if costs are spread across a smaller asset base. |
| Other | MTE benefits from a specialist manager and a dedicated European smaller-companies research platform. The portfolio’s emphasis on financially strong, well-managed businesses may also provide some resilience in more difficult economic conditions. | The trust is concentrated by geography, market-cap segment and investment style. Its quality discipline may lead it to avoid cheaper or more cyclical companies that can perform strongly during market rotations. Smaller-company shares are generally less liquid than large caps and can experience sharper price movements during periods of stress. |
Previous notes
Readers interested in further information about MTE may wish to read our other notes. Click the links in the table or visit the QuotedData website.
Figure 21: QuotedData’s other notes on MTE
| Note | Date published | Note type |
|---|---|---|
| Quality businesses at sensible prices | March 2019 | Initiation |
| Focus on the small picture | September 2019 | Update |
| Impressive returns in difficult market | October 2020 | Annual overview |
| Unfazed by market turmoil | March 2022 | Annual overview |
| No Continental drift | August 2023 | Annual overview |
| Primed for ignition | August 2024 | Annual overview |
| Turning tariffs into opportunity: MTE’s edge | June 2025 | Update |
IMPORTANT INFORMATION
This marketing communication has been prepared for Montanaro European Smaller Companies Investment Trust Plc by Marten & Co, which is authorised and regulated by the Financial Conduct Authority (FCA). It constitutes non-independent research as defined under the UK MiFID II regime and the onshored Commission Delegated Regulation (EU) 2017/565.
This communication is intended for use by investment professionals as defined in Article 19(5) of the Financial Services and Markets Act 2000 (Financial Promotion) Order 2005.
Marten & Co is not authorised to provide advice to retail clients. Accordingly, if you are not a professional investor, or are otherwise restricted from receiving this information, you should disregard it.
Charts and data are sourced from Bloomberg unless otherwise stated. Please read the important information at the back of this document. The note does not have regard to the specific investment objectives, financial situation and needs of any specific person who may receive it.
The note has not been prepared in accordance with legal requirements designed to promote the independence of investment research and as such is considered to be a marketing communication. The analysts who prepared this note are not constrained from dealing ahead of it, but in practice, and in accordance with our internal code of good conduct, will refrain from doing so for the period from which they first obtained the information necessary to prepare the note until one month after the note’s publication. Nevertheless, they may have an interest in any of the securities mentioned within this note.
This note has been compiled from publicly available information. This note is not directed at any person in any jurisdiction where (by reason of that person’s nationality, residence or otherwise) the publication or availability of this note is prohibited.
Accuracy of Content: Whilst Marten & Co uses reasonable efforts to obtain information from sources which we believe to be reliable and to ensure that the information in this note is up to date and accurate, we make no representation or warranty that the information contained in this note is accurate, reliable or complete. The information contained in this note is provided by Marten & Co for personal use and information purposes generally. You are solely liable for any use you may make of this information. The information is inherently subject to change without notice and may become outdated. You, therefore, should verify any information obtained from this note before you use it.
No Advice: Nothing contained in this note constitutes or should be construed to constitute investment, legal, tax or other advice.
No Representation or Warranty: No representation, warranty or guarantee of any kind, express or implied is given by Marten & Co in respect of any information contained on this note.
Exclusion of Liability: To the fullest extent allowed by law, Marten & Co shall not be liable for any direct or indirect losses, damages, costs or expenses incurred or suffered by you arising out or in connection with the access to, use of or reliance on any information contained on this note. In no circumstance shall Marten & Co and its employees have any liability for consequential or special damages.
Governing Law and Jurisdiction: These terms and conditions and all matters connected with them, are governed by the laws of England and Wales and shall be subject to the exclusive jurisdiction of the English courts. If you access this note from outside the UK, you are responsible for ensuring compliance with any local laws relating to access.
No information contained in this note shall form the basis of, or be relied upon in connection with, any offer or commitment whatsoever in any jurisdiction.
Investment Performance Information: Please remember that past performance is not necessarily a guide to the future and that the value of shares and the income from them can go down as well as up. Exchange rates may also cause the value of underlying overseas investments to go down as well as up. Marten & Co may write on companies that use gearing in a number of forms that can increase volatility and, in some cases, to a complete loss of an investment.