Turning tariffs into opportunity?
In an environment of heightened volatility that appears to have been triggered by Trump’s tariff policies, European stocks have remained relatively resilient. Germany’s plans to increase defence and infrastructure spending, combined with falling interest rates, appear to have contributed to improved sentiment towards the region. Montanaro European Smaller Companies’s (MTE’s) portfolio of high-quality growth stocks could be well positioned to navigate this period of uncertainty. Low valuations relative to history may enhance the upside potential.
MTE’s board has taken steps to support shareholder value through regular 5% tender offers, a single-digit discount policy, and lower management fees. Against a backdrop where European small caps remain undervalued relative to large-cap – despite offering higher earnings growth – MTE has been positioned to take advantage. MTE’s manager highlights its consistent management team, disciplined approach and a focused portfolio of high-quality businesses operating in specialised sectors with strong pricing power. It says that these have resulted in strong performance over the long term, with shareholder returns more than tripling over the last 10 years.
Continental European smaller companies
MTE aims to achieve capital growth by investing principally in Continental European quoted smaller companies. The benchmark index is the MSCI Europe ex UK Small Cap Index (in sterling terms).
| Year ended | Share price total return(%) | NAV total return(%) | MSCI Europe ex UK small cap TR. (%) | MSCI Europe ex UK TR(%) |
|---|---|---|---|---|
| 31/05/2021 | 52.6 | 42.4 | 40.2 | 25.5 |
| 31/05/2022 | (20.4) | (12.3) | (5.8) | (2.1) |
| 31/05/2023 | 0.2 | 3.5 | (4.7) | 8.1 |
| 31/05/2024 | 4.7 | 4.4 | 15.7 | 16.8 |
| 31/05/2025 | 19.6 | 11.2 | 5.5 | 6.3 |
Fund profile
More information is available from the manager’s website www.montanaro.co.uk
MTE aims to achieve capital growth by investing principally in smaller quoted, Continental European companies (those within the European Union, Norway, and Switzerland), but is not restricted from investing in smaller companies quoted on other European stock exchanges. The benchmark index is the MSCI Europe ex UK Small Cap Index (in sterling terms).
The original company dates back to 1981, but Montanaro Asset Management Limited (MAML) took on the management of the trust in September 2006 and the European small-cap investment approach dates from then.
The manager
MAML was established in 1991 and has an AUM of more than £3bn. Charles Montanaro and his family together own 60% of the business. Furthermore, the CEO, Cédric Durant des Aulnois, owns 5%, while the head of investments, Mark Rogers, also owns 5%, with the remaining 30% owned by Montanaro’s staff through an employee benefit trust established in 2025.
The lead manager on MTE is George Cooke (who is also head of investments at MAML), and Stefan Fischerfeier acts as George’s back-up. Charles, Mark, and George are all members of the investment committee, which also includes Alex Magni. MAML also owns 7.4% of the outstanding shares of MTE, having increased its holding in April 2025.
MAML believes that it has the largest and most experienced team in Europe
They are supported by what MAML describes as the largest and most experienced team in Europe, specialising in researching and investing in quoted small- and mid-cap companies. The team is multi-lingual and multi-national. All but two of the fund managers also have research responsibilities.
Montanaro’s managers state that the company is best served by operating with a maximum of 40 staff members, as to preserve the advantages of a boutique outfit. With 37 current staff members (16 of whom are investment professionals), Montanaro is now operating as a boutique and, as such, will continue to devote its resources towards its current strategies, as opposed to aggressively growing the company, for example.
In addition to MTE, the team manages a range of funds focused on UK and European equities, the Montanaro Better World Fund (an open-ended fund investing in small- and mid-cap companies supporting the UN Sustainable Development Goals), and two global equity funds.
MTE’s new value-enhancing initiatives
On 27 March 2025, MTE’s board announced three changes to the trust that are designed to strengthen MTE’s investment proposition and deliver value for all its shareholders.
MTE’s board have undertaken changes to improve shareholder value
1.) The board will implement regular tender offers with the aim of improving MTE’s liquidity. It intends to offer shareholders two opportunities a year, around the time of MTE’s interim and annual results publications, to tender their shares at a 5% discount to NAV (which the board says reflects the wider spreads amongst smaller companies and the cost associated with the exercise). Each tender will be limited to a maximum of 5% of MTE’s share issuance. The first tender offer is expected to take place in Autumn 2025 following MTE’s interim results.
2.) Having conducted a review of all costs, the board now expects the ongoing charges ratio to remain below 1% in the future. To that end, the board has negotiated a further reduction in Montanaro’s management fee (the second in four years). The management will be reduced from 0.90% to 0.825% per annum of MTE’s market capitalisation up to £500m; from 0.75% per annum to 0.70% per annum of MTE’s market capitalisation between £500m–750m; and (unchanged) 0.65% per annum of any market capitalisation in excess of £750m. The new fee structure took effect from 1 April 2025. Based on MTE’s current market capitalisation of £276m, MTE’s fees are charged at the first-tier rate of 0.825% per annum.
3.) Having noted the “changing expectations amongst shareholders”, MTE’s board has elected to purse a more active share buyback policy. Now, under normal market circumstances, MTE’s board will target a single-digit discount. The board has noted that share repurchases at a discount are NAV accretive to remaining shareholders, and believes this policy will be of benefit to all shareholders. Its buyback policy will continue to remain subject to shareholder approval as necessary to continue the facility.
According to the board, these policies have already had a notable impact on the demand for MTE’s shares. As we show on page 20, MTE’s discount has already narrowed to a single-digit level.
Market update
Although Europe appeared to begin 2025 on relatively good footing, having outpaced global equity markets over the first three months, Trump’s tariff announcements on 2 April – dubbed “Liberation day” – seem to have disrupted markets. America now has its highest average tariff levels since 1940, with the EU facing a blanket 25% tariff across all of its constituents. However, just a few days later, on 9 April, Trump reversed course, offering a 90-day grace period to countries that chose not to impose reciprocal tariffs before the new rates come into effect. And, more recently, he has signed new trade deals with the UK and China which have partially reversed some of his previous tariffs.
Negotiations between the EU and US are said to be progressing, though no formal agreement has been made. However, on 23 May, Trump threatened to put a 50% tariff on all European Union import from 1 June, interpreted by some observers as an attempt to force the EU to accelerate the negotiations and accept concessions so as to achieve a deal that is more aligned with Trump’s economic interests. There have been some signs that the EU might be prepared to concede more ground to the US in than initially anticipated. The EU had previously expressed its desire for a “completely balanced outcome” from the trade negotiations, but several EU member states are now signalling their desire for a quick deal with the US so as to avoid the 50% tariffs.
Whilst it may be difficult to predict the final outcomes of the various tariff negotiations that are now underway, Trump’s blanket tariff approach towards Europe appears to have led to some unexpected consequences. In effect, certain countries may be facing a lower tariff burden than initial policy indications, particularly since the Trump administration’s approach appears to link higher trade surpluses with higher tariff levels. Germany, Italy, and Ireland, for example, maintain significantly larger nominal trade surpluses with the US compared to other member states. Germany alone reports a US trade surplus of €85.8bn, far above the EU average of €5.5bn. This means that while some countries will be more heavily impacted due to their large export bases, had tariffs been imposed on a country-by-country basis, they might have faced even higher rates.
Germany
Germany has begun to loosen its strict ‘debt break’ – opening up the fiscal taps as a result
In a notable departure from its traditionally cautious stance on public spending, Germany – Europe’s largest economy – is implementing a new fiscal stimulus regime aimed at revitalising its low growth. The German government is relaxing its “debt brake” in select areas – a policy that limits annual structural deficits to 0.35% of GDP – in order to increase expenditure.
- German defence spending will increase from 2.1% to 3.0%, equivalent to a €40bn stimulus.
- €500bn in new infrastructure expenditure has also been announced, spread over the next 12 years.
- Federal states will receive a 0.35% of GDP exemption from the debt brake (effectively allowing for €15.4bn in new expenditure by regional government).
- The government will undertake a series of reforms to its debt-brake policy, to further encourage new investments.
Some market commentators believe that Germany’s fiscal expansion will be sufficient to offset the impact of the trade war (in conjunction with other countries’ stimulus and lower energy prices). However, “offsetting” in this context is expected to imply that European growth will remain subdued throughout 2025, with the market projecting average GDP growth of 1% across Europe for the year. The composite PMI for Europe was 50.2 in May, down marginally from April’s 50.4 reading, but still pointing towards a mild expansion. May’s figure was also the fifth consecutive above-50 reading. The consecutive positive figures suggest that, while Trump’s tariffs have increased the risk of a recession, businesses still expect to see an expansion in economic activity rather than a contraction, at least for now.
EU-wide action
The EU may not have to rely solely on Germany’s measures to support growth, as it has also launched the “Competitiveness Compass” – an initiative aimed at guiding the European Commission’s work. Its objective is to enhance European competitiveness through three main avenues: closing the innovation gap; creating a joint roadmap for decarbonisation and competitiveness; and reducing excessive dependencies while improving security.
The EU’s recently announced fiscal stimulus may be sufficient to offset the impact of Trump’s tariffs
In addition to these three pillars, the EU has introduced five complementary initiatives: simplifying and reducing regulatory and administrative burdens; lowering barriers within the single market; boosting financial competitiveness; promoting skills and quality jobs; and enhancing policy co-ordination at both EU and national levels. Whilst the announcement encompasses a broad set of objectives (with a number of forward-looking outcomes), it does suggest that the EU recognises the importance of improving productivity – and that there may be the political will to enact the necessary policy changes. Although these initiatives were only launched in January 2025, their timing is considered by some to be timely, given that Trump’s new tariff policy may force Europe to pursue alternative growth avenues if it can no longer rely on its largest export partner.
The European Central Bank (ECB) has already taken action that is designed to mitigate some of the potential economic fallout from Trump’s tariffs, cutting interest rates by 0.25% in April, bringing the eurozone rate down to 2.25% – the seventh rate cut since June 2024. The ECB noted that “the outlook for growth has deteriorated owing to rising trade tensions” and that these tensions are likely to have a “tightening impact on financing conditions” for European consumers and businesses.
A quality growth environment?
Quality growth styles of investing – like MTE – have outperformed during downturns
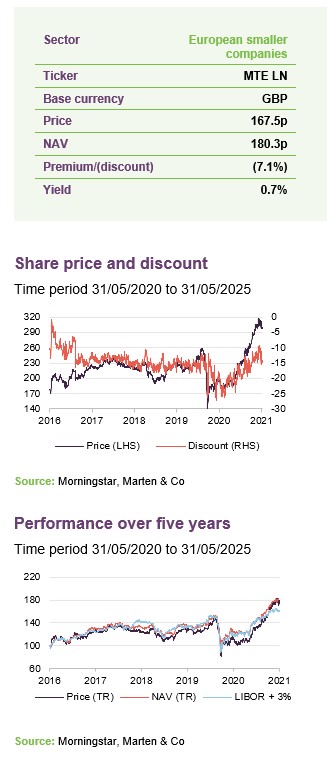
A weaker growth outlook may potentially create conditions that are favourable for quality growth stocks, and by extension MTE’s portfolio, as shown in Figure 1. Economic slowdowns can lead to expectations of falling interest rates, and lower interest rates and yields are generally associated with support for growth stock valuations.
Figure 1: Performance of European style indices relative to the European market during recessions
Source: Quoteddata, Morningstar. Data covers Europe’s eight recessionary periods since 1980, as defined by the OECD. All data is based on the respective MSCI Europe Index. All data in local currency terms except for the momentum index, which is in Euro. The MSCI Small Cap index only samples data from January 2000. The market index is the MSCI Europe Index.
Investors may also view “quality growth” companies as a relatively stable option during periods of economic downturn. This is not necessarily because their business models are inherently defensive – unlike certain traditionally lower-growth sectors such as regulated utilities – but rather because their strong growth potential may enable them to continue reporting revenue and profit increases even in uncertain economic conditions. This is particularly true for businesses supported by long-term structural trends such as digitisation or demographic shifts. Alternatively, it may be that their higher-quality business models allow them to navigate challenging markets more effectively than their peers, with investors perceiving their earnings as more dependable or their management teams as more capable.
A tangible valuation opportunity?
Current European valuations may present an attractive opportunity
European equities continue to trade at a significant discount to their global peers, with valuations for both large and small-cap companies appearing cheap versus their own histories. Within this, European smaller companies are characterised by low starting valuations with the potential for superior long-term earnings growth. Some investors appear to be responding to this dynamic: the first week of March saw the largest inflow into European equities since February 2022, with $4.1bn invested. Meanwhile, the four weeks leading up to 5 March 2025 recorded total inflows of $12bn into European equities, the highest level since August 2015. MTE’s manager thinks that this not only reflects the valuation opportunity presented by European equites but also the increased risks presented by US assets, which it thinks enhances the relative appeal of European equities.
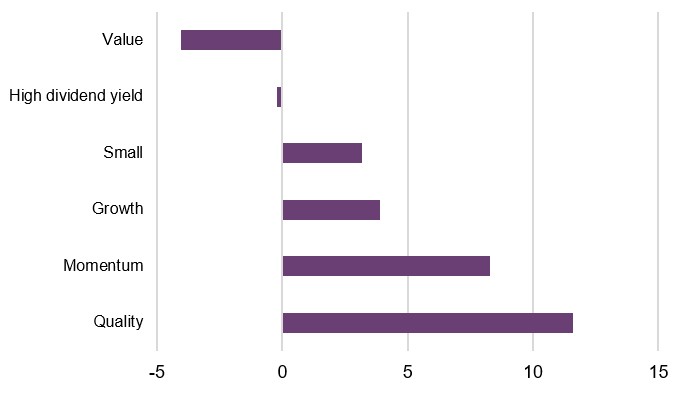
European small caps have reached a relative valuation discount (compared to their large-cap peers) not seen since the 2008 financial crisis, as shown in Figure 2. Not only is their current forward P/E more than two standard deviations below their 20-year average – which would be considered statistically anomalous – but the past two years mark the only sustained period (i.e. more than 12 months) in which European small caps have traded on a lower forward P/E than the broader European equity market.
Figure 2: Europe ex-UK Small vs market 12 month forward PE
Source: Montanaro. Indices used are MSCI Europe ex-UK Small and MSCI Europe ex UK
MTE’s manager thinks that the fundamentals underpinning European small caps have not deteriorated to an extent that would justify the current valuation gap. Although they trade on a slightly higher P/E ratio, European small caps offer superior earnings per share and are expected to deliver higher earnings growth in 2025, as shown in Figure 3, it notes.
Figure 3: MSCI Europe ex UK small cap versus market fundamentals
| P/E Ratio | P/B ratio | Dividend Yield (%) | EPS | 12m EPS growth est* (%) | |
|---|---|---|---|---|---|
| MSCI Europe Ex UK Small cap | 17.8 | 1.6 | 3.5 | 34.2 | 18.4 |
| MSCI Europe ex UK | 16.2 | 2.2 | 3.1 | 13.4 | 1.4 |
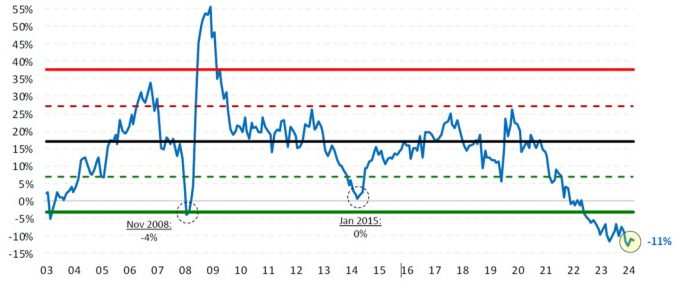
The performance of European small cap growth stocks has reached an unusually wide gap
European smaller companies with a growth bias may offer an attractive entry point at present. As illustrated in Figure 4, the relative performance of growth versus value within this segment has reached an uncommonly large gap. Over the past year, growth stocks have lagged their value counterparts by around 7% – a divergence that is roughly one deviation from the long-term average. Historically, such levels of underperformance have been followed by period of mean reversion in favour of growth. The main recent exception was in 2022, following the sharp rally in growth stocks during the post-COVID recovery.
Figure 4: Relative 12-month performance of MSCI Europe ex UK Small cap growth vs value
Source: Morningstar. Data as of 31 May 2025. All figures reflect 12 months of returns, sampled weekly.
How MTE finds its ideal company
Simple, niche, market leaders with high and sustainable returns, profitable and with good management
George avoids trying to time macroeconomic shifts, preferring to focus on the long term. He wants to invest in:
- straightforward businesses that he can understand;
- niche businesses in growth markets (non-cyclical companies, growing organically rather than businesses that tend to focus on acquisitions);
- market leaders (those with established market positions and pricing power);
- companies with high operating margins and high returns on capital (indicative of barriers to entry or a durable competitive position);
- profitable companies trading at sensible valuations; and
- good management that he trusts (he considers to be aligned with shareholders and demonstrating sound ESG practices).
This could be summed up as investing in high-quality businesses at sensible prices. Furthermore, George and the wider MAML team emphasise the following principles:
- do the work yourself (rather than relying on brokers);
- be passionate; and
- learn from mistakes (humility goes a long way).
MAML believes it is easier to add value through stock selection for a small-cap portfolio
In addition, MAML believes that it is easier to add value through stock selection for a small-cap portfolio, especially given the comparatively limited research coverage available on these companies. MAML observes that some large companies are covered by 50 or more brokers, while many European smaller companies have little or no coverage.
Asset allocation
Figure 5: Sector allocation as at 30 April 2025
Figure 6: Country allocation as at 30 April 2025
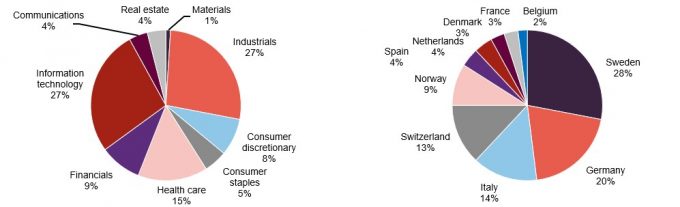
Source: MAML
Source: MAML
There were 48 holdings in the portfolio at the end of April 2025, a slight decrease from the 50 recorded in our previous note, which used data as of July 2024. Gearing has increased slightly, up to 2.7% from the 1.9% reported in our last publication. MTE’s manager reiterates that the level of gearing reflects the stock-specific opportunities identified by the team, rather than any reaction to the broader macroeconomic environment.
MTE’s portfolio has seen little turnover over 2024
Geographic and sector allocations continue to be driven by stock selection. MTE maintains its overweight positions in healthcare and technology relative to its benchmark, reflecting George’s preference for “quality growth” companies – which are associated with characteristics such as relative resilience to economic cycles, higher growth expectations, and stronger projected cash flows. In contrast, MTE retains underweight positions in sectors less aligned with this investment style, such as energy, utilities, and financials – industries that tend to be more cyclical and offer fewer long-term structural growth drivers.
One notable portfolio change over the period has been a 6% reduction in technology exposure, attributed to trading activity with two software companies – Fortnox and Esker – being sold down (as discussed in more detail on page 14).
As a reminder, George typically holds companies through periods of market cyclicality or market dislocations, opting to sell only when a company reaches his forecasted valuation or when a company-specific issue arises that could hinder its long-term return potential. He says that he rarely exits positions due to macroeconomic shifts or changes in market sentiment.
Portfolio characteristics
MTE continues to demonstrate the kind of characteristics that are often associated with high-quality, high-growth portfolios that it had in our prior note, as illustrated in Figure 7 (MAML data). On MAML’s numbers, the average balance sheet metrics are expected to improve over 2025 (except for its return on equity, which is expected to remain constant). Improvements are also expected in both key “growth” metrics (as seen by the increase in revenue and earnings) and “quality” metrics (with higher margins and lower debt); although this is reflected in a higher P/E ratio.
Figure 7: Portfolio characteristics
| Ratios | 2025 (expected) | 2024 |
|---|---|---|
| Active share | 92.3% | 92.8% |
| Price/earnings | 24.5x | 22.5x |
| EPS growth | 14.9% | 12.6% |
| Revenue growth | 10% | 7% |
| EBIT Margin | 22% | 20% |
| Return on equity | 21% | 21% |
| Net Debt / EBITDA | (0.1) | 0.2 |
10 largest holdings
Three holdings have moved up into MTE’s top 10 since our last note: Belimo, Brunello Cucinelli and Plejd. These are not new positions, however, as they have historically been amongst MTE’s largest holdings. The three companies replaced are NCAB Group, Fortnox, and Esker. Fortnox and Esker were both sold during the period, with Esker exiting due to a takeover. We discuss these companies, as well as a selection of other recently initiated positions, below. Note that Plejd’s inclusion is a reflection of its strong performance, and that it is a notable contributor to MTE’s recent returns, described in page 16. Data from 2024 indicates that 2024 saw the lowest portfolio turnover in the last nine years, at only 8%; well below the 17% average over the same period.
Figure 8: 10 largest holdings as at 30 April 2025
| Holding 30 April 2025 (%) | Holding 30 June 2024 (%) | Change (%) | Country | Sector | |
|---|---|---|---|---|---|
| Kitron | 4.9 | 3.0 | 1.9 | Norway | Electronics manufacturing |
| VZ Holding | 4.6 | 3.3 | 1.3 | Switzerland | Financial consultant and wealth manager |
| ATOSS Software | 4.5 | 3.7 | 0.8 | Germany | Workforce management software |
| CTS Eventim | 4.4 | 4.0 | 0.4 | Germany | Ticketing and events |
| Plejd | 4.0 | 1.6 | 2.4 | Sweden | Smart lighting manufacturer |
| Belimo | 3.9 | 2.4 | 1.5 | Switzerland | ventilation and air conditioing |
| MTU Aero Engines | 3.9 | 4.6 | (0.7) | Germany | Aero engine manufacture |
| Reply | 3.5 | 3.0 | 0.5 | Italy | IT consulting, system integration, and digital services |
| Brunello Cucinelli | 2.9 | 2.7 | 0.2 | Italy | Luxury fashion brand |
| IMCD | 2.8 | 3.0 | (0.2) | Netherlands | Speciality chemicals and ingredients |
| Total | 39.4 | 37.1 | 2.4 |
Brunello Cucinelli
Figure 9: Brunello Cucinelli (EUR)
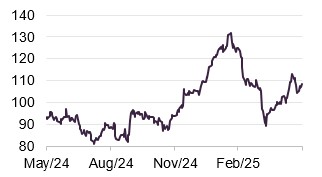
Source: Bloomberg
Brunello Cucinelli (www.brunellocucinelli.com) is an Italian luxury fashion brand. Although it offers a range of clothing and accessories, it is perhaps best known for its luxury cashmere products. The company also known for its ethical and sustainable business practices.
Brunello Cucinelli reported double-digit growth for 2024 and a positive outlook for 2025. Revenues increased 12.2% over 2024 to €1.3bn, and net income up 19.5% also, at €129m.This growth was generated from a diverse set of regions, with the Americas reporting 18% sales growth and Asia 13%, with sales split evenly between its women’s and men’s clothing lines. Its management expects this growth to continue, forecasting a c.10% revenue growth for both 2025 and 2026, while also retaining its current levels of profitability.
Brunello Cucinelli also made “significant investments” over the year, committing €110m to improving its brand, expanding its production capacity (which is based entirely in Italy), and increasing the number of retail stores. This includes a 10-year production expansion project (2024-2033), aimed at doubling the production of “highly artisanal and tailored products”.
Belimo
Figure 10: Belimo (CHF)
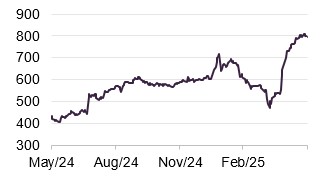
Source: Bloomberg
Belimo (www.belimo.com) is a Swiss designer and manufacturer of heating, ventilation, and air conditioning systems with a focus on damper actuators, control valves, sensors and meters.
Belimo’s inclusion in the top 10 is primarily the result of its share price growth over the past year, up c.44%, possibly reflecting the record results the company reported for 2024. Belimo reported record sales of 944m CHF, up 13.1% over its 2024 financial year. Belimo’s management attributes this growth to higher sales volumes, a strong suite of products, and pricing strategies that have offset detrimental foreign exchange movements. Outside of sales, Belimo has been able to increase its EBIT margin from 17.8% to 19.2%, and increase its free cash flow by 20%, to 133m CHF.
Demonstrating the international exposure of some European small caps, Belimo’s largest market has now become the Americas, after a 20% growth in demand. Its management highlight that a key driver behind its growth in America, and their global market, has been increasing servicing of data centres, with these facilities requiring significant air regulation. Belimo’s management expects that the data centre market will show the strongest growth across all regions in coming years, especially in the Asia-Pacific region. As a result, they expect that their sales growth in 2025 will be slightly above its five-year average of 9.8%, while still retaining an 18-20% margin.
IMCD
Figure 11: IMCD (EUR)
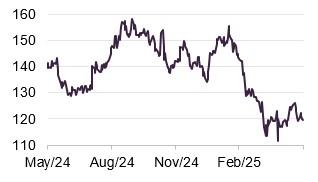
Source: Bloomberg
IMCD (www.imcdgroup.com) is a Netherlands headquartered chemicals and ingredients distributor. It operates through eight business groups, ranging from industrial solutions and construction materials to beauty and nutritional products.
IMCD faced a tougher operating environment in 2024. While revenues rose 6% year-over-year to €4.7bn, organic earnings declined 3% and net income dropped 5% to €278m. The primary drag on net income was the increase in interest expense that the company incurred to complete the 12 acquisitions it made during the period (at a cost of €300m), which was exacerbated by higher interest rates.
While IMCD’s management acknowledge the “challenging geopolitical and macroeconomic conditions, including increased volatility in customer demand” they were positive on IMCD’s “solid results and healthy cash flow”, with cash earnings remining largely flat over the period. IMCD’s challenges were primary experienced over Q1 2024, as it reported constant earnings growth in the subsequent three quarters – with the Asia Pacific region and its life sciences division being noted contributors to earnings growth.
IMCD reported continued growth into 2025 on a more positive note, reporting 9% revenue growth and 14% net income growth YoY, with the majority of this growth being organic, despite its ongoing acquisition activity. Despite the increased growth, listing on the Netherlands’ main market, and introduction of a new CEO, (the company veteran Marcus Jordan), the impact of Trump’s Tariffs seem to have weighed on its share price. With IMCD’s shares falling 18% YTD against a backdrop of what MTE’s manager describes as improving fundamentals.
Other purchases
The two noteworthy purchases made since our last publication are cBrain, a Danish software engineering firm focused on providing digitisation solutions for governments, and Swedencare, which makes pet healthcare supplements.
cBrain
Figure 12: cBrain (DKK)
Source: Bloomberg
cBrain (www.cbrain.com) aims to facilitate the digitisation of a range of government and educational agencies and universities, covering over 100 organisations across the world. Examples of its services include document management, auditing, and subsidy management. The majority of its revenues are derived from long-term contracts with Danish government customers. Whilst cBrain is a new holding for MTE, it has been on George’s buy list for the last eight years, and it was only with a previous market selloff that its valuation was considered sufficiently favourable for him to initiate a position.
cBrain has reported double-digit growth over 2024, reporting revenue growth of 12%, in line with its management’s expectations for the year. Similarly, its EBIT margin came in at 32%, at the high end of the 30-32% range predicted by the company’s management. cBrain’s management noted that the shift towards off-the-shelf solutions by government agencies was a contributing factor for the company over the year, with cBrain completing the delivery of digital platforms for three new Danish ministries in just three weeks. Management cited this as an example of the relative efficiency of the company’s products, stating that the installation of traditional IT solutions takes years.
Looking forward, cBrain’s management forecast lower growth of 10-15% and margins of 18-23% over 2025, but it attributes this to planned investments to improve cBrain’s international expansion, a strategic priority for the company. cBrain’s management maintains a positive outlook, highlighting the combination of increased shifts to off-the-shelf solutions, and the shortage of skilled IT employees improving demand for its services.
Swedencare
Figure 13: Swedencare (SEK)
Source: Bloomberg
Swedencare (www.swedencare.com) is a Swedish pet healthcare company, primarily known for its range of pet health supplements. Whilst it produces a range of products, it is recognised for its range of animal dental hygiene solutions under the PlaqueOff brand. George increased his allocation to Swedencare, which has been a small holding for MTE previously.
2024 was Swedencare’s highest-reported sales year to date, during which it reported its highest-ever sales, up 9% to 2.5bn SEK. Its profits also increased, with EBIT increasing 15% to SEK 476m (equal to a 19% margin). Swedencare’s reported earnings per share also saw a notable increase, up 68% to 0.62 SEK per share. The company’s growth was primarily driven by strong demand for its dental products, with sales up 43% over the year, and management noted that ProDen PlaqueOff was one of the fastest-growing brands globally, with its revenues increasing 676% over 2024.
Fortnox
Figure 14: Fortnox (SEK)
Source: Bloomberg
Fortnox (www.fortnox.se) is a Swedish cloud-based software company that provides financial and administrative solutions tailored for SMEs. The company’s share price is up 33% over the past 12 months, with George trimming part of the position on the basis of good portfolio management and valuation discipline.
George comments that Fortnox’s initial share price gains reflected the company’s continued growth, with it achieving several key milestones during 2024. This included surpassing SEK 2bn in net sales – an increase of 25% year-on-year. The company also completed a restructuring, shifting its focus from six business areas to two (business platforms and financial services), intended to enhance efficiency and align with growth objectives.
However, on 31 March 2025, First Kraft (Fortnox’s largest shareholder) and the private equity group EQT announced they were making a cash offer of SEK 90 per Fortnox share, a 38% premium to its undisturbed price of SEK 65.1 per share on 28 March. The offer values Fortnox at SEK 55bn and Fortnox’s board is recommending it to shareholders.
Disposals
Esker
Figure 15: Esker (EUR)
Source: Bloomberg
Esker (www.esker.com) is a French software developer of products designed to optimise ordering, payments, invoicing, and cash flows. In August 2024, a consortium made up of Bridgepoint (a British private equity firm), General Atlantic (a US private equity firm), and Esker’s management made a takeover offer for the company at €262 per share, a 30% premium to the undisturbed price of SEK 201.4 per share, valuing the business at €1.6bn.
When launching the offer, Bridgepoint stated Esker’s market leadership, cutting-edge products, and ability to thrive in a competitive environment as key attractions. General Atlantic also noted that Esker’s “mission-critical software enables its enterprise clients to streamline and automate corporate finance processes, delivering meaningful efficiency gains and cost savings and that the company is expected to benefit from structural trends and market expansion.
Performance
George has added value as an active investment manager
Over the past five years, MTE has generated a NAV total return that has underperformed its benchmark, the MSCI Europe ex UK Small Cap Index, by 3.5%. However, as shown in Figure 16, MTE recorded relative outperformance during the COVID-19 period, peaking at the end of 2021. This was a period of low interest rates along with a pandemic-driven acceleration of structural trends – factors that may have supported growth stocks globally.
MTE then surrendered much of this performance in the first half of 2022, as rising inflation and interest rate expectations appeared to trigger a sell-off in growth stocks, alongside a relative increase in interest in value-style investing.
George comments that his investment process remains focused on bottom-up stock selection, and this appears to be reflected in the attribution of MTE’s five-year returns – although style factors (i.e. MTE’s exposure to growth stocks) were the largest detractor, these were partially offset by positive stock selection.
MTE’s 10-year performance remains far ahead of its peers and benchmark
Over the past five years, the trust has delivered an average 12-month alpha and information ratio of 0.1, relative to its benchmark, based on weekly data, with positive alpha and information ratio observed in 59% and 58% of the 262 rolling periods, respectively.
When compared to the MSCI Europe ex UK Small Cap Growth Index, the average alpha and information ratio both remain at 0.1, but with less volatility in the numbers. In this comparison, MTE produced positive alpha and information ratio in 77% and 73% of the sampled periods, respectively.
Figure 16: MTE NAV total return performance relative to benchmark and listed peer group
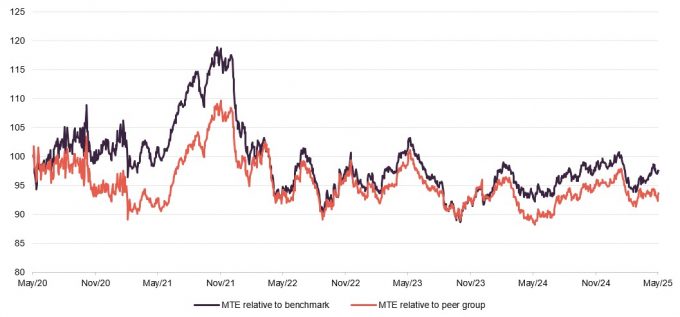
Source: Morningstar, Marten & Co. Note: MTE’s benchmark is the MSCI European Smaller Companies Index ex-UK. Listed peer group is European Assets, JPMorgan European Discovery, and The European Smaller Companies Trust.
As is illustrated in both Figures 16 and 17, MTE has underperformed its peers over the last five years, a period where its strong biases to both quality and growth seem to have worked against it. MTE has both the highest bias towards growth in its closed-end peer group and the strongest score for financial health (a proxy for quality – as it combines scores for ROIC, cash flow etc), according to Morningstar. However, MTE has outperformed the average of its open-ended peers over five years, and provided a return that is more than double that of the open-ended peer group average over 10 years.
Figure 17: Cumulative total returns for periods ending 31 May 2025
| 3 months(%) | 6 months(%) | 1 year(%) | 3 years(%) | 5 years(%) | 10 years (%) | |
|---|---|---|---|---|---|---|
| NAV | 10.0 | 13.5 | 11.2 | 20.1 | 49.9 | 230.9 |
| Share price | 11.6 | 24.1 | 19.6 | 25.5 | 52.4 | 248.4 |
| Benchmark1 | 7.6 | 14.3 | 5.5 | 16.4 | 53.6 | 136.1 |
| Listed peer group NAV average2 | 9.6 | 15.4 | 5.1 | 20.8 | 60.1 | 159.6 |
| Open-ended peer group average3 | 6.8 | 12.0 | 5.9 | 14.5 | 43.7 | 102.9 |
Whilst the last five years have been a challenging period for investors (COVID-19, the outbreak of war in Ukraine, rising inflation – particularly for energy costs and certain commodities, rising interest rates in response, and now Trump’s tariffs), MTE’s longer 10-year track records of outperformance against its benchmark, closed-ended peer group and open-ended peer group remain intact. Over the last decade, MTE has more than tripled the value of its NAV and share price in total return terms.
Top contributors and detractors
Figure 18 shows the top contributors and detractors to MTE’s 2024 returns. We cover the top three of each group below. Note that Esker has been covered already on page 17.
Figure 18: MTE top contributors and detractors for 2024
| Top contributors | returns over period % | % contribution | Top detractors | returns over period % | % contribution |
|---|---|---|---|---|---|
| MTU Aero Engines | 39.6 | 2.4 | Melexis | (36.9) | (1.2) |
| Esker | 56.2 | 1.6 | Amadeus Fire | (36.7) | (1.0) |
| Plejd | 105.2 | 1.3 | Tecan | (43.5) | (0.9) |
| VZ Holding | 41.2 | 1.3 | NCAB | (17.0) | (0.6) |
| CTS Eventim | 26.9 | 0.8 | Technoprobe | (36.5) | (0.6) |
MTU Aero Engines
Figure 19: MTU Aero Engines (EUR)

Source: Bloomberg
MTU Aero Engines (www.mtu.de) is a German aircraft engine manufacturer. MTE’s manager says that MTU’s share price gains have been a result of its financial performance over 2024.
In its most recent results, for its 2024 financial year (ending 31 December 2024) MTU reported earnings that surpassed internal forecasts, reporting revenues of €7.4bn, a 38.2% YoY increase. Profitability also improved, with MTU reporting an EBIT of 1.1bn, up 28.4% YoY and 5% ahead of its guidance figures.
MTU reported growth in both its commercial and military engine arms and its commercial maintenance arm. Its engine arm saw a 96.4% increase in revenue over the year, partly attributable to the lower base in the prior year (which were impaired by abnormal charge booked in 2023), though its maintenance arm remains the bulk source of its revenues, generating €5.1bn in sales over 2024 and up 19.9% YoY.
MTU’s management has provided guidance indicating continued growth expectations for 2025, forecasting revenues between €8.7bn and €8.9bn, a c.19% YoY growth, and c.15% EBIT growth, although it expects profit margins to be slightly below its 2024 level. MTU’s management has referenced capital investments made over 2024, with noteworthy mentions being a new production facility for disks in Munich, a new data centre, and a new development centre; as well as the structural drivers supporting air traffic growth, including an upward trend in passenger and cargo traffic, and supply chain issues requiring older aircraft to operate for longer (leading to higher maintenance demand).
Plejd
Figure 20: Plejd (SEK)
Source: Bloomberg
Plejd (www.plejd.com) is a Nordic smart product manufacturer, making products such as smart lighting and smart heating systems, which make it easier for residential homes to control indoor furnishings and utilities. Plejd’s share price more than doubled over 2024. This coincided with the release of strong quarterly results and followed a period of lower valuation at the end of 2023. Plejd shares continued to appreciate in 2025 and now trade at all-time highs (at time of writing), following the release of its 2024 full-year results.
Over 2024, Plejd reported a 29% increase in revenues YoY, with 662.3m SEK in sales. However, EBIT reached 134.5m SEK, up 126% YoY, with Plejd reporting an operating profit margin of 20.3%. Plejd’s management attributes its growth to several factors: significant organic growth in installation volumes, with installations up 36% in the fourth quarter of 2024 alone; successful international expansions, with management highlighting Plejd’s growth in the Netherlands – up 89% in Q4 2024; successful new product launches over 2024; and improved operation efficiency, with the cost base remaining relatively stable in comparison to rising revenues.
Plejd’s management has indicated expectations for further growth in 2025, noting that it again expects revenues to grow while its cost base remains stable, believing that the aforementioned trends of organic growth, international expansion, and demand for new products will once again drive growth in 2025. Plejd has also set aside additional capital for new investments in 2025.
Detractors
Figure 21: Melexis (EUR)

Source: Bloomberg
Melexis (www.melexis.com) is a Belgium-headquartered supplier of micro-electronic semiconductor solutions, with examples of its products including pressure sensors and fan and pump drivers. Melexis shares fell over 2024 – a period in which it experienced reduced demand in its end markets, especially the automobile sector. The market’s concerns appeared to be realised when Melexis’s management forecasted that Q4 sales would come in below expectations, with earnings impacted both by lower industrial demand but also the impact of high inventory levels.
Figure 22: Amadeus Fire (EUR)
Source: Bloomberg
Amadeus Fire (www.group.amadeus-fire.de) is a German specialist personal services firm for the commercial and IT sectors, composed of four different companies, its services range from staff training to specialist recruitment. Amadeus Fire’s share price declined consistently over 2024, and has remained broadly unchanged over 2025. This de-rating would appear to reflect the difficulties facing the German staffing sector, with demand for employee solutions falling in the face of increased near-term economic uncertainty. These issues forced Amadeus Fire’s management to cut its full-year forecasts in October 2024, with EBITA expected to be c.15% lower than initially expected.
Figure 23: Tecan (CHF)
Source: Bloomberg
Tecan (www.tecan.com) is a Swiss firm which provides laboratory instruments and solutions for a range of needs, servicing end markets such as forensics and pharmaceutical research. Tecan’s share price has been on a broad declining trend since the second quarter of 2024, coinciding with reported pressure on earnings. Tecan lowered its 2024 guidance after reporting a slower recovery from its life sciences business than expected – with the level of the cut being more than was expected by the market, according to MTE’s manager. Having initially expected low-single-digit sales growth, in August 2024 Tecan’s management changed its projections to a flat or mid-single-digit fall in sales. Having announced its full-year results in March 2025, its revenues came in line with analyst estimates; however, its earnings per share missed analyst estimates by 12%.
Peer group
MTE is a member of the AIC’s European Smaller Companies sector, which includes three other trusts: European Assets Trust, JPMorgan European Discovery Trust, and The European Smaller Companies Trust.
MTE has underperformed the peer group median over the last five years, although – as we discussed on page 16 – this can be explained by its strong bias to growth stocks (the highest in the peer group, according to Morningstar data), which appears to have been a headwind during a period of elevated inflation and rising interest rates
Figure 24: Listed European smaller companies peer group NAV total return performance over periods ending 30 April 2025
| 3 months(%) | 6 months(%) | 1 year(%) | 3 years(%) | 5 years(%) | |
|---|---|---|---|---|---|
| MTE | 10.0 | 13.5 | 11.2 | 20.1 | 49.9 |
| European Assets Trust | 5.9 | 8.8 | 1.1 | 11.5 | 27.3 |
| JPMorgan European Discovery Trust | 13.3 | 20.4 | 13.4 | 24.8 | 60.5 |
| The European Smaller Companies Trust | 9.1 | 16.1 | 1.6 | 24.3 | 92.5 |
| Peer group median | 9.5 | 14.8 | 6.4 | 22.2 | 55.2 |
| MTE rank | 2/4 | 3/4 | 2/4 | 3/4 | 3/4 |
As shown in Figure 25, MTE has the smallest market cap of its peers, though its assets appear to be of a sufficient size that this should no significantly limit demand for its shares. MTE also has the lowest yield of its peers, which is consistent with its portfolio’s greater allocation to companies with higher growth characteristics that typically pay lower dividends.
MTE’s discount is the narrowest in its peer group, though it also sits close to the peer group average as the range of discounts within the peer is relatively narrow. MTE’s ongoing charges ratio also sits close to the peer group median, despite its smaller-than-average size, though this figure does not yet reflect the forthcoming reduction in its management fee (of 0.075%), which MTE’s board expects will bring the trust’s OCR closer to the peer group average.
Figure 25: Listed UK smaller companies funds, comparison as at 03 June 2025
| Market cap(£m) | Discount(%) | Dividend yield(%) | Ongoing charge(%) | |
|---|---|---|---|---|
| MTE | 276 | (7.1) | 0.7 | 1.00 |
| European Assets Trust | 312 | (11.7) | 6.4 | 1.01 |
| JPMorgan European Discovery Trust | 532 | (7.2) | 1.9 | 0.92 |
| The European Smaller Companies Trust | 544 | (6.9) | 2.5 | 0.67 |
| Peer group median | 422 | (7.2) | 2.2 | 0.96 |
| MTE rank | 4/4 | 1/4 | 4/4 | 3/4 |
Dividend
MTE’s primary aim is to deliver capital growth to its shareholders, and the level of revenue income received is a byproduct of the manager’s stock selection decisions, rather than a target, and so can vary significantly over time. However, MTE has an emphasis on companies with consistent cash generation and dividend payments, and is able to offer a stated yield of 0.7% as of 31 May 2024.
Figure 26: MTE dividend history, accounting years ended 31 March
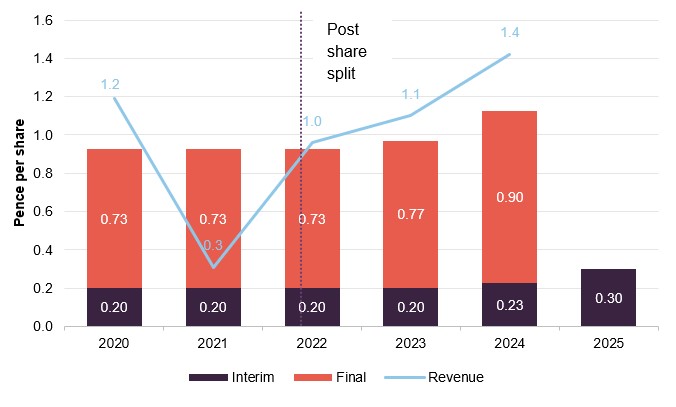
Source: MAML, Marten & Co. NB Figures prior to 2022 have been adjusted to reflect a 10×1 subdivision of MTE’s shares
MTE has a substantial revenue reserve and was able to cover its 2024 dividend 2.1 times, based on its year-end data, attributed to dividend growth from portfolio holdings.
As per its half-year report (ending 30 September 2024), MTE’s board paid an interim dividend of 0.3p per share for the first half of its 2025 financial year – a 30% increase YoY. MTE also reported an increase in revenues received over the six-month period (up 13% to 1.56p per share). The increased interim dividend reflects both the timing of revenue receipts and a decision to achieve a more even distribution between interim and final dividends.
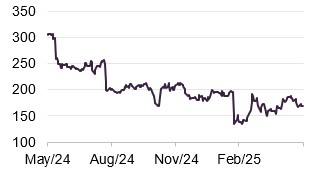
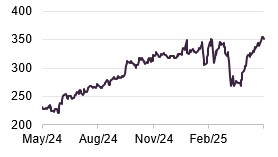
Premium/(discount)
Over the 12 months to the end of May 2025, MTE’s shares traded within a range of a 15.2% discount to a 6.2% discount and an average discount of 11.0%. At 31 May 2025, the shares were trading at a discount of 6.9%.
Figure 27: MTE discount over five years ending 31 May 2025
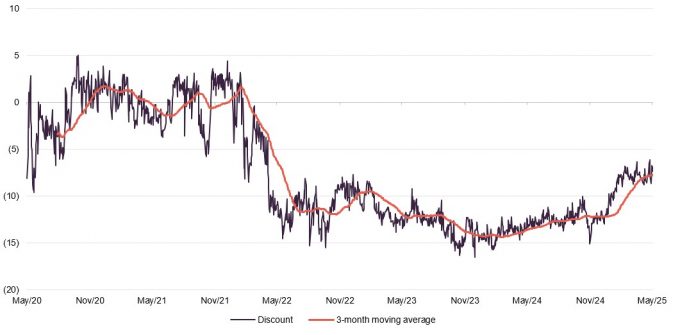
Source: Morningstar, Marten & Co
MTE’s discount has narrowed since the end of November 2024. This could partly reflect broader trends that suggest renewed demand for European equities, as discussed on page 7. The board has also been active in buying back MTE’s shares, having repurchased 17.1m shares (equivalent to 10% of the current circulation) since the beginning of 2025. Another contributing factor may have been purchases by Saba Capital, which acquired approximately 13% of MTE’s shares during the latter part of 2024 and early 2025. However, Saba has since begun to reduce its holding and now owns approximately 9% of the trust (at the time of writing).
MTE’s discount has narrowed over 2025, now trading on a single digit discount
While recent, the board’s value-related measures announced on 27 March 2025 (including six-monthly tender offers of up to 5% of NAV at a 5% discount to NAV, a reduction in the management fee and the decision to defend a single digit discount – all outlined on page 4), appear to have contributed to a marked adjustment in MTE’s discount level.
MTE has powers to issue and buyback shares, which it renews regularly at the AGM. Shares repurchased can be held in treasury and may be reissued. The board has said that these would only be reissued at a higher absolute price than the weighted average purchase price of the shares in treasury, and at a premium to NAV at the time of reissue or at a discount, provided the discount is narrower than the weighted average discount at which the shares were repurchased.
The net effect of this should be that purchasing the shares and reissuing them again is profitable for ongoing shareholders. In addition, the board encourages the manager to market the company to new investors.
Previous notes
Readers interested in further information about MTE may wish to read our other notes. Click the links in the table below or visit the QuotedData website.
| Note | Date published | Note type |
|---|---|---|
| Quality businesses at sensible prices | March 2019 | Initiation |
| Focus on the small picture | September 2019 | Update |
| Impressive returns in difficult market | October 2020 | Annual overview |
| Unfazed by market turmoil | March 2022 | Annual overview |
| No Continental drift | August 2023 | Annual overview |
| Primed for ignition? | August 2024 | Annual overview |
IMPORTANT INFORMATION
Marten & Co (which is authorised and regulated by the Financial Conduct Authority) was paid to produce this note on Montanaro European Smaller Companies Investment Trust Plc.
This note is for information purposes only and is not intended to encourage the reader to deal in the security or securities mentioned within it. Marten & Co is not authorised to give advice to retail clients. The research does not have regard to the specific investment objectives financial situation and needs of any specific person who may receive it.
The analysts who prepared this note are not constrained from dealing ahead of it but, in practice, and in accordance with our internal code of good conduct, will refrain from doing so for the period from which they first obtained the information necessary to prepare the note until one month after the note’s publication. Nevertheless, they may have an interest in any of the securities mentioned within this note.
This note has been compiled from publicly available information. This note is not directed at any person in any jurisdiction where (by reason of that person’s nationality, residence or otherwise) the publication or availability of this note is prohibited.
Accuracy of Content: Whilst Marten & Co uses reasonable efforts to obtain information from sources which we believe to be reliable and to ensure that the information in this note is up to date and accurate, we make no representation or warranty that the information contained in this note is accurate, reliable or complete. The information contained in this note is provided by Marten & Co for personal use and information purposes generally. You are solely liable for any use you may make of this information. The information is inherently subject to change without notice and may become outdated. You, therefore, should verify any information obtained from this note before you use it.
No Advice: Nothing contained in this note constitutes or should be construed to constitute investment, legal, tax or other advice.
No Representation or Warranty: No representation, warranty or guarantee of any kind, express or implied is given by Marten & Co in respect of any information contained on this note.
Exclusion of Liability: To the fullest extent allowed by law, Marten & Co shall not be liable for any direct or indirect losses, damages, costs or expenses incurred or suffered by you arising out or in connection with the access to, use of or reliance on any information contained on this note. In no circumstance shall Marten & Co and its employees have any liability for consequential or special damages.
Governing Law and Jurisdiction: These terms and conditions and all matters connected with them, are governed by the laws of England and Wales and shall be subject to the exclusive jurisdiction of the English courts. If you access this note from outside the UK, you are responsible for ensuring compliance with any local laws relating to access.
No information contained in this note shall form the basis of, or be relied upon in connection with, any offer or commitment whatsoever in any jurisdiction.
Investment Performance Information: Please remember that past performance is not necessarily a guide to the future and that the value of shares and the income from them can go down as well as up. Exchange rates may also cause the value of underlying overseas investments to go down as well as up. Marten & Co may write on companies that use gearing in a number of forms that can increase volatility and, in some cases, to a complete loss of an investment.