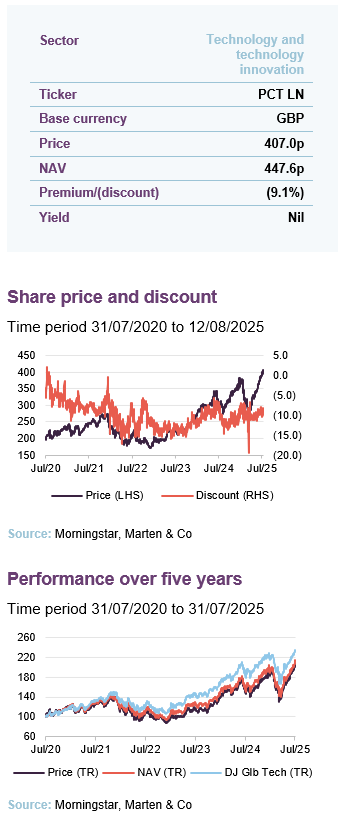
AI of the tiger
Polar Capital Technology’s (PCT’s) underweight positions in Apple and Alphabet have paid off handsomely in recent months – with the share price of both stalling on fears of their vulnerability in the AI race. This points to the increasingly evident merits of an active approach to investing in AI. History suggests that not only will incumbents fall by the wayside and new entrants emerge as AI innovation explodes, but the sector will experience bouts of volatility, with inevitable bumps along the road. What seems certain is the all-encompassing potential of AI to change the world. In this context, backing a manager with the requisite skillset and experience seems of paramount importance.
In our view, PCT is the premier manager for the job, with one of the largest teams dedicated to the sector in Europe and the conviction of its investment philosophy. As the appeal of PCT’s active approach is recognised (having comprehensively outperformed its Dow Jones Global Technology benchmark over the past 12 months), this should manifest in a tighter discount.
Global growth from tech portfolio
PCT aims to maximise long-term capital growth through investing in a diversified portfolio of technology companies around the world, diversified across both regions and sectors within the overall investment objective to reduce investment risk.
| Year ended | Share price TR (%) | NAV total return (%) | DJ Global Tech TR (%) | MSCI ACWI TR (%) |
MSCI UK TR (%) |
|---|---|---|---|---|---|
| 31/07/2021 | 24.8 | 27.2 | 31.7 | 25.7 | 23.3 |
| 31/07/2022 | (12.1) | (11.7) | (5.8) | 2.3 | 12.7 |
| 31/07/2023 | 8.2 | 14.1 | 19.1 | 6.8 | 6.8 |
| 31/07/2024 | 33.3 | 28.4 | 31.6 | 17.2 | 13.5 |
| 31/07/2025 | 30.3 | 30.2 | 20.5 | 12.5 | 12.7 |
Market overview
The pace of AI innovation and adoption is soaring at a rapid rate. The sheer speed and scale of advancement has increased the likelihood of high-profile incumbent casualties and new entrants emerging seemingly out of nowhere. It is with this backdrop that investing in AI through an expert active manager like PCT is the ideal way to access the potentially exponential returns that AI presents, and avoid some of the potentially large drawdowns.
DeepSeek release an important new point on the AI cost curve
The DeepSeek announcement at the beginning of the year served as a cautionary tale of the sudden shocks that are likely to be thrown up in the AI story. Around $1trn was wiped off the value of US tech firms following the announcement, but many have since recovered. As it happens, the DeepSeek model R1 that was supposedly trained on a fraction of the cost ($6m versus hundreds of millions) was just an important new point on the AI cost curve, as shown in Figure 1. Inference costs are falling at a rapid rate of around 40x per year for higher sophisticated models. PCT’s manager says that the collapsing cost of intelligence is a prerequisite for broader AI adoption.
Figure 1: Cost of cheapest LLM per million tokens by MMLU1

Source: a16z, Bain & Company. Notes: Massive multitask language understanding (MMLU) measures how well a large language model (LLM) understands language and solves problems, with results reported by model providers or through external evaluations. MMLU > 83 and 42 are performance benchmarks, with higher being better.
Hyperscalers’ reaction to increase capex gave market confidence
What was more significant in the DeepSeek announcement was the reaction of the hyperscalers – those with a greater degree of foresight into product pipelines. Capex expectations from the four largest US cloud service providers – Amazon Web Services (AWS), Microsoft Azure, Google Cloud Platform, and Meta – all increased since the DeepSeek announcement (see page 5 for further detail). PCT’s manager and the market took great comfort from this, and concluded that the prevailing narrative that you need more chips, more compute, and more networking has not been challenged.
It does highlight that investing in AI has perhaps become more complex post-DeepSeek, making the case for PCT’s expert active management approach as strong as it has ever been.
Weak macro should not derail AI growth
Weakening macroeconomic conditions, with the Federal Reserve (Fed) taking a hawkish tone at its recent meeting, the US labour market cooling, and new tariffs on key US trading partners put a damper on equity markets around the world at the start of August. Prior to this, markets had defied macro uncertainty to reach all-time highs, with technology – and specifically AI – leading the way, as shown in Figures 2 and 3.
Figure 2: Dow Jones Global Technology Index1
Figure 3: Dow Jones Global Technology index relative to MSCI ACWI1

Source: Morningstar, Marten & Co. Note 1) Rebased to 100 from 31 July 2022.
Source: Morningstar, Marten & Co. Note 1) Rebased to 100 from 31 July 2022.
Several macro events have the potential to upset the apple cart and see markets reverse their gains since April’s “Liberation Day” collapse. Any worries have so far been shrugged off by markets. However, geopolitical tensions persist, including in the Middle East and Taiwan. Meanwhile Trump’s “One Big Beautiful Bill” could see national debt skyrocket from already historic highs, and “reciprocal” new tariffs are expected to negatively impact economic growth with a one-time jump in inflation, a weakened jobs market, and tempered investment.
PCT’s manager believes the weak macro will not prohibit rapid AI improvement
The strength of the AI opportunity set means that when analysing macro events, PCT’s manager says that its main consideration is whether the macro is going to be bad enough to derail the AI story. It has concluded that, for now, the answer is no. Uncertainty in the economy is starting to be reflected in the data (with the labour market particularly weak), but it believes that this will not prohibit the continued rapid improvement in AI models.
A deep recession in the US could be sufficiently bad that it puts a temporary bump in road of the AI growth trajectory. But the manager says that it is in policymakers’ interest and capacity to prevent it.
Runaway tr-AI-n
Progression across all facets of AI has been impressive and exceeded PCT’s manager’s already-high expectations. As mentioned earlier, AI infrastructure capex has increased meaningfully, which has been driven by a surge in usage and adoption rates. Meanwhile, innovation and capability improvements of the latest models have been striking.
Capex
US cloud giants forecast to grow capex by 20% in 2026
The four largest US cloud service providers are deploying capital increasingly aggressively, with Goldman Sachs expecting their combined spend between 2025 and 2027 to be $1.15trn compared to $447bn in 2022-24. Another forecast by JP Morgan put their capex growth in 2026 at 20% versus 2025.
Global IT spending increased 7.7% to $5.1trn in 2024, according to Gartner, which raised its IT budget forecast for 2025 to $5.6trn, a 9.8% year-on-year increase, marking the strongest back-to-back increase in annual IT spending since the mid-1990s.
Figure 4: Global IT spending forecast
| 2024 spend ($bn) |
2024 growth (%) | 2025 spend ($bn) | 2025 growth (%) | |
|---|---|---|---|---|
| Data centre systems | 329.1 | 39.4 | 405.5 | 23.2 |
| Devices | 734.2 | 6.0 | 810.2 | 10.4 |
| Software | 1,091.6 | 12.0 | 1,246.8 | 14.2 |
| IT services | 1,588.1 | 5.6 | 1,731.5 | 9.0 |
| Communications services |
1,371.8 | 2.3 | 1,423.7 | 3.8 |
| Total | 5,114.8 | 7.7 | 5,617.8 | 9.8 |
Non-technology AI infrastructure spend is witnessing the fastest rate of growth, with data centre spend up almost 40% in 2024. As shown in Figure 4, data centre spending is expected to grow another 23.2% this year.
Capex beginning to translate into earnings growth
Recent quarterly results showed positive signs that the large sums invested in AI were boosting earnings among the big tech companies. Microsoft, Meta and Alphabet all posted double-digit increases in revenue and net income – driven by higher cloud revenues and sales of AI services. Amazon was the outlier. Despite beating financial estimates, momentum in AWS was behind the faster growth witnessed at Microsoft Azure and Google Cloud. OpenAI recently revealed that its ARR was $10bn, an astonishingly high number just two-and-a-half years since launching ChatGPT and before it has fully executed a plan to monetise the product.
Adoption
Heightened capex has been in response to the pace of usage and adoption of AI. All the data points to an accelerating consumption trend, with Google reporting that Gemini processed 480trn tokens (units of data processed by AI models) in April 2025 compared to April 2024, a 50-fold increase. Meanwhile, Microsoft saw 100trn tokens consumed in the first quarter of 2025, of which 50trn occurred in March alone.
Inflection point in AI adoption among corporates
A significant inflection in AI adoption among US businesses has also been witnessed this year. In May 2025, 42% of companies had paid subscriptions to AI models, platforms and tools, compared to 26% at the end of 2024 and just 17% in January 2024 according to Ramp (a US-based corporate card and bill payment provider that releases an AI Index each month to measure the adoption of AI products across 30,000 businesses).
Figure 5: Companies that use AI in at least one business function (%)

Source: McKinsey Global Surveys on the state of AI, 1,491 participants, July 2024
The latest McKinsey & Company survey into the corporate use of AI, displayed in Figure 5, found that 78% of responding organisations use AI in at least one business function, up from 72% in early 2024 and 55% a year earlier. Meanwhile, a further study by Menlo Ventures in June 2025 found that 61% of US adults had used AI in the past six months and 19% interact with AI on a daily basis.
Innovation
Scaling of AI performance vastly eclipsing Moore’s Law
The scaling of performance of the latest AI models is impressive and suggests the capabilities of AI are already at levels that make its ability to replace or supplant some human tasks a near-term reality. OpenAI’s o1 model, for example, achieved a score of 83% in the International Mathematics Olympiad, compared to 13% by GPT-4o. The o3 model solved c.25% of problems on a Frontier Maths benchmark, where no previous AI model achieved more than 2%. The o3 model also achieved 76%-88% on the ARC-AGI benchmark (a benchmark that evaluates AI through abstract reasoning capabilities and measures progress towards general intelligence) versus GPT-4o at around 5%. However, this required 2,000x more compute.
It was a similar story with the recent launch of xAI’s Grok 4 model in July, which demonstrated significant advancements in reasoning and performance on complex tasks compared to Grok 3, which itself was only released in February 2025. OpenAI launched ChatGPT-5 this month and new frontier models from Google, Anthropic and others are due to be launched in the near future.
AI is scaling at an estimated 0.6-1.0x order of magnitude (OOM) every year, according to the manager, beyond that of Moore’s Law of scaling (the generally accepted guiding principle for the semiconductor industry), which improves at a rate of 1-1.5x OOM per decade.
Advancements have led to generative AI (creating new content); agentic AI (systems that can operate with autonomy to make decisions and take actions without human intervention); and, according to OpenAI’s CEO, Sam Altman, a substantially shortened the timeline to artificial general intelligence (AGI – AI with human-level general intelligence, capable of performing any intellectual task at least as well as a human can).
PCT’s manager believes that the scaling rate will remain strong for the foreseeable future, with kinks in some models ironed out and growth in use cases allowing penetration into new markets. At some point, however, scaling will have to slow, but for now that point is some way off.
New conduits for AI
Broadening of AI ‘winners’ expected, with power and networking beneficiaries
For so long, the so-called Magnificent Seven (Mag7) stocks – Microsoft, Apple, Amazon, Alphabet, Meta, Nvidia and Tesla – dominated markets and were synonymous with the AI growth story. That got cut to four as Tesla dropped out and Apple and Alphabet lost momentum in the AI race (both are large underweights in PCT’s portfolio, which we explore in further detail from page 10). PCT’s manager believes that the Mag7 is no longer the perfect conduit for AI and has also frequently pointed out that new entrants and a broadening out of AI “winners” will take place as innovation progresses. Spending on AI is not necessarily a panacea, and existential questions are starting to be asked of the sector. It is no longer a case of just debates on valuation metrics, the manager says, but fundamental discussions on whether app software will exist in the same way in 10 years’ time as it has done for the last 30 years, or whether we go to a post-smartphone world? These are profound arguments that could see the current incumbents at risk of being on the wrong side – despite their increased R&D budgets.
History suggests that a broadening of the market is highly likely. PCT’s manager states that power and networking are central to the success of AI, and has therefore positioned its portfolio to this theme. A bear case for power does not exist, it insists. AI is additive to the pre-AI business of a power component.
Current estimates state that by 2028, data centres could consume up to 12% of projected US electricity use, as the hyperscalers scramble to acquire sites with readily available power. This has been the principal reason behind the recent share price performance of GE Vernova (PCT’s 12th-largest portfolio holding at 1.4% exposure), which is up 266% over 12 months.
Revenues at AI networking companies have also taken off, with Credo Technology recently reporting quarterly revenue growth of 180% year-on-year amid strong demand for its high-speed internet cables and a growing list of hyperscaler clients. Its networking peer, Ciena, also delivered revenues and guidance ahead of expectations and signed its first deal with a hyperscaler.
PCT’s manager expects further volatility
As new themes get pulled into the AI trade and others fall out, the manager believes that the sector is going to have bouts of volatility. This has already been seen this year with the DeepSeek announcement, and previously with NVIDIA’s Blackwell chip delay. Further interruptions in the AI story could come from disappointing data points or the introduction of new cheaper models that undermine hyperscaler capex. PCT’s manager believes there will be an amplification of negative data points from outside of the sector as people see it as a threat to jobs and livelihoods. The recent trajectory of AI-led outperformance may also moderate in the near term as companies strike a more conservative tone given macro and geopolitical uncertainties, but the manager expects any associated volatility or period of consolidation to be short-lived as the impact of AI becomes apparent.
Given these complexities in the market backdrop, we would argue that there has never been a better time for an active approach and expect to see a tightening of PCT’s discount as its expertise is recognised.
Asset allocation
At the end of June 2025, there were 97 stocks in PCT’s portfolio (down from 104 six months ago). The portfolio remains benchmark-aware to express the best that the index has to offer, and to help manage risk. The portfolio’s active share is as high at 48% as it has ever been, due to the manager’s larger individual stock bets.
The portfolio may be managed in a benchmark-aware style, but the manager is happy to have zero weightings in index names when he feels that their growth prospects do not merit their inclusion within the portfolio. Cash and equivalents, which includes puts on the Nasdaq, was 4.6% of the portfolio at the end of July.
Figure 6: Geographic exposure at 31 July 2025
Figure 7: Sector exposure at 31 July 2025
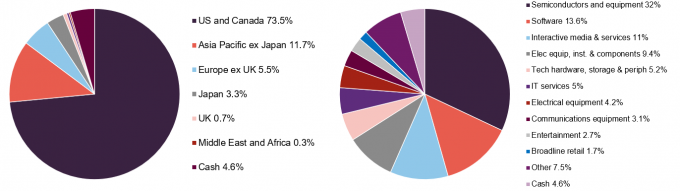
Source: Polar Capital Technology Trust, Marten & Co
Source: Polar Capital Technology Trust, Marten & Co
Ben does not try to add value through geographic asset allocation. However, PCT’s exposure to the US has grown substantially over the past 12 months and is not too dissimilar to the benchmark now. In Figure 7, the most significant change has been a dispersion of exposures reflecting the manager’s expectation of a broadening of AI winners across sectors, with weightings to the software and semiconductor sectors substantially reduced, and electrical equipment, instruments and components increased.
Top 10 holdings
There have been a couple of changes to the constituents of PCT’s top 10 holdings over the past six months. Advanced Micro Devices and Oracle have come in and Arista Networks and Amazon have gone out.
Figure 8: Profile of top 10 holdings at 31 July 2025
| Company | Country | Mkt cap ($bn)1 |
% of NAV 31/07/25 |
% of NAV 31/01/25 |
Change (%) |
|---|---|---|---|---|---|
| NVIDIA | US | 4,442 | 12.5 | 7.5 | 5.0 |
| Microsoft | US | 3,878 | 8.4 | 6.8 | 1.6 |
| Meta Platforms | US | 1,924 | 6.7 | 7.3 | (0.6) |
| Broadcom | US | 1,434 | 5.6 | 4.4 | 1.2 |
| Taiwan Semiconductor | Taiwan | 1,254 | 4.2 | 4.5 | (0.3) |
| Alphabet | US | 2,436 | 3.3 | 5.9 | (2.6) |
| Apple | US | 3,371 | 3.0 | 6.1 | (3.1) |
| Advanced Micro Devices | US | 280 | 2.7 | 0.7 | 2.0 |
| Oracle | US | 702 | 2.2 | 0.8 | 1.4 |
| Cloudflare | US | 71 | 1.9 | 2.2 | (0.3) |
| Total | 50.5 |
Figures 9 and 10 show PCT’s largest overweight and underweight exposures relative to the Dow Jones Global Technology Index at 30 June 2025.
Figure 9: 10 largest overweight exposures at 30 June 2025
| Company | Fund (%) | Index (%) | Active (%) |
|---|---|---|---|
| Cloudflare | 2.02 | 0.23 | 1.79 |
| Robinhood Markets | 1.71 | – | 1.71 |
| Advanced Micro Devices | 2.42 | 0.88 | 1.54 |
| Vertiv Holdings | 1.45 | – | 1.45 |
| Spotify Technology | 1.88 | 0.44 | 1.44 |
| Netflix | 1.28 | – | 1.28 |
| GE Vernova | 1.27 | – | 1.27 |
| CyberArk Software | 1.31 | 0.08 | 1.23 |
| Amazon | 1.22 | – | 1.22 |
| Elite Material | 1.09 | – | 1.09 |
Figure 10: 10 largest underweight exposures at 30 June 2025
| Company | Fund (%) | Index (%) | Active (%) |
|---|---|---|---|
| Apple | 3.36 | 11.73 | (8.37) |
| Microsoft | 8.08 | 14.15 | (6.07) |
| Alphabet | 2.93 | 7.11 | (4.18) |
| NVIDIA | 11.61 | 14.75 | (3.14) |
| Cisco Systems | – | 1.06 | (1.06) |
| Salesforce.com | – | 1.00 | (1.00) |
| Samsung Electronics | – | 0.93 | (0.93) |
| Intuit | – | 0.84 | (0.84) |
| IBM | 0.25 | 1.05 | (0.80) |
| Texas Instruments | – | 0.72 | (0.72) |
We have discussed Ben’s views on many of PCT’s largest holdings and over- and underweight exposures in previous notes (links to which can be found on page 15). Some noteworthy portfolio developments since our last note include Apple and Alphabet (positions in both are as low as they have ever been) and Oracle, which is a top 10 holding for the first time in a long time.
Apple
Figure 11: Apple

Source: Bloomberg
Apple has been PCT’s largest underweight position for a long time, and at the end of June was at 837bps, with PCT’s exposure to the company now just 3.0%. Apple’s share price performance (down 8.3% in the year-to-date) has been positive for PCT’s relative performance, and the manager’s conviction that Apple is a laggard in AI is as strong as ever. Its belief is born from the fact that it has been unable to deliver Apple Intelligence (its suite of AI features integrated into iOS 18 announced last year). That has not had so much of an impact on the financials of the business, but has certainly impacted the narrative around it – and this is the sort of disruption that PCT’s manager believes will occur across the tech sector.
Apple’s recent earnings update surprised the market with a 10% increase in revenue as iPhone sales remained resilient. The company also promised to spend more on AI, having botched the integration of it into devices so far. However, the company remains particularly exposed to punitive tariffs on China, Taiwan and India, which are cornerstones of its supply chain, and pressure from Trump to move more manufacturing to the US – at significant expense.
Alphabet
Figure 12: Alphabet

Source: Bloomberg
Another significant underweight position is Alphabet, the largest it has ever been for the trust at 418bps. This has paid off in recent relative performance, with Alphabet’s share price relatively flat in 2025. PCT’s manager states that the company is facing an existential challenge to its search business, Google. It is worried that Google is not picking up its share of the incremental traffic generated by AI, and that AI-generated search is going to overtake Google at some stage.
Figure 13: Search usage by format (%)

Source: Wells Fargo
This usage data is eye-opening, as revenue tends to follow usage with a lag. The business is not being directly impacted today in the financials as it remains a top platform for advertising spend. Whilst AI platforms such as OpenAI do not yet accommodate advertising, a large share of advertising spend could be diverted away from Google if that changes in the future.
Alphabet is also facing several regulatory issues, including losing three consecutive antitrust cases brought against its search, advertising and app store businesses, which may result in it having to sell its Chrome browser and share its index data with rivals.
PCT’s manager says that it is not prepared to throw in the towel just yet, citing the performance of its large language model, Gemini, the strong cloud business, and several other projects. However, it admits that it faces a challenge in managing the position.
Oracle
Figure 14: Oracle

Source: Bloomberg
Oracle had not featured in PCT’s portfolio for a long time, but the manager has bought back into the stock and believes it is one of the most interesting AI plays. The company had missed the software-as-a-service (SaaS) boom, forcing it to acquire its way into it, and has been a laggard in the cloud business too. It has, however, built an industry leading sovereign cloud business – which has proved invaluable over the last year as nations and regions build their own AI eco-system. A sovereign cloud prioritises data residency, compliance with local laws, and restricted access to data, ensuring national security, data privacy, and digital sovereignty initiatives. Trump’s aggressive, protectionist policy around AI and the importance of national security has added to the growth in sovereign AI. Oracle provides sovereign cloud regions for the US Department of Defense, UK government and defence, and the Australian government and defence. Having been a bit of a market pariah for a long time, PCT’s manager believes the company is now an AI winner. Oracle’s stock has repriced as such, up 80.4% since the end of April.
In its recent earnings update, Oracle’s FY26 and indicative FY27 guidance were ahead of expectations due to AI demand and it now expects the total cloud infrastructure growth rate to increase from 50% in FY25 to more than 70% in FY26. It also expects bookings to grow more than 100% in FY26.
Performance
Figure 15: PCT NAV total return relative to benchmark over five years ending 31 July 2025

Source: Morningstar, Marten & Co
Visit QuotedData.com for up-to-date information on PCT and its peer group
PCT’s underperformance of its Dow Jones Global Technology benchmark since early 2021 has largely been due to the effect of its largest underweight exposures – Apple, Microsoft, Alphabet and NVIDIA – performing strongly. PCT’s relative performance has ticked up over 2025 as its active positions in Apple and Alphabet pay off. PCT’s NAV returns has outperformed the benchmark in every period up to and including three years, as shown in Figure 16. This could be due to the spread in performance between the large-cap and small- and mid-cap technology companies narrowing as a broadening of performance plays out, which PCT’s manager expects to continue.
Figure 16: Cumulative total return performance to 31 July 2025
| 1 month (%) |
3 months (%) |
6 months (%) |
1 year (%) |
3 years (%) |
5 years (%) |
|
|---|---|---|---|---|---|---|
| PCT share price | 10.6 | 39.3 | 7.2 | 30.3 | 87.9 | 106.2 |
| PCT NAV | 9.6 | 36.1 | 9.8 | 30.2 | 90.7 | 114.1 |
| Benchmark | 8.0 | 27.1 | 6.2 | 20.5 | 88.8 | 134.1 |
| MSCI ACWI | 5.0 | 13.0 | 1.3 | 12.5 | 40.8 | 81.0 |
| MSCI UK | 4.4 | 7.8 | 7.3 | 12.7 | 36.6 | 89.9 |
Premium/discount
Over the 12 months to 31 July 2025, PCT traded between a discount of 6.7% and 19.4%. The average discount over this period was 10.5%. At 12 August 2025, PCT’s shares were trading at a discount of 9.1%. Given the manager’s skillset in identifying AI winners and losers and its active investment approach, this feels too wide.
Figure 17: Premium/(discount) over five years to end July 2025

Source: Morningstar, Marten & Co
Fund profile
More information can be found at the trust’s website: www.polarcapitaltechnology
trust.co.uk
PCT aims to maximise long-term capital growth through investing in a diversified portfolio of technology companies around the world, diversified across both regions and sectors. PCT launched as Henderson Technology Trust in December 1996 and, following a change of manager, became Polar Capital Technology Trust in April 2001.
Hear about the fund

Management arrangements
PCT’s AIFM is Polar Capital LLP and the lead manager assigned to the trust is Ben Rogoff, a partner in Polar Capital LLP. He is supported by a team of 11 technology specialists, including another partner, Nick Evans, and deputy fund manager Alastair Unwin. Polar believes that this is one of the best-resourced teams dedicated to this sector within Europe. In addition to PCT, the team also manages two open-ended funds, Polar Capital Global Technology Fund and the Artificial Intelligence Fund. Collectively, these funds had AUM of $15.3bn at 30 June 2025.
Ben joined the team from Aberdeen in 2003, having started his career in the years running up to the technology boom. The events surrounding the collapse of the tech bubble have influenced the way in which he manages money. One important lesson is that there is limited permanence in the technology sector; it is forever engaged in a process of creative disruption. Change in the sector is a non-linear process. Once-great companies can disappear and minnows can become giants.
Nick joined the team from Framlington in 2007. He complements Ben in that Nick has a more bottom-up approach to selecting stocks, whereas Ben has a bias to a top-down stance.
Hear about the manager

Previous publications
Readers interested in further information about PCT may wish to read our earlier notes. You can read them by clicking on the links below or by visiting our website.
Figure 18: QuotedData’s previously published notes on PCT
| Confidence building | Initiation | 12 May 2020 |
| More to go for | Update | 15 December 2020 |
| Exciting times | Annual overview | 7 July 2021 |
| Eyes on the prize | Update | 10 May 2022 |
| Jockeying for position | Annual overview | 8 December 2022 |
| Me, myself and AI | Update | 14 June 2023 |
| The AI’s have it | Annual overview | 9 January 2024 |
| AI caramba! | Update | 25 June 2024 |
| AI captain | Annual overview | 16 January 2025 |
IMPORTANT INFORMATION
This marketing communication has been prepared for Polar Capital Technology Trust Plc by Marten & Co (which is authorised and regulated by the Financial Conduct Authority) and is non-independent research as defined under Article 36 of the Commission Delegated Regulation (EU) 2017/565 of 25 April 2016 supplementing the Markets in Financial Instruments Directive (MIFID). It is intended for use by investment professionals as defined in article 19 (5) of the Financial Services Act 2000 (Financial Promotion) Order 2005. Marten & Co is not authorised to give advice to retail clients and, if you are not a professional investor, or in any other way are prohibited or restricted from receiving this information, you should disregard it. The note does not have regard to the specific investment objectives, financial situation and needs of any specific person who may receive it.
The note has not been prepared in accordance with legal requirements designed to promote the independence of investment research and as such is considered to be a marketing communication. The analysts who prepared this note are not constrained from dealing ahead of it, but in practice, and in accordance with our internal code of good conduct, will refrain from doing so for the period from which they first obtained the information necessary to prepare the note until one month after the note’s publication. Nevertheless, they may have an interest in any of the securities mentioned within this note.
This note has been compiled from publicly available information. This note is not directed at any person in any jurisdiction where (by reason of that person’s nationality, residence or otherwise) the publication or availability of this note is prohibited.
Accuracy of Content: Whilst Marten & Co uses reasonable efforts to obtain information from sources which we believe to be reliable and to ensure that the information in this note is up to date and accurate, we make no representation or warranty that the information contained in this note is accurate, reliable or complete. The information contained in this note is provided by Marten & Co for personal use and information purposes generally. You are solely liable for any use you may make of this information. The information is inherently subject to change without notice and may become outdated. You, therefore, should verify any information obtained from this note before you use it.
No Advice: Nothing contained in this note constitutes or should be construed to constitute investment, legal, tax or other advice.
No Representation or Warranty: No representation, warranty or guarantee of any kind, express or implied is given by Marten & Co in respect of any information contained on this note.
Exclusion of Liability: To the fullest extent allowed by law, Marten & Co shall not be liable for any direct or indirect losses, damages, costs or expenses incurred or suffered by you arising out or in connection with the access to, use of or reliance on any information contained on this note. In no circumstance shall Marten & Co and its employees have any liability for consequential or special damages.
Governing Law and Jurisdiction: These terms and conditions and all matters connected with them, are governed by the laws of England and Wales and shall be subject to the exclusive jurisdiction of the English courts. If you access this note from outside the UK, you are responsible for ensuring compliance with any local laws relating to access.
No information contained in this note shall form the basis of, or be relied upon in connection with, any offer or commitment whatsoever in any jurisdiction.
Investment Performance Information: Please remember that past performance is not necessarily a guide to the future and that the value of shares and the income from them can go down as well as up. Exchange rates may also cause the value of underlying overseas investments to go down as well as up. Marten & Co may write on companies that use gearing in a number of forms that can increase volatility and, in some cases, to a complete loss of an investment.