Residential rebound
In the year’s third quarter, US inflation continued to fall, forming a positive economic picture for the country, with strong wage growth and low unemployment. In the lead up to the Federal Reserve’s rate cut on 18 September, the first in four years, the technology sector underwent a sell-off that saw Nvidia’s share price fall 13% from its peak. Activist funds such as Elliot Management expressed their concerns of an AI bubble, contributing to a series of share price falls for the ‘Magnificent 7’ stocks. Smaller companies in the US seemed to benefit from the selloff, aided by rate cut expectations.
Sensitive to the Bank of England’s August rate cuts and aided by corporate activity, the UK’s property sectors enjoyed significant returns, particularly residential property. These gains were also supported by a generally improving post-election outlook.
The ongoing housing crisis and weakened demand that has troubled China’s economy for some years was met with a brief but strong rally following stimulus boosts by the government.
Japan’s third quarter was marked by significant growth in the yen against the dollar, alongside growing interest rates. What followed was dampening demand for its exports, yet the country’s consumer sentiment remained resilient.
The gold price continued to climb, but despite the broadening conflict in the Middle East, the oil price fell. In the US, Europe and UK, bond yields fell (prices rose), reflecting the moves in inflation and interest rates.
New research
So far in Q3, we have published notes on: Caledonia Investments, Foresight Environmental Infrastructure, AVI Japan Opportunity, GCP Infrastructure, Baillie Gifford UK Growth Trust, Seraphim Space Investment Trust, Rights and Issues Investment Trust, Montanaro European smaller companies, Geiger Counter Limited, Henderson High Income, Alliance Trust, Oakley Capital Investments, Gulf Investment Fund and JPMorgan Japanese Investment Trust.
At a glance
All investment companies median discount
After the discount narrowing of Q2, as the chart highlights, in Q3 discounts were contained within a narrower band (11.6%–13.2%). The median discount was 12.87% at the end of June and 12.54% on 30/09/24. The brief period of heightened volatility at the beginning of August coincided with the yen’s sharp rise, an unwinding of positions funded by borrowing in yen and a mini panic about the US economy which calmed down soon after.
Time period 30 September 2023 to 30 September 2024
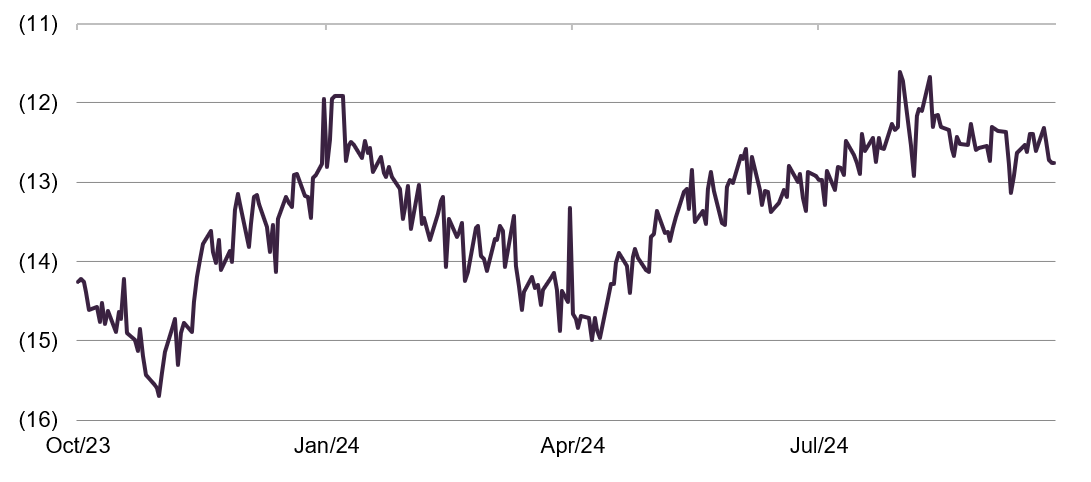
Source: Morningstar, Marten & Co
UK – commercial property median discount
Falling interest rates and a reasonably robust economy have been supporting a recovery in the property – UK commercial sector. However, the real driver of narrowing discounts has been corporate activity, with bids for a number of trusts including LXI REIT, UK Commercial Property, and Balanced Commercial Property, plus a wind down at abrdn Property Income.
Time period 30 September 2023 to 30 September 2024
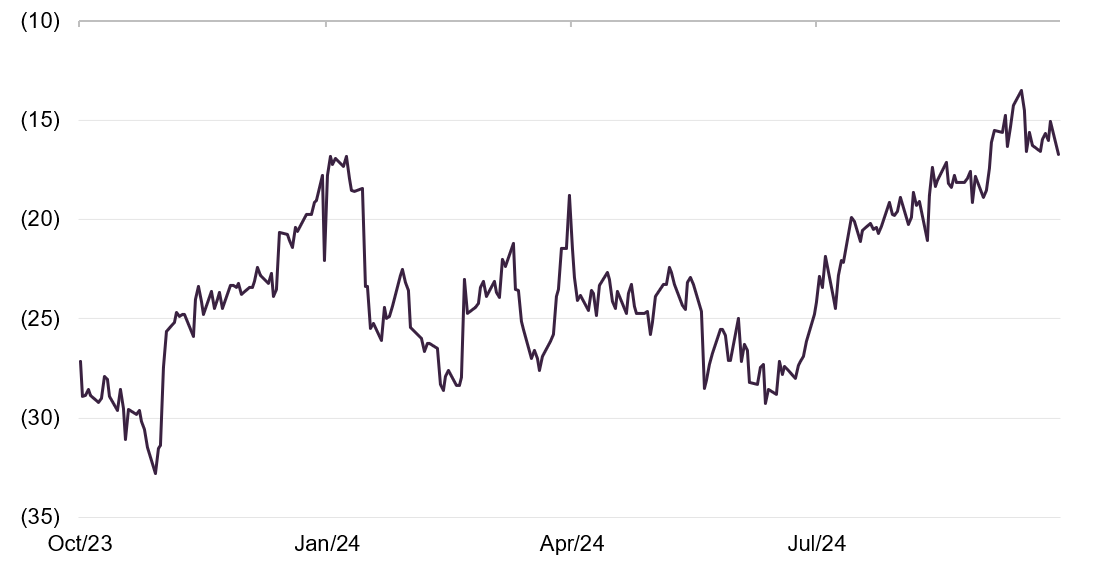
Source: Morningstar, Marten & Co
| 30 September 2024 | Change on quarter (%) | |
|---|---|---|
| Pound to US dollar | 1.3375 | 5.8 |
| Pound to Euro | 1.2012 | 1.8 |
| Oil (Brent, in dollars) | 71.77 | (16.9) |
| Gold (in dollars) | 2634.58 | 13.2 |
| US Treasuries (10-year yield) | 3.78 | (14.1) |
| UK Gilts (10-year yield) | 4.00 | (4.0) |
| German government bonds (bunds, 10-year yield) | 2.12 | (15.1) |
Source: Bloomberg
Winners and losers
Best performing sectors over Q3 2024 by total price return
| Median share price total return (%) |
Median NAV total return (%) |
Median discount 30/09/24 (%) |
Median sector market cap 30/09/24 (£m) |
Number of companies in the sector | |
|---|---|---|---|---|---|
| Leasing | 16.8 | 0.0 | (34.2) | 157 | 7 |
| Property – UK commercial | 16.1 | 1.6 | (16.7) | 220 | 11 |
| Property – UK healthcare | 13.0 | 1.4 | (21.9) | 470 | 2 |
| Property – Europe | 11.6 | 0.0 | (33.2) | 251 | 5 |
| China / Greater China | 10.1 | 14.3 | (13.1) | 197 | 4 |
Source: Morningstar, Marten & Co. Note: inclusive of sectors with at least two companies. Note: many alternative asset sector funds release NAV performance on a quarterly basis
Significant sales of aircraft made by Doric Nimrod funds upheld the Leasing sector’s lead at the top of the list.
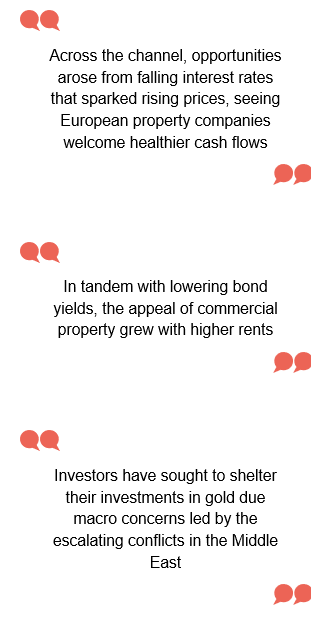
As mentioned, UK property sectors were some of the major beneficiaries of the Bank of England’s August rate cuts, given their pronounced sensitivity to loosening monetary policy. In tandem with lowering bond yields, the appeal of commercial property grew with higher rents. In the field of healthcare, evaluations of the sector’s structural conditions (growing demand) have corresponded with renewed interest. Across the channel, opportunities arose from falling interest rates that sparked rising prices, seeing European property companies welcome healthier cash flows.
Contrary to the pattern of recent years, Chinese equities were given a powerful uplift in the wake of government stimulus, including interest rate cuts. It is thought that this sudden interjection was an attempt by the CCP to fulfil its 5% annual growth target. In response, the CSI 300, the broad-based index of China’s largest companies, surged by 27% from its mid-September lows, only to fall back again as investors questioned the lasting impact of the stimulus.
Worst performing sectors over Q3 2024 by total price return
| Median share price total return (%) |
Median NAV total return (%) |
Median discount 30/09/24 (%) |
Median sector market cap 30/09/24 (£m) |
Number of companies in the sector | |
|---|---|---|---|---|---|
| Technology & technology innovation | (10.2) | (7.5) | (11.5) | 2,461 | 2 |
| Property – rest of World | (5.9) | 0.0 | (66.4) | 20 | 3 |
| Financials & financial innovation | (3.6) | 2.6 | (22.5) | 354 | 2 |
| Japan | (3.4) | (0.5) | (12.3) | 292 | 4 |
| Commodities & natural resources | (2.3) | (1.0) | (16.8) | 62 | 9 |
Source: Morningstar, Marten & Co. Note: inclusive of sectors with at least two companies. *many alternative asset sector funds release NAV performance on a quarterly basis
In terms of the worst performing sectors, technology funds with significant exposure to ‘the Magnificent 7’ were struck by a large selloff at the end of July, prompted by worries over high valuations and worse than expected quarterly results. For instance, the market capitalisations of Alphabet and Microsoft dropped by 6%, as investors took profits from stocks that had benefitted from the AI buzz.
A substantial part of the Property – rest of world sector’s performance was caused by Ceiba Investments’ exposure to macroeconomic elements specific to Cuba. This included the reduced numbers of Russian tourists due to the Ukraine war and ailing efforts from the government to reform the economy. Another fund, Macau Property Opportunities, experienced a fall in NAV, blaming the discounting of properties by local developers to improve their cash flows.
Japanese funds were hit as investors unwound trades financed by cheap yen in the wake of interest rates rises. A stronger yen was also seen as bad news for some of the country’s major exporters. In September, the country’s exports fell for the first time in ten months, due to a strengthened yen and less demand from neighbouring China amid its economic uncertainty. Whilst the price of gold rallied, China’s economic weakness negatively influenced the Commodities and natural resources sector, although the stimulus provided some support, with steel prices rebounding, for example. Geopolitical risks have disrupted end markets.
Top 10 performers by fund
| Fund | Sector | (%) | Fund | Sector | (%) |
|---|---|---|---|---|---|
| Crystal Amber | UK smaller companies | 39.5 | PRS REIT | Property – UK residential | 38.2 |
| Baillie Gifford China Growth Trust | China / Greater China | 18.1 | Crystal Amber | UK smaller companies | 27.3 |
| Golden Prospect Precious Metal | Commodities & natural resources | 15.4 | Castelnau Group | Flexible investment | 26.6 |
| JPMorgan China Growth & Income | China / Greater China | 14.3 | Amedeo Air Four Plus | Leasing | 23.2 |
| Fidelity China Special | China / Greater China | 13.0 | Chrysalis Investments Limited | Growth capital | 22.6 |
| Ecofin Global Utilities & Infra | Infrastructure securities | 11.8 | Balanced Commercial Property | Property – UK commercial | 21.4 |
| Middlefield Canadian Income | North America | 11.2 | Golden Prospect Precious Metal | Commodities & natural resources | 21.4 |
| JPMorgan Japan Small Cap G&I | Japanese smaller companies | 8.9 | abrdn Property Income Trust | Property – UK commercial | 20.6 |
| Nippon Active Value | Japanese smaller companies | 8.9 | Doric Nimrod Air Three | Leasing | 20.3 |
| Bellevue Healthcare | Biotechnology & healthcare | 8.9 | Doric Nimrod Air Two | Leasing | 20.0 |
Source: Morningstar, Marten & Co. Note: excludes trusts with market caps below £15m at 30/09/24
The process of Crystal Amber’s wind up saw its portfolio become highly concentrated, with Morphic, a biopharmaceutical company, increasingly dominant. Following Crystal Amber’s £59m revaluation of Morphic, the fund’s share price surged on 31st July.
For funds focused on Chinese equities, the government’s stimulus boost led to heightened returns. The sudden gains of technology companies Alibaba and Tencent contributed to the share price hikes of Baillie Gifford China Growth Trust, JPMorgan China Growth & Income and Fidelity China Special Situations. All three of these funds saw their share prices jump by over 22%. Even across the Pacific, Middlefield Canadian Income said its portfolio stood to benefit from Chinese stimulus.
Golden Prospect Precious Metal’s NAV increases were propelled by an all-time high price of gold in late September. Investors have sought the shelter of gold due to macro concerns, led by the escalating conflicts in the Middle East, in addition to fears of a potential recession.
In similar fashion to property funds, infrastructure focused trusts such as Ecofin Global Utilities experienced NAV increases supported by sensitivity to interest rate cuts. In the case of Ecofin, growing demand for power is boosting the trust’s returns.
Japanese smaller companies funds such as JPMorgan Japan Small Cap Growth & Income and Nippon Active Value outperformed large cap focused Japanese trusts. Small caps are less exposed to exporters and the yen carry trade. Returns were not derailed by the volatility associated with the surprise change in leadership, as new Prime Minister Shigeru Ishiba called an election.
PRS REIT had the largest share price jump over the third quarter, as shareholders won out in their battle to remove the chairman and appoint two new directors. A strategic overhaul now looks likely once a new chairman is installed. For Balanced Commercial Property, its recommendation of a cash offer from Starwood Capital, whose £673.5m cash offer was at a significant premium to its share price, triggered these returns. In the case of abrdn Property Income Trust, the news of proposed accelerated wind up in a sale of the portfolio to GoldenTree Asset Management led to a narrowing of its discount.
The revaluation of Dignity, Castlenau’s largest investment, led to a 30% surge in its share price in the first few days of July. The increase in Chrysalis’ share price was triggered by its sale of portfolio companies Graphcore and later in the quarter, Featurespace. The holdings are expected to raise $56m and £89m, respectively.
Following an announcement on 21st August that Doric Nimrod Air Two was selling over £153m of aircraft assets to Emirates, the fund’s share price rose by 13%. Doric Nimrod Air Three investors took comfort from this.
Bottom 10 performers by fund
In terms of the worst performing funds, Riverstone Energy’s significant drop in NAV is related to falling oil prices.
Geiger Counter’s NAV was affected by a generally disappointing backdrop for the uranium price, as investors worry about new supply coming to the market.
For AI/technology focused funds like Manchester & London, Allianz Technology Trust and Polar Capital Technology, the US tech selloff that struck in July knocked their NAVs.
Carrying on from previous months, JPMorgan Emerging Europe, Middle East and Africa’s share price has continued to suffer from concerns about the true value of its legacy Russian holdings.
| Fund | Sector | (%) | Fund | Sector | (%) |
|---|---|---|---|---|---|
| Riverstone Energy | Commodities & natural resources | (20.9) | Ecofin US Renewables Infrastructure | Renewable energy infrastructure | (40.2) |
| Geiger Counter | Commodities & natural resources | (13.3) | HydrogenOne Capital Growth | Renewable energy infrastructure | (30.7) |
| Manchester & London | Global | (10.6) | Digital 9 Infrastructure | Infrastructure | (26.8) |
| NB Distressed Debt Inv Extended Life | Debt – loans & bonds | (9.8) | Gresham House Energy Storage | Renewable energy infrastructure | (24.8) |
| JPMorgan Emerg E, ME & Africa Sec Plc | Global emerging markets | (8.7) | Schiehallion Fund | Growth capital | (24.0) |
| EPE Special Opportunities | Private equity | (8.7) | Symphony International Holding | Private equity | (21.3) |
| Allianz Technology Trust | Technology & technology innovation | (8.0) | Riverstone Credit Opportunities Income | Debt – direct lending | (19.5) |
| Polar Capital Technology | Technology & technology innovation | (7.0) | Schroders Capital Global Innov Trust | Growth capital | (18.5) |
| Riverstone Credit Opportunities Income | Debt – direct lending | (6.8) | EPE Special Opportunities | Private equity | (15.2) |
| PRS REIT | Property – UK residential | (6.5) | Pershing Square Holdings | North America | (15.1) |
Source: Morningstar, Marten & Co. Note: excludes trusts with market caps below £15m at 30/09/24
Ecofin US Renewables Infrastructure’s failure to secure a bidder for its assets in its wind up led to sharp falls in its share price and NAV. Also in the renewable energy infrastructure sector, Gresham House Energy Storage revealed in its half year results that its operational revenues fell by 12.8% year on year, reflecting the issues that the battery sector has had in benefiting from the capacity market. Additional woes for share prices in the sector included Digital 9 Infrastructure, which slashed its NAV, and then incentivised its new manager to achieve an even lower realisation value.
Despite earlier gains in July, Schiehallion Fund took a blow from the tech selloff in August. As some investors became more risk averse, HydrogenOne Capital Growth, Schroders Capital Global Innovation Trust and Symphony International Holding saw their discounts widen.
The withdrawal of the IPO of Pershing Square USA from the New York Stock Exchange was disappointing news for shareholders in Pershing Square Holdings, who had hoped to benefit from lower performance fees.
More expensive/cheaper
| Fund | Sector | 28 Jun disc (%) |
30 Sep disc (%) |
Fund | Sector | 28 Jun disc (%) |
30 Sep disc (%) |
|---|---|---|---|---|---|---|---|
| PRS REIT | Property – UK residential | (43.6) | (17.0) | Ecofin US Renewables Infrastructure | Renewable energy infrastructure | (19.1) | (48.8) |
| Castelnau Group | Flexible investment | (22.6) | (1.5) | Schiehallion Fund | Growth capital | (15.4) | (33.6) |
| Doric Nimrod Air Three | Leasing | 19.9 | 38.5 | Gresham House Energy Storage | Renewable energy infrastructure | (35.6) | (52.2) |
| Balanced Commercial Property | Property – UK commercial | (24.6) | (9.8) | HydrogenOne Capital Growth | Renewable energy infrastructure | (48.4) | (64.2) |
| Tritax EuroBox | Property – Europe | (23.9) | (9.6) | Riverstone Credit Opportunities Income | Debt – direct lending | (9.4) | (24.0) |
| Doric Nimrod Air Two | Leasing | (9.7) | 4.4 | Digital 9 Infrastructure | Infrastructure | (51.1) | (64.2) |
| abrdn Property Income Trust | Property – UK commercial | (29.8) | (16.9) | Schroders Capital Global Innov Trust | Growth capital | (43.3) | (53.8) |
| AEW UK REIT | Property – UK commercial | (19.5) | (7.2) | Augmentum Fintech | Financials & financial innovation | (28.9) | (39.1) |
| Chrysalis Investments | Growth capital | (47.6) | (35.8) | Symphony International Holding | Private equity | (49.2) | (57.9) |
| Schroder Real Estate Invest | Property – UK commercial | (29.1) | (17.6) | Apax Global Alpha | Private equity | (25.8) | (34.4) |
Source: Morningstar, Marten & Co. Note: excludes trusts with market caps below £25m at 30/09/24
Getting more expensive
UK property trusts dominated the list of narrowing discounts, largely related to corporate activity, with the change in leadership at PRS REIT, and bids for Balanced Commercial Property and Tritax EuroBox. Elsewhere in the sector, higher rents and lower borrowing costs elevated returns. Outside of the sector, revaluations/sales of major assets (A380s for the Doric Nimrod funds, Dignity for Castlenau, Graphcore and Featurespace for Chrysalis) led to considerable uplifts.
Getting cheaper
Difficulties in securing buyers for assets widened discounts for Ecofin US Renewables Infrastructure and Digital 9 Infrastructure. Investor nerves hit growth capital funds such as Schiehallion, HydrogenOne Capital Growth, and Augmentum Fintech. At the bottom of the list, Apax Global Alpha’s widening discount likely reflects its relatively poor returns in recent years.
Money raised and returned
| Fund | Sector | £m raised | Fund | Sector | £m returned |
|---|---|---|---|---|---|
| Regional REIT | Property – UK commercial | 110.5 | Scottish Mortgage | Global | (327.6) |
| JPMorgan Global Growth & Income | Global equity income | 69.9 | Smithson Investment Trust | Global smaller companies | (112.2) |
| Ashoka India Equity Investment | India/Indian Subcontinent | 14.5 | F&C Investment Trust | Global | (108.5) |
| Odyssean Investment Trust | UK smaller companies | 11.7 | JPMorgan European Discovery | European smaller companies | (103.2) |
| TwentyFour Select Monthly Income | Debt – loans & bonds | 9.3 | Finsbury Growth & Income | UK equity income | (87.4) |
Source: Morningstar, Marten & Co. Note 1) value of shares issued/repurchased as at 30 September 2024
Money coming in
Once again, there were no new IPOs.
Regional REIT raised money via a rights issue. JPMorgan Global Growth & Income, Ashoka India Equity, and TwentyFour Select Monthly Income benefitted from regular share issuance, while Odyssean held a placing and retail offer.
Money going out
In terms of money going out Scottish Mortgage passed the target £1bn mark in its share buyback programme. Similarly, Smithson, F&C, and Finsbury Growth and Income are regular repurchasers of stock.
JPMorgan European Discovery made a tender offer for 15% of its shares, with cash being distributed to its shareholders during September.
Over the quarter, we said goodbye to Hipgnosis Songs Fund, Marble Point Loan Financing, Foresight Sustainable Forestry, and NB Global Monthly Income. Henderson EuroTrust merged with Henderson European Focus, Aberforth Split Level Income was reconstructed to become Aberforth Geared Value and Income. Witan agreed to merge with Alliance Trust.
Major news stories over Q3 2024
Portfolio developments
- HydrogenOne announces new TotalEnergies contract for portfolio company Strohm
- AI drives sky high returns for Polar Capital Technology Trust
- Seraphim Space Investment Trust maintains momentum as portfolio continues to develop
- Narrowing discount offsets Baillie Gifford US Growth underperformance
- Downing Renewables & Infrastructure acquires three Swedish hydropower plants
- Henderson High Income NAV beats benchmark in first half
- HydrogenOne Capital Growth continues to make progress
Corporate news
- Japan Small Cap Growth & Income to be merged into JPMorgan Japanese
- NewRiver REIT boosts capital partnerships business with acquisition
- Baroness Bowles tables new cost disclosure bill
- Pershing Square Holdings trails market in H1, while IPO withdrawn
- Artemis Alpha and Aurora to merge
- JPMorgan Global Core Real Assets fails to pass continuation vote
- Alliance Trust and Witan publish circulars for their merger
- Chrysalis sells Featurespace to Visa achieving 20% premium to valuation
- Gulf Investment Fund wind up now a certainty
Property news
QuotedData views
Visit www.quoteddata.com or more on these and other stories plus in-depth analysis on some funds, the tools to compare similar funds and basic information, key documents and regulatory news announcements on every investment company quoted in London
Upcoming events
Here is a selection of what is coming up. Please refer to the Events section of our website for updates between now and when they are scheduled.
Interviews
Every Friday at 11 am, we run through the more interesting bits of the week’s news, and we usually have a special guest discussing a particular investment company.
Guide

Our independent guide to quoted investment companies is an invaluable tool for anyone who wants to brush up on their knowledge of the investment companies’ sector. Please register on www.quoteddata.com if you would like it emailed to you directly.
Appendix 1 – median performance by share price return over Q3 2024
| Share price Q3 24 TR (%) |
NAV Q3 24 TR (%) |
Discount 30/09/24 (%) |
Median market cap 30/09/24 (£m) |
Number of companies in the sector | |
|---|---|---|---|---|---|
| Leasing | 16.8 | 6.2 | (34.2) | 157.1 | 7 |
| Property – UK commercial | 16.1 | 0.0 | (16.7) | 220.4 | 11 |
| Property – UK healthcare | 13.0 | 7.7 | (21.9) | 470.3 | 2 |
| Property – Europe | 11.6 | (8.7) | (33.2) | 251.4 | 5 |
| China / Greater China | 10.1 | 15.3 | (13.1) | 197.6 | 4 |
| UK equity & bond income | 8.1 | 11.1 | (7.8) | 286.6 | 1 |
| Infrastructure securities | 8.0 | 4.6 | (13.8) | 116.7 | 2 |
| Property – UK residential | 7.9 | (0.7) | (57.1) | 178.3 | 3 |
| Environmental | 7.3 | 4.7 | (20.0) | 86.7 | 3 |
| Property – UK logistics | 7.3 | 3.5 | (21.3) | 595.6 | 3 |
| Japanese smaller companies | 6.5 | 9.0 | (8.5) | 269.9 | 4 |
| Debt – structured finance | 6.4 | 5.7 | (19.2) | 162.8 | 6 |
| Global smaller companies | 4.6 | 6.2 | (11.4) | 790.1 | 5 |
| UK all companies | 4.3 | 12.5 | (10.7) | 213.4 | 7 |
| Biotechnology & healthcare | 4.2 | 5.2 | (9.7) | 520.4 | 6 |
| Share price Q3 24 TR (%) |
NAV Q3 24 TR (%) |
Discount 30/09/23 (%) |
Median market cap 30/09/24 (£m) |
Number of companies in the sector | |
|---|---|---|---|---|---|
| Infrastructure | 4.0 | 5.3 | (16.6) | 936.2 | 10 |
| UK equity income | 3.9 | 10.2 | (6.9) | 401.0 | 17 |
| North American smaller companies | 3.8 | 3.0 | (10.3) | 205.0 | 2 |
| Global equity income | 3.3 | 7.0 | (8.9) | 331.2 | 7 |
| European smaller companies | 2.2 | 4.9 | (10.8) | 435.5 | 4 |
| Debt – Loans & Bonds | 2.2 | 6.9 | (1.4) | 137.8 | 9 |
| Asia Pacific | 2.2 | 12.6 | (12.4) | 539.0 | 5 |
| Asia Pacific smaller companies | 1.7 | 10.5 | (15.2) | 359.7 | 3 |
| Renewable energy infrastructure | 1.6 | 0.0 | (27.2) | 299.6 | 20 |
| Hedge Funds | 1.1 | 2.0 | (10.9) | 80.4 | 6 |
| India/Indian Subcontinent | 1.0 | 16.3 | (13.5) | 434.0 | 4 |
| UK smaller companies | 0.9 | 9.8 | (11.6) | 135.1 | 21 |
| Flexible Investment | 0.9 | 4.8 | (17.1) | 90.8 | 18 |
| Asia Pacific equity income | 0.2 | 12.9 | (11.1) | 336.1 | 4 |
| North America | (0.4) | 9.6 | (11.9) | 490.7 | 5 |
| Property – debt | (0.4) | 2.1 | (27.9) | 46.4 | 5 |
| Global | (0.6) | 8.8 | (9.0) | 1,021.0 | 12 |
| Private Equity | (0.7) | 0.4 | (34.4) | 469.0 | 17 |
| Global emerging markets | (0.8) | 8.3 | (12.0) | 274.5 | 10 |
| Debt – direct lending | (1.3) | 2.8 | (17.2) | 110.7 | 5 |
| Growth capital | (1.6) | 0.0 | (38.2) | 127.3 | 6 |
| Country specialist | (1.8) | 10.6 | (13.1) | 406.5 | 4 |
| Europe | (2.0) | 6.0 | (10.1) | 570.4 | 7 |
| Insurance & reinsurance strategies | (2.2) | 19.4 | (19.6) | 32.9 | 2 |
| Commodities & natural resources | (2.3) | 1.7 | (16.8) | 62.4 | 9 |
| Japan | (3.4) | 8.8 | (12.3) | 292.8 | 5 |
| Financials & financial innovation | (3.6) | 11.0 | (22.5) | 354.1 | 2 |
| Latin America | (4.5) | (23.5) | (12.7) | 96.0 | 1 |
| Property – rest of World | (5.9) | (18.3) | (66.4) | 20.7 | 3 |
| Technology & technology innovation | (10.2) | 18.2 | (11.5) | 2,461.0 | 2 |
| Median | 1.4 | 1.1 | (13.1) | 269.4 | 5 |
Source: Morningstar, Marten & Co. Note: all figures represent median values of the constituent funds from each sector. To 30/09/24
IMPORTANT INFORMATION
This note was prepared by Marten & Co (which is authorised and regulated by the Financial Conduct Authority).
This note is for information purposes only and is not intended to encourage the reader to deal in any of the securities mentioned within it. Marten & Co is not authorised to give advice to retail clients. The research does not have regard to the specific investment objectives financial situation and needs of any specific person who may receive it.
Marten & Co may have or may be seeking a contractual relationship with any of the securities mentioned within the note for activities including the provision of sponsored research, investor access or fundraising services.
The analysts who prepared this note may have an interest in any of the securities mentioned within it.
This note has been compiled from publicly available information. This note is not directed at any person in any jurisdiction where (by reason of that person’s nationality, residence or otherwise) the publication or availability of this note is prohibited.
Accuracy of Content: Whilst Marten & Co uses reasonable efforts to obtain information from sources which we believe to be reliable and to ensure that the information in this note is up to date and accurate, we make no representation or warranty that the information contained in this note is accurate, reliable or complete. The information contained in this note is provided by Marten & Co for personal use and information purposes generally. You are solely liable for any use you may make of this information. The information is inherently subject to change without notice and may become outdated. You, therefore, should verify any information obtained from this note before you use it.
No Advice: Nothing contained in this note constitutes or should be construed to constitute investment, legal, tax or other advice.
No Representation or Warranty: No representation, warranty or guarantee of any kind, express or implied is given by Marten & Co in respect of any information contained on this note.
Exclusion of Liability: To the fullest extent allowed by law, Marten & Co shall not be liable for any direct or indirect losses, damages, costs or expenses incurred or suffered by you arising out or in connection with the access to, use of or reliance on any information contained on this note. In no circumstance shall Marten & Co and its employees have any liability for consequential or special damages.
Governing Law and Jurisdiction: These terms and conditions and all matters connected with them, are governed by the laws of England and Wales and shall be subject to the exclusive jurisdiction of the English courts. If you access this note from outside the UK, you are responsible for ensuring compliance with any local laws relating to access.
No information contained in this note shall form the basis of, or be relied upon in connection with, any offer or commitment whatsoever in any jurisdiction.
Investment Performance Information: Please remember that past performance is not necessarily a guide to the future and that the value of shares and the income from them can go down as well as up. Exchange rates may also cause the value of underlying overseas investments to go down as well as up. Marten & Co may write on companies that use gearing in a number of forms that can increase volatility and, in some cases, to a complete loss of an investment.