July
Monthly | Investment companies
Winners and losers in June 2025
In a continuation of May’s relative recovery from the effects of the US’ ‘liberation day’ tariffs, technology stocks led the pack of best performers. A renewed optimism for AI stocks contributed to rises for indices such as the S&P500 and the Nasdaq Composite, which closed their best quarters in over a year, with the former particularly exposed to large cap tech. Nvidia was the standout holding among tech trusts, especially for those like Manchester & London, which had 38% of its portfolio in Nvidia at the end of May. The company reached an all-time high share price of $155 on 26 June, supported by signs of easing US/China trade relations and strong earnings figures that were published towards the end of May.
Growth capital trusts may have been helped by lower US government bond yields, leading to improved confidence in higher risk and earlier stage investments. Also, news of a tender offer for Schroders Capital Global Innovation contributed to sector gains.
Falling interest rates/bond yields are also helpful for high yielding renewable energy trusts. It is also worth mentioning that six renewable energy trusts have successfully passed continuation votes in the last two months, reflecting confidence in a rebound for the sector. The bid for Downing Renewables and Infrastructure will also have had an impact. In the case of Asian Pacific equity income trusts, continued shifts out of US equities to Asian counterparts will have bolstered returns. Moreover, talks between the US and Chinese governments aimed at resolving their trade war fostered hope of de-escalation. This also coincided with the depreciation of the US dollar against several Asian currencies, most notably the Taiwan dollar, which surged to a three year high against the US dollar, appreciating 12% year to date. Japanese smaller companies will have benefitted from the same tailwinds, as foreign inflows into Japanese equities reached their highest quarterly figure in two years.
Best performing sectors in June 2025 by total price return
| Median share price total return (%) |
Median NAV total return (%) |
Median discount 30/06/25 (%) |
Median sector market cap 30/06/25 (£m) | Number of companies in the sector | |
|---|---|---|---|---|---|
| Technology & Technology Innovation | 10.0 | 9.3 | (9.9) | 2,632.5 | 2 |
| Growth Capital | 8.8 | 1.0 | (30.0) | 174.1 | 7 |
| Renewable Energy Infrastructure | 6.8 | (0.4) | (27.7) | 377.3 | 19 |
| Asia Pacific Equity Income | 5.5 | 2.5 | (15.4) | 372.7 | 5 |
| Japanese Smaller Companies | 5.4 | 1.8 | (0.7) | 322.8 | 3 |
In terms of the worst performing sectors, losses were relatively minimal compared to previous months. Trusts in the leasing sector may have been affected by fluctuating oil prices amid volatile geopolitical events during the month. For the debt sectors, significant outflows from US long term bonds reflect weaker investor confidence. This ‘exodus’, as described by the FT, is the fastest rate of bond exits since levels seen during the COVID-19 pandemic. The weakening US dollar is weighing on trusts with relatively high exposures to the country, including many hedge funds.
The Property – Europe sector demonstrated relative resilience, with slight downturns. German residential property prices have risen for the second consecutive quarter, however sentiment for European real estate sentiment fell in the period. This was indicated by the European real estate fund association, INREV, whose consensus indicator dropped to 52.2 in June from 56.7 in March. It seems that sentiment for the sector may be adjusting to the region’s leading position in a global recovery amid tariff fallout, as investors are cautious of market trajectory.
Worst performing sectors in June 2025 by total price return
| Median share price total return (%) |
Median NAV total return (%) |
Median discount 30/06/25 (%) |
Median sector market cap 30/06/25 (£m) | Number of companies in the sector | |
|---|---|---|---|---|---|
| Leasing | (2.0) | (0.8) | (25.0) | 142.6 | 4 |
| Hedge Funds | (1.6) | (0.6) | (9.2) | 80.4 | 5 |
| Debt – Direct Lending | (1.2) | 0.0 | (15.0) | 71.6 | 5 |
| Debt – Loans & Bonds | 0.2 | 0.2 | 0.4 | 164.1 | 9 |
| Property – Europe | 0.5 | 0.9 | (33.0) | 199.8 | 4 |
Best performing investment companies
In terms of the best performers, emerging markets funds benefitted from the already discussed depreciation of the US dollar. This favoured certain foreign markets, particularly in East Asia. Templeton Emerging Markets and Mobius Investment Trust have been beneficiaries, as has Utilico Emerging Markets, which is held by UIL. UIL’s gold exposure has also been working in its favour. This would also explain Golden Prospect Precious Metal’s feature on the share price returns side of the table, with the price of gold reaching $3,431 per ounce on 13 June. Since an all-time high price of gold was reached in April, sustained geopolitical uncertainty has led to further price appreciation for the trust.
Allianz Technology Trust and Polar Capital Technology were clear beneficiaries of the resurgence in technology shares, particularly those tied to AI, semiconductors, and platform technologies. The late May rally in large-cap US tech stocks filtered into June, helping these trusts post strong NAV growth. Also, both funds have considerable investments in TSMC, which hit an all-time high share price of $228.88 on 27 June. This was driven by TSMC’s central role in the AI trade, which is once again having a big influence on markets.
After a period of difficult performance, the uranium price has been recovering, boosting Geiger Counter. Market sentiment was encouraged by developments such as the $200m capital raise for the Sprott Physical Uranium Trust (SPUT). Geiger Counter has also reached an agreement with activist investor Saba, which bars the requisition of a meeting until at least 2028. The US’ military involvement in the attack of Iranian nuclear sites will also have been a contributing factor to uranium price volatility. Elsewhere in the commodities sector, Baker Steel’s share price was uplifted by the sale of its royalty on the Prognoz silver project. The trust’s look through share of the sale amounts to $5.16m, which should arrive in Q3.
NAV growth for Odyssean, Rockwood Strategic, Strategic Equity Capital and Chelverton UK Dividend Trust has been reinforced by optimism following May’s rate cuts. The considerably wide discounts among UK small caps may have attracted investors, as the FTSE SmallCap Index rose over 3.5% over June. Rockwood Strategic’s recent results showed outperformance of the index and the AIM All-Share. Subsequent to this strong investor demand, 3.8m shares were issued from 31 March to 13 June 2025.
Best performing trusts in total NAV (LHS) and share price (RHS) terms over June 2025
| Fund | Sector | (%) | Fund | Sector | (%) |
|---|---|---|---|---|---|
| UIL | Flexible Investment | 13.8 | SDCL Efficiency Income Trust plc | Renewable Energy Infrastructure | 31.7 |
| Geiger Counter | Commodities & Natural Resources | 12.8 | Schroders Capital Global Innov Trust | Growth Capital | 24.9 |
| Polar Capital Technology | Technology & Technology Innovation | 10.2 | Downing Renewables & Infrastructure | Renewable Energy Infrastructure | 21.7 |
| Odyssean Investment Trust | UK Smaller Companies | 10.2 | Gresham House Energy Storage | Renewable Energy Infrastructure | 18.0 |
| Rockwood Strategic | UK Smaller Companies | 8.7 | Digital 9 Infrastructure | Infrastructure | 17.8 |
| Allianz Technology Trust | Technology & Technology Innovation | 8.5 | Seraphim Space Investment Trust | Growth Capital | 16.6 |
| Templeton Emerging Mkts Invmt Tr TEMIT | Global Emerging Markets | 7.8 | Syncona | Biotechnology & Healthcare | 15.8 |
| Mobius Investment Trust | Global Emerging Markets | 7.8 | Ground Rents Income Fund | Property – UK Residential | 14.8 |
| Strategic Equity Capital | UK Smaller Companies | 7.7 | Golden Prospect Precious Metal | Commodities & Natural Resources | 14.1 |
| Chelverton UK Dividend Trust | UK Equity Income | 6.9 | Baker Steel Resources | Commodities & Natural Resources | 13.1 |
As discussed above, renewable energy trusts have had a bit of a bounce. Topping the table was SDCL Energy Efficiency Income Trust, which said that it was reviewing its strategic options. Downing Renewables and Infrastructure was the subject of an all-cash offer from Bagnall Energy, which values the fund at approximately £174.6m. Gresham House Energy Storage completed an £8.6m third party equity raise for Glassenbury Battery Storage Ltd. GRID sees the transaction as a template for future augmentations, with construction expected to begin this month. Digital 9 Infrastructure completed the sale of its stake in SeaEdge UK1 to Stellium Datacentres for £10.7m. The fund plans to use the proceeds of the sale towards paying down its RCF.
Seraphim Space’s recent newsletters and its Q3 results (published early in the month) highlighted a string of successes within the portfolio, including ICEYE securing a €200m contract with the Polish government for SAR satellites, along with new partnerships such as with Rheinmetall in Germany. Another growth capital trust with strong returns was Schroder Capital Global Innovation, which proposed a plan for a tender offer, following the approval of its managed wind down in February.
The pursuit of a managed wind down from Syncona was instrumental in that fund’s gains. Also, Syncona’s board may provide institutional investors the opportunity to transfer their stakes into a new private investment vehicle.
Worst performing investment companies
Relatively modest falls in NAVs over the course of June can often be attributed to a weaker US dollar. There was no new news from NB Distressed Debt Extended Life. Its NAV has been on a steady decline this year.
Despite appearing on the best performing table for price growth, Golden Prospect Precious Metal saw its NAV decrease over June. One factor was a fall in the share price of the trust’s largest holding West African Resources. The price dropped ahead of the nationalisation of five gold mines in Burkina Faso. Since August 2024, the country’s government has taken steps to increase control over its resources. It says that it has plans to target other mines in the country.
Worst performing trusts in total NAV (LHS) and share price (RHS) terms over June 2025
| Fund | Sector | (%) | Fund | Sector | (%) |
|---|---|---|---|---|---|
| NB Distressed Debt Inv Extended Life | Debt – Loans & Bonds | (4.5) | DP Aircraft I | Leasing | (8.5) |
| Golden Prospect Precious Metal | Commodities & Natural Resources | (3.5) | PRS REIT | Property – UK Residential | (6.7) |
| BH Macro USD | Hedge Funds | (2.0) | Symphony International Holding | Private Equity | (6.3) |
| DP Aircraft I | Leasing | (1.6) | Custodian Property Income REIT | Property – UK Commercial | (5.9) |
| Symphony International Holding | Private Equity | (1.6) | Life Settlement Assets A | Insurance & Reinsurance Strategies | (5.5) |
| Life Settlement Assets A | Insurance & Reinsurance Strategies | (1.6) | US Solar Fund | Renewable Energy Infrastructure | (5.1) |
| Fair Oaks Income 2021 | Debt – Structured Finance | (1.6) | RM Infrastructure Income | Debt – Direct Lending | (4.1) |
| Ecofin US Renewables Infrastructure | Renewable Energy Infrastructure | (1.6) | Scottish Oriental Smaller Cos | Asia Pacific Smaller Companies | (4.0) |
| Tufton Assets | Leasing | (1.6) | BH Macro USD | Hedge Funds | (3.5) |
| JPEL Private Equity | Private Equity | (1.6) | JPMorgan Global Core Real Assets | Flexible Investment | (3.4) |
Investors in PRS REIT are likely dissatisfied with the cash offer made by Long Harbour for the company. The proposal, which values PRSR at £631.6m or 115p per share, was 19% below the 139.6p NAV at the time. Another property trust, Custodian Property Income REIT, saw price falls. It announced results and made an all-share acquisition of Merlin Properties during the month but neither piece of news likely accounts for the fall.
JPMorgan Core Real Assets said it was about ready to make a distribution to shareholders. The share price move seems at odds with that.
Moves in discounts and premiums
More expensive (LHS) and cheaper (RHS) relative to NAV over June 2025
| Fund | Sector | Disc/ Prem 31/05/25 (%) |
Disc/ Prem 30/06/25 (%) |
Fund | Sector | Disc/ Prem 31/05/25 (%) |
Disc/ Prem 30/06/25 (%) |
|---|---|---|---|---|---|---|---|
| Downing Renewables & Infrastructure | Renewable Energy Infrastructure | (28.6) | (13.4) | JPMorgan Emerg EMEA Sec Plc | Global Emerging Markets | 314.3 | 294.1 |
| Schroders Capital Global Innov Trust | Growth Capital | (44.0) | (30.0) | UIL | Flexible Investment | (26.5) | (33.9) |
| SDCL Efficiency Income Trust plc | Renewable Energy Infrastructure | (52.0) | (38.1) | PRS REIT | Property – UK Residential | (16.7) | (22.5) |
| Golden Prospect Precious Metal | Commodities & Natural Resources | (27.8) | (14.7) | Custodian Property Income REIT | Property – UK Commercial | (16.5) | (21.8) |
| Seraphim Space Investment Trust | Growth Capital | (27.2) | (15.1) | DP Aircraft I | Leasing | (27.9) | (33.0) |
All the trusts that became more expensive over the month (or perhaps less cheap would be a better description, seeing as most of these are still on wide discounts) have already been discussed.
In terms of the cheaper trusts, JPMorgan Emerging EMEA has continued to be held back by a lack of progress in resolving the war in Ukraine, as well as its ongoing court case. A hearing date for this has been delayed again. Despite UIL’s NAV rises, a fall in its share price led to a widening discount. As mentioned, an underwhelming proposal for PRS REIT’s assets contributed to its discount widening.
Money raised and returned
Money raised (LHS) and returned (RHS) over June 2025 in £m
| Fund | Sector | £m raised | Fund | Sector | £m returned |
|---|---|---|---|---|---|
| abrdn Asia Focus plc | Asia Pacific Smaller Companies | 29.5 | Polar Capital Global Financials | Financials & Financial Innovation | (275.1) |
| Custodian Property Income REIT | Property – UK Commercial | 17.9 | European Opportunities Trust | Europe | (144.4) |
| Rockwood Strategic | UK Smaller Companies | 11.2 | Scottish Mortgage | Global | (84.3) |
| TwentyFour Income | Debt – Structured Finance | 9.3 | Smithson Investment Trust | Global Smaller Companies | (62.7) |
| Invesco Bond Income Plus | Debt – Loans & Bonds | 7.3 | Worldwide Healthcare | Biotechnology & Healthcare | (61.2) |
abrdn Asia Focus converted its loan stock into equity. Custodian issued shares in connection with the deal we discussed above.
Polar Capital Global Financial’s top spot for money returned reflects the completion of its 100% exit opportunity. European Opportunities Trust’s latest tender offer was taken up in full. It is no surprise to see Scottish Mortgage and Smithson on the list as both continued their long buyback programmes.
Major news stories and QuotedData views over June 2025

Portfolio developments
- Patria Private Equity delivers steady returns amid market uncertainty
- Chrysalis grows NAV but discount persists despite realisations and buybacks
- Caledonia Investments results & reports
- Edinburgh Worldwide outperforms in volatile markets
- Foresight Environmental Infrastructure delivers record portfolio cashflows and resets strategic focus
- Montanaro European shareholders benefit from discount narrowing
- NextEnergy Solar Fund reports NAV fall but reiterates dividend and strategic ambitions
- Lindsell Train underperforms NAV but share price rallies as discount narrows
- Baillie Gifford UK Growth sees improved returns and tighter discount, with lots of recovery potential
- GCP Infrastructure NAV slips again
- Oakley Capital backs strategic advisory firm G3 and fast-growing Italian consultancy JBMC
- Seraphim Space has published its May 2025 SpaceTech newsletter
- Seraphim Space – Portfolio value rises 3% over quarter, ICEYE leads commercial momentum
Corporate news
- River Global agrees terms to acquire Devon Equity Management
- Pantheon Infrastructure demonstrates progress with latest sustainability report
- Downing Renewables & Infrastructure agrees recommended cash offer from Bagnall
- NextEnergy Solar cuts fees
- European Opportunities completes 25% tender offer in full
- Directors’ fees cut at Montanaro UK Smaller
- Polar Capital Global Financials secures its future
- NextEnergy Solar affirms strong ESG focus in 2025 sustainability report
- Lindsell Train Investment Trust unveils 100-for-1 share split proposal
- AVI calls for leadership change and strategic overhaul at Gerresheimer
- Oakley backs underground infrastructure specialist Infravadis
- Foresight Environmental Infrastructure to refocus on long-term stable cash flows
- Sequoia Economic Infrastructure Income shows resilience as NPLs fall and buybacks continue
- European Smaller Companies and European Assets propose merger
- Aquila European Renewables completes Sagres disposal
- Pantheon’s Helen Steers to retire at the end of 2025
Property news
- AEW UK REIT marks tenth year with strong set of results
- PHP wins out in battle for Assura with £1.79bn bid
- PRS REIT receives cash proposal
- Assura bidding war heats up
- Value and Indexed Property Income – Robust performance in transitional year
- Unite in for Empiric Student Property
- Unite sells student accommodation portfolio for £212m
- Blackstone firms up £470m Warehouse REIT offer
- Sirius Real Estate delivers another year of growth, supported by valuation gains and acquisitions
- Tritax Big Box bids for Warehouse REIT
- PHP hits back in battle for Assura
- Valuations rebound for Warehouse REIT, putting shade on Blackstone offer
- TR Property – Tactical gearing and income resilience help mitigate macro drag
- AEW UK REIT back fully invested with leisure park buy
- Workspace outlines growth plans following disappointing year
- NewRiver REIT posts 25% bump in income following M&A
- Custodian Property Income REIT makes £22m all-share portfolio acquisition
QuotedData views
Visit quoteddata.com for more on these and other stories plus in-depth analysis on some funds, the tools to compare similar funds and basic information, key documents and regulatory news announcements on every investment company quoted in London.
Interviews

Have you been listening to our weekly news roundup shows? Every Friday at 11 am, we run through the more interesting bits of the week’s news, and we usually have a special guest or two answering questions about a particular investment company.
| Friday | The news show | Special Guest | Topic |
|---|---|---|---|
| 3 January | Review of 2024 | James Carthew & Andrew McHattie | Review of 2024 |
| 10 January | CYN, MINI, RTW | Alexander Darwall | European Opportunities |
| 17 January | ENRG, FGEN, MTU, BOOK | Gary Robinson | Baillie Gifford US Growth |
| 24 January | SWEF, TMI, CRT, BLND | Joe Bauernfreund | AVI Global Trust |
| 31 January | LBOW, ESCT, THRG, IEM, ORIT | Douglas Brodie | Edinburgh Worldwide |
| 7 February | RNEW, RESI, PSDL, RSE, PEY, CYN | Mark Boggett | Seraphim Space |
| 14 February | BASC, JGC, Saba | Prashant Khemka | Ashoka WhiteOak Emerging Markets Trust |
| 21 February | FSFL, AIC, HRI, AGR. HOME | Samantha FitzPatrick | Murray International |
| 28 February | MHN, BRAI, TRIG | Richard Hulf | HydrogenOne Capital |
| 7 March | Saba, VEIL, WHR, SUPR, SHED | Philip Kent | GCP Infrastructure |
| 14 March | MGCI, AGR, CRT, SHED, LABS | Nicola Takada Wood | AVI Japan Opportunity Trust |
| 21 March | TMPL, HEIT, SDV | Richard Stone | The AIC |
| 28 March | MTE, INPP, FJV, OCI | In the HotSeat Special | Ideas for your ISA |
| 4 April | FJV, AJOT, ENRG, EAT | Laura Foll & Denis Jackson | Law Debenture |
| 11 April | PCFT | Stephen Rosser | NextEnergy Capital |
| 25 April | BBH, SDV | Richard Shepherd(Cross, Marcus Phayre(Mudge, Bradley Biggins | In The HotSeat Special: When will REITs rebound? |
| 2 May | BBGI, GCL, MCT | Nick Brind | Polar Capital Global Financials Trust |
| 9 May | EOT, CHRY, SDV | Mark Sheppard | Manchester & London Investment Trust |
| 16 May | NESF, SCF | Alex Wright | Fidelity Special Values |
| 23 May | ENRG, TPOU, RSE, JII | Alan Gauld | Patria Private Equity Trust |
| 30 May | CYN, RMII, CBLT | George Ensor, Haresh Vazirani and Mark Niznik | In The HotSeat Special: Nurturing growing businesses |
| 6 June | FGEN, JII, BRST, ESP | Fotis Chatzimichalakis | Impax Environmental Markets |
| 13 June | PHP/AGR, PRSR, WHR | Sandy Nairn and Alan Bartlett | Global Opportunities Trust |
| 19 June | Charlie Wright, Seb Petit, James Cook, Minesh Shah and Craig Baker | QuotedData’s Investment Trust Forum 2025 | |
| 20 June | DORE, SYNC, HET, FEV, GSF, HAN/OCN, MIGO | Matt Cable | Rights and Issues Investment Trust |
| 27 June | ESCT/ESCT, PHP/AGR, BBOX/WHR | Paul Major and Marek Poszepczynski | In The HotSeat Special: Pharmaceuticals and biotechnology |
| 4 July | MUT, GRID, SBSI | Hamish Maxwell | Scottish Mortgage |
| Coming up | |||
| 11 July | Charles Jillings | Utilico Emerging Markets |
Research
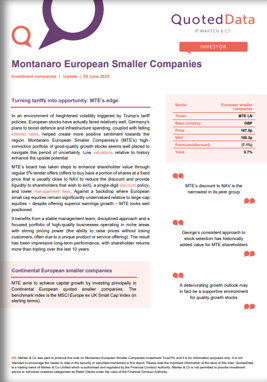
In an environment of heightened volatility triggered by Trump’s tariff policies, European stocks have actually fared relatively well. Germany’s plans to boost defence and infrastructure spending, coupled with falling interest rates, helped create more positive sentiment towards the region. Montanaro European Smaller Companies’s (MTE’s) high(conviction portfolio of good(quality growth stocks seems well placed to navigate this period of uncertainty. Low valuations relative to history enhance the upside potential.
MTE’s board has taken steps to enhance shareholder value through regular 5% tender offers (offers to buy back a portion of shares at a fixed price that is usually close to NAV to reduce the discount and provide liquidity to shareholders that wish to exit), a single(digit discount policy, and lower management fees. Against a backdrop where European small cap equities remain significantly undervalued relative to large(cap equities – despite offering superior earnings growth – MTE looks well positioned.
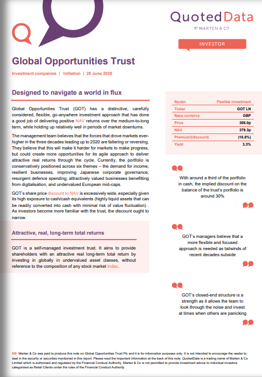
Global Opportunities Trust (GOT) has a distinctive, carefully considered, flexible, go(anywhere investment approach that has done a good job of delivering positive NAV returns over the medium(to(long term, while holding up relatively well in periods of market downturns.
The management team believes that the forces that drove markets ever(higher in the three decades leading up to 2020 are faltering or reversing. They believe that this will make it harder for markets to make progress, but could create more opportunities for its agile approach to deliver attractive real returns through the cycle. Currently, the portfolio is conservatively positioned across six themes – the demand for income, resilient businesses, improving Japanese corporate governance, resurgent defence spending, attractively valued businesses benefitting from digitalisation, and undervalued European mid-caps.
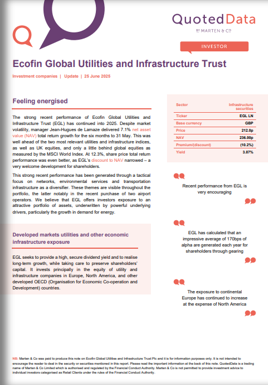
The strong recent performance of Ecofin Global Utilities and Infrastructure Trust (EGL) has continued into 2025. Despite market volatility, manager Jean(Hugues de Lamaze delivered 7.1% net asset value (NAV) total return growth for the six months to 31 May. This was well ahead of the two most relevant utilities and infrastructure indices, as well as UK equities, and only a little behind global equities as measured by the MSCI World Index. At 12.3%, share price total return performance was even better, as EGL’s discount to NAV narrowed – a very welcome development for shareholders.
This strong recent performance has been generated through a tactical focus on networks, environmental services and transportation infrastructure as a diversifier. These themes are visible throughout the portfolio, the latter notably in the recent purchase of two airport operators. We believe that EGL offers investors exposure to an attractive portfolio of assets, underwritten by powerful underlying drivers, particularly the growth in demand for energy.
Upcoming events
Here is a selection of what is coming up. Please refer to the Events section of our website for updates between now and when they are scheduled:
- HarbourVest Global Private Equity Shareholder Presentation 2025
- Shires Income AGM 2025
- Value and Indexed Property Income Trust AGM 2025
- Schroders Capital Global Innovation Trust EGM 2025
- Value and Indexed Property Income Trust AGM 2025
- Caledonia Investments AGM 2025
- TwentyFour Income Fund Shareholder Presentation 2025
- Gore Street Energy Storage Shareholder Presentation 2025
- Edinburgh Investment Trust AGM 2025
- Montanaro UK Smaller Companies AGM 2025
- Fidelity China Special Situations AGM 2025
- Cordiant Digital Infrastructure AGM 2025
- Rockwood Strategic AGM 2025
- JPMorgan Indian EGM 2025
- Schroders Capital Global Innovation Trust AGM 2025
- Ecofin Global Utilities and Infrastructure Shareholder Presentation 2025
- Schroders Capital Global Innovation Trust AGM 2025
- Bellevue Healthcare Trust EGM 2025
- HarbourVest Global Private Equity AGM 2025
- Biotech Growth Trust AGM 2025
- Ashoka WhiteOak Emerging Markets AGM 2025
- JPMorgan European Discovery AGM 2025
- Fidelity Japan Trust EGM 2025
- Weiss Korea Opportunity Fund AGM 2025
- CT UK High Income Trust AGM 2025
- Greencoat UK Wind Shareholder Presentation 2025
Guide

Our independent guide to quoted investment companies is an invaluable tool for anyone who wants to brush up on their knowledge of the investment companies’ sector. Please register on www.quoteddata.com if you would like it emailed to you directly.
Appendix 1 – median performance by sector, ranked by 2025 year to date price total return
| YTD Rank | Sector | Share price total return YTD (%) | NAV total return YTD (%) |
Discount 30/06/25 (%) |
Discount 31/05/25 (%) |
Change in discount (%) |
Median mkt cap 30/06/25 (£m) |
|---|---|---|---|---|---|---|---|
| 1 | Property – UK Logistics | 30.3 | 0.8 | (15.4) | (18.4) | 3.0 | 2,070.7 |
| 2 | Latin America | 29.4 | 28.8 | (11.0) | (9.9) | (1.1) | 103.0 |
| 3 | Property – UK Healthcare | 28.1 | 2.9 | (11.9) | (15.6) | 3.7 | 646.2 |
| 4 | European Smaller Companies | 24.8 | 20.5 | (7.5) | (7.7) | 0.2 | 437.4 |
| 5 | Infrastructure Securities | 22.4 | 20.0 | (10.5) | (10.8) | 0.3 | 121.0 |
| 6 | Europe | 18.5 | 10.1 | (4.4) | (6.8) | 2.4 | 540.7 |
| 7 | Property – UK Residential | 14.8 | 0.8 | (30.2) | (32.9) | 2.7 | 193.3 |
| 8 | UK Equity & Bond Income | 14.4 | 13.1 | (5.3) | (6.7) | 1.4 | 307.6 |
| 9 | UK Equity Income | 14.1 | 9.7 | (4.3) | (4.8) | 0.5 | 385.0 |
| 10 | Renewable Energy Infrastructure | 13.9 | 2.5 | (27.7) | (30.9) | 3.2 | 410.5 |
| 11 | UK All Companies | 13.2 | 10.5 | (9.4) | (9.4) | 0.0 | 292.2 |
| 12 | Japanese Smaller Companies | 11.3 | 6.5 | (0.7) | (3.1) | 2.4 | 322.8 |
| 13 | Japan | 10.6 | 7.6 | (9.5) | (10.0) | 0.5 | 298.1 |
| 14 | China / Greater China | 10.4 | 2.7 | (11.1) | (10.1) | (1.0) | 193.5 |
| 15 | Property – UK Commercial | 10.0 | 3.7 | (19.4) | (18.7) | (0.7) | 165.6 |
| 16 | Commodities & Natural Resources | 8.9 | 0.8 | (9.9) | (8.9) | (1.0) | 66.8 |
| 17 | Infrastructure | 8.0 | 0.9 | (20.7) | (19.6) | (1.1) | 1,000.4 |
| 18 | Global Emerging Markets | 7.5 | 6.0 | (9.8) | (10.2) | 0.5 | 296.2 |
| 19 | Debt – Structured Finance | 7.1 | 2.1 | (5.6) | (5.6) | 0.0 | 163.1 |
| 20 | Leasing | 6.3 | (2.3) | (25.0) | (22.2) | (2.8) | 141.3 |
| 21 | Global Equity Income | 4.7 | 2.3 | (0.9) | (1.2) | 0.3 | 577.4 |
| 22 | Property – Europe | 4.6 | 4.6 | (33.0) | (33.1) | 0.1 | 203.5 |
| 23 | Asia Pacific Equity Income | 4.4 | 3.7 | (9.1) | (9.1) | 0.0 | 399.3 |
| 24 | Asia Pacific Smaller Companies | 4.4 | (5.4) | (12.6) | (8.9) | (3.7) | 352.4 |
| 25 | UK Smaller Companies | 3.2 | 3.1 | (12.1) | (11.7) | (0.4) | 125.5 |
| 26 | Debt – Loans & Bonds | 2.8 | 3.3 | 0.4 | (0.2) | 0.7 | 171.2 |
| 27 | Technology & Technology Innovation | 2.7 | 3.4 | (9.9) | (10.4) | 0.5 | 2,899.2 |
| 28 | Property – Debt | 2.6 | 1.2 | (11.6) | (13.8) | 2.3 | 29.9 |
| 29 | Flexible Investment | 2.5 | 2.3 | (19.0) | (19.1) | 0.1 | 109.6 |
| 30 | Financials & Financial Innovation | 2.1 | 3.1 | (20.7) | (20.8) | 0.2 | 261.1 |
| 31 | Asia Pacific | 1.2 | (0.6) | (9.5) | (10.3) | 0.9 | 480.3 |
| 32 | Global | 0.8 | 1.7 | (8.8) | (9.9) | 1.1 | 1,015.6 |
| 33 | North America | 0.4 | 0.2 | (7.4) | (6.3) | (1.1) | 543.9 |
| 34 | Growth Capital | (0.7) | 0.0 | (30.0) | (41.3) | 11.3 | 203.0 |
| 35 | Global Smaller Companies | (0.9) | 1.9 | (10.3) | (11.0) | 0.7 | 717.2 |
| 36 | Private Equity | (1.0) | (2.2) | (32.0) | (32.8) | 0.8 | 575.7 |
| 37 | Environmental | (2.3) | (3.0) | (9.5) | (9.7) | 0.2 | 770.5 |
| 38 | India/Indian Subcontinent | (2.6) | (7.7) | (8.2) | (7.2) | (1.0) | 432.0 |
| 39 | Hedge Funds | (3.2) | (7.6) | (9.2) | (7.7) | (1.4) | 77.1 |
| 40 | Debt – Direct Lending | (3.3) | 0.5 | (15.0) | (16.6) | 1.7 | 68,7 |
| 41 | Property – Rest of World | (3.6) | (8.6) | (64.6) | (69.3) | 4.7 | 14.9 |
| 42 | Country Specialist | (4.6) | (9.9) | (11.2) | (15.2) | 4.0 | 337,1 |
| 43 | Insurance & Reinsurance Strategies | (11.1) | (8.6) | (19.2) | (15.9) | (3.4) | 57.9 |
| 44 | Biotechnology & Healthcare | (13.8) | (14.1) | (8.2) | (8.4) | 0.2 | 291.1 |
| 45 | North American Smaller Companies | (14.0) | (10.5) | (9.6) | (9.0) | (0.6) | 185.2 |
MEDIAN |
4.4 | 2.1 | (10.3) | (10.2) | 0.3 | 296.2 |
IMPORTANT INFORMATION
This note was prepared by Marten & Co (which is authorised and regulated by the Financial Conduct Authority).
This note is for information purposes only and is not intended to encourage the reader to deal in the security or securities mentioned within it. Marten & Co is not authorised to give advice to retail clients. The note does not have regard to the specific investment objectives, financial situation and needs of any specific person who may receive it.
Marten & Co may have or may be seeking a contractual relationship with any of the securities mentioned within the note for activities including the provision of sponsored research, investor access or fundraising services.
This note has been compiled from publicly available information. This note is not directed at any person in any jurisdiction where (by reason of that person’s nationality, residence or otherwise) the publication or availability of this note is prohibited.
Accuracy of Content: Whilst Marten & Co uses reasonable efforts to obtain information from sources which we believe to be reliable and to ensure that the information in this note is up to date and accurate, we make no representation or warranty that the information contained in this note is accurate, reliable or complete. The information contained in this note is provided by Marten & Co for personal use and information purposes generally. You are solely liable for any use you may make of this information. The information is inherently subject to change without notice and may become outdated. You, therefore, should verify any information obtained from this note before you use it.
No Advice: Nothing contained in this note constitutes or should be construed to constitute investment, legal, tax or other advice.
No Representation or Warranty: No representation, warranty or guarantee of any kind, express or implied is given by Marten & Co in respect of any information contained in this note.
Exclusion of Liability: To the fullest extent allowed by law, Marten & Co shall not be liable for any direct or indirect losses, damages, costs, or expenses incurred or suffered by you arising out or in connection with the access to, use of or reliance on any information contained in this note. In no circumstance shall Marten & Co and its employees have any liability for consequential or special damages.
Governing Law and Jurisdiction: These terms and conditions and all matters connected with them, are governed by the laws of England and Wales and shall be subject to the exclusive jurisdiction of the English courts. If you access this note from outside the UK, you are responsible for ensuring compliance with any local laws relating to access.
No information contained in this note shall form the basis of, or be relied upon in connection with, any offer or commitment whatsoever in any jurisdiction.
Investment Performance Information: Please remember that past performance is not necessarily a guide to the future and that the value of shares and the income from them can go down as well as up. Exchange rates may also cause the value of underlying overseas investments to go down as well as up. Marten & Co may write on companies that use gearing in a number of forms that can increase volatility and, in some cases, to a complete loss of an investment.