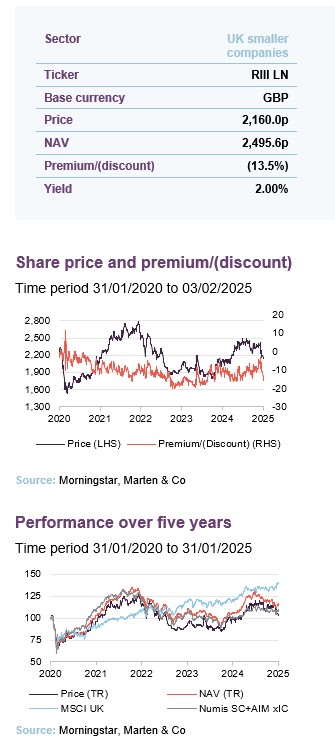
Normal programming to resume
The first nine months of 2024 provided signs of a return to normality in the UK. With inflation falling steeply, the Bank of England was able to begin its rate-cutting cycle, while a steady pickup in growth provided a sense of optimism that had long been absent from the market. The Rights and Issues Investment Trust (RIII) responded in kind, delivering a shareholder total return of 17% to 30 September 2024. Unfortunately, this momentum slowed over the latter part of the year as investors fled UK small caps, particularly AIM stocks, in advance of the budget, and yields climbed on both UK gilts and US treasuries, back towards cycle highs.
Although frustrating for investors, we believe the conditions that drove the first half recovery remain in place, and the recent weakness should not detract from the generally positive outlook for the UK, and RIII in particular. Market activity has finally begun to pick up as investors capitalise on historically cheap valuations and we believe that for active, high-conviction managers like RIII’s, the opportunity to outperform in the coming years has arguably never been better.
Concentrated exposure to UK small – and mid-caps
RIII’s objective is to exceed the FTSE All Share total return over the long term, while managing risk. RIII invests in equities with an emphasis on small- and mid-cap companies. UK smaller companies include both listed securities and those admitted to trading on the Alternative Investment Market (AIM).
| Year ended | Share price total return (%) | NAV total return (%) | MSCI UK total return (%) | Deutsche Numis Small Co. + AIM ex Inv Co. TR (%) |
|---|---|---|---|---|
| 31/01/2021 | (3.4) | 4.0 | (10.9) | 7.9 |
| 31/01/2022 | 18.3 | 19.1 | 22.8 | 10.7 |
| 31/01/2023 | (19.5) | (12.8) | 9.3 | (11.7) |
| 31/01/2024 | 7.5 | (0.8) | 2.2 | (3.3) |
| 31/01/2025 | 4.0 | 10.2 | 17.5 | 7.8 |
Market backdrop
RIII showed the qualities of its targeted portfolio of durable growth companies, delivering a shareholder total return of 17% to 30 September 2024
Throughout the first three quarters of 2024, RIII’s share price demonstrated the qualities of its targeted portfolio of durable growth companies, delivering a shareholder total return of 17% to 30 September 2024. After a challenging few years, financial conditions had finally started to turn favourably for UK investors, with inflation falling sharply back towards the Bank of England’s 2% target, while expectations for economic growth increased significantly over the course of the year. The positivity was supported further by the election result, which helped provide a sense of political stability that had been lacking in the UK. These conditions were particularly beneficial for the more cyclical sectors of the UK economy, with the beginning of the BoE’s easing cycle helping reduce the pressure of higher interest rates.
Although underlying conditions remain broadly supportive, in recent months we have begun to see some of this positive sentiment deteriorate, driven in particular by the rebound in government bond yields which at one point had risen by over 100 basis points (bps) off their cycle lows. This move picked up pace at the start of the new year, with yields jumping by almost 30pbs in just a handful of sessions to come within touching distance of 5%. As of publishing, the 10-year gilt sat at 4.54%.
Figure 1: UK 10-year gilt yields
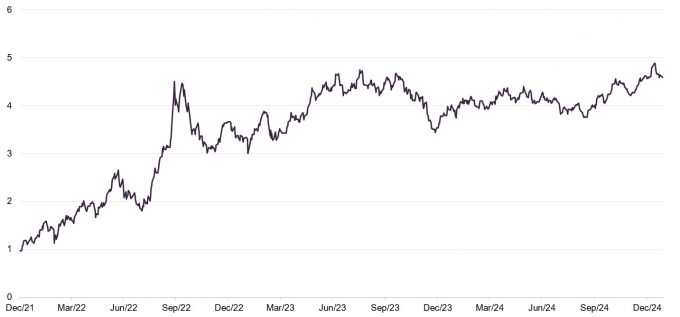
Source: Bloomberg
The initial spike in yields appeared to be due to fears around the budget deficit, with new government spending adding pressure to an inflation backdrop, which, whilst much improved, remains smouldering, particularly in the services sector. However, there is likely a secondary factor to the UK’s sensitivity to US treasuries, given its large deficits and reliance on foreign financing for its debt. As has been well documented following Trump’s election victory, US yields have spiked as markets attempt to price the impact of anticipated policy changes – including trade, immigration, and tax – all of which are expected to be inflationary. This has been compounded further by stubborn inflation and economic data which shows the US economy still firing on all cylinders, increasing the pressure on the US Federal Reserve after its larger than normal 50bp cut in September, and subsequent 25bp cuts in November and December.
Markets are now pricing just thee cuts over the next 12 months, for an implied bank rate around 4%.
These factors have limited the BoE’s ability to cut interest rates as aggressively as it otherwise may have. This is highlighted in Figure 2, which shows markets are now pricing just three cuts over the next 12 months, for an implied bank rate around 4%. Although this is still a significant shift down from the peak of 5.25%, only a few months ago expectations were for up to five rate cuts over this period, which has led to a repricing of some rate-sensitive sectors of the market after a period of optimism earlier in the year.
Figure 2: UK implied overnight rate & number of cuts
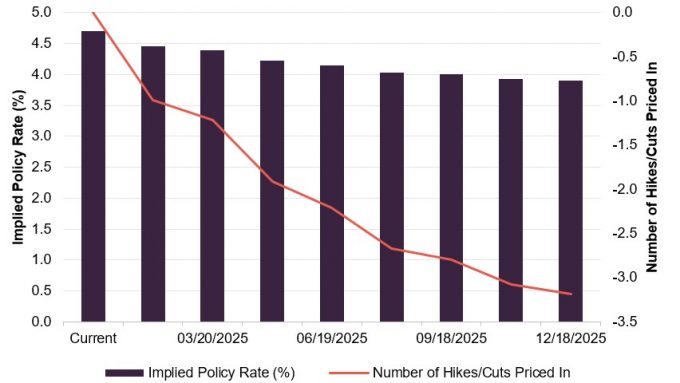
Source: Bloomberg
Improving economy
Outside of the external influence of the US treasury markets, economic prospects in the UK have improved significantly since this time last year.
Positively, we believe that the backdrop for UK equities continues to be supportive. The BoE remains committed to easing monetary policy, and outside of the external influence of the US treasury markets, economic prospects in the UK have improved significantly since this time last year. In fact, much of the underlying domestic inflation is a result of real wage growth across the economy. This should be seen as a positive, especially if the new government’s “unashamedly pro-growth approach’’, which includes initiatives and regulatory reforms to speed up capital deployment and business development, can work to drag the market out of its long-running productivity slump.
The RIII managers note that the fundamentals of the economy remain in good shape. Compared to previous business cycles, there is very little financial risk in the system with healthy corporate balance sheets, solid employment data, and resilience in the housing market suggesting all the component parts are in place for a cyclical upswing.
Crucially, these conditions are set against an equity market that still trades at a steep discount to its historic average, especially across the small- and mid-cap universe, which remains the focus of RIII.
Figure 3: World markets: 12m forward PE ratios
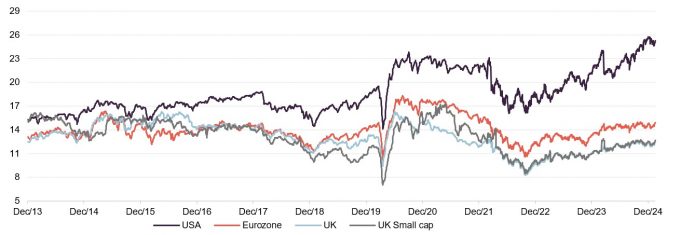
Source: RIII
The valuation story for UK equities is nothing new. However, one piece of evidence that suggests that investors have finally started to appreciate the value on offer is the strength of corporate dealmaking, with takeovers of listed UK companies now comfortably ahead of their 2019 peak, and well above long-term averages. The average premium paid is also up strongly, rising roughly 20% above pre-pandemic levels. We have seen additional momentum from the IPO market and a significant increase in the volume of share buybacks, including repurchases made by the RIII board, all of which supports the long-held view of the managers that valuations in the UK have become completely detached from the fundamentals.
There appears to be considerable optimism across the UK investment landscape around this nascent growth, and as evidenced by the performance over the first nine months of 2024, when sentiment does change, this can happen quickly. We also expect that the current backdrop should be particularly supportive for RIII’s investment style as high-conviction active managers. As we discuss in the asset allocation section, the wide dispersion of returns has created a wealth of opportunities for the managers to invest in quality companies trading at deep discounts to their historic averages. This is especially true in the small- and mid-cap sectors, which have been hit hardest by the increased interest rate volatility.
Takeovers of listed UK companies are now comfortably ahead of their 2019 peak
Asset allocation
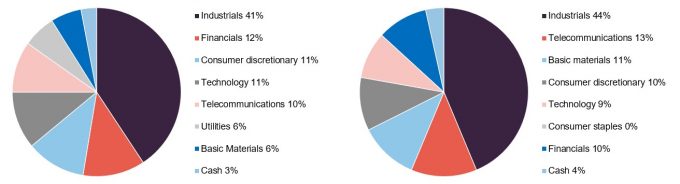
As we have discussed in our recent coverage, Matt and the team have been steadily fine-tuning the RIII portfolio to improve its resilience and better reflect their views and the structural changes that we have seen across the economy over the last few years. Whilst it remains a targeted, high-conviction portfolio, they have reduced its concentration and exited some of the more illiquid holdings. An effort has also been made to increase the sectoral diversification, reducing the traditional exposure to industrials and engineering while adding positions in technology and financial services.
As of 31 December 2024, the top 10 holdings account for 58.0% of the trust, compared to 76% at the beginning of 2023
This resulted in a considerable amount of portfolio turnover in recent years; however, by design it remains a low-turnover, high-conviction vehicle and the managers believe they have now achieved the vast majority of the desired restructuring.
As of 31 December 2024, the top 10 holdings accounted for 58.0% of the trust, compared to 76% at the beginning of 2023, with positions across 22 different companies, plus a 3.0% allocation to cash.
Figure 4: RIII sector allocation at 31 December 2024
Figure 5: RIII sector allocation at 30 June 2024
Source: Jupiter Asset Management
Source: Jupiter Asset Management
Portfolio changes
There were two forced changes to the portfolio during the year following the acquisitions of Gresham Technology and Spirent Communications, which were discussed in our previous note. While they resulted in a significant uplift for the portfolio, Matt notes that this is a double-edged sword, with both companies identified as staple holdings capable of compounding earnings over a long period of time. In order to maintain the trusts technology exposure, software technology company GB Group, which specialises in fraud prevention, was added.
There have been three additions and one sale to the portfolio since we last published.
Since we last published, the managers have made one additional sale – Spirax Engineering. This was part of the original portfolio before Jupiter took over as the investment adviser (see our commentary on this here). Matt and the team were of the view that the company no longer aligned with the make-up of the portfolio, given its scale, and additional concerns around its margin outlook prompted the sale.
There have also been three additions: alternative asset manager Foresight Group, industrial designer and bathroom and kitchen hardware specialist Norcros, and UK recruiter SThree.
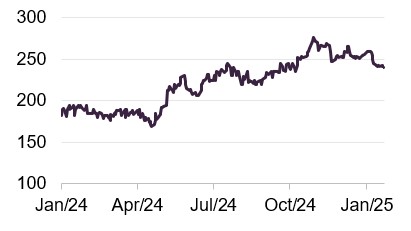
Foresight Group
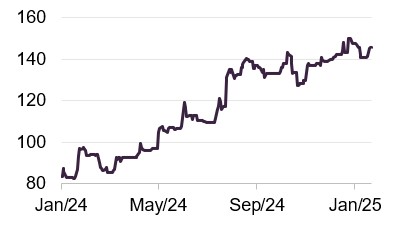
Figure 6: Foresight Group
Source: Bloomberg
Foresight Group is a favourite across the Jupiter desk, and is a company which Matt has targeted to increase the diversification of the RIII portfolio while helping address the current underweight to the financial sector.
The alternative asset manager specialises in two main areas: renewable energy and related infrastructure investments, and regional private equity (PE) in the UK. It has carved out an increasingly attractive niche, providing relatively small ticket size funding, around £1m-£10m, to companies outside of the normal scope of traditional PE, often backed by local authorities or pension funds. These generally have mandates to invest in local areas with a goal to drive economic development, and social and environmental benefits. Investments are sector-agnostic, but target companies requiring external funding for growth, and have traditionally generated strong fees over relatively long investment periods.
Foresight’s infrastructure investments have proved to be more challenging in recent times due to macroeconomic conditions which have weighed heavily on the sector. AUM growth has been slower than initially hoped and the company’s short-term price action remains closely tied to changes in interest rates, as highlighted in Figure 6. Since the end of September 2024, the shares have fallen more than 30% as yields have headed higher. Despite this, the company has continued to deliver solid operational performance thanks to the strength of its regional PE investments. Due to the resilience of these markets and the expected re-rating of its infrastructure sector exposure as interest rates normalise, the company’s management is increasingly confident around the outlook for the trust, outlining an expectation for profits to double over the next five years, which would drive significant upside for the shares.
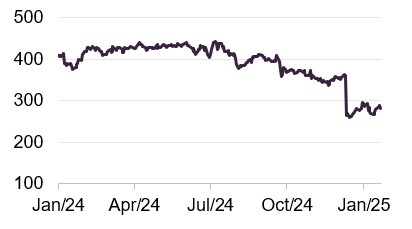
Norcros
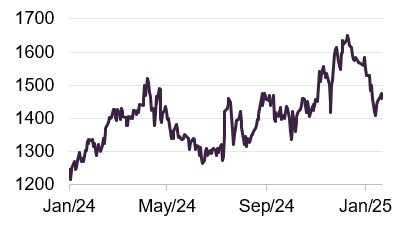
Figure 7: Norcros
Source: Bloomberg
UK bathroom products supplier and manufacturer Norcros is an excellent example of RIII’s investment strategy of targeting excellent companies whose growth prospects are underappreciated by the market. The company has undergone a significant transformation over the past decade, shifting away from its capital-intensive heavy manufacturing roots towards the asset-light, R&D-focused manufacturer we see today. The company now focuses on its increasingly high-value design and distribution verticals in the bathroom products space, and is a market leader in electric showers, enclosures, and wall panelling. Much of the manufacturing is now outsourced, with the management utilising the company’s strong channel and B2B relationships to drive growth, especially when it comes to developing new products.
This updated strategy has been set against a significant reduction in legacy issues that had previously plagued Norcros. In particular, the company has addressed the issues surrounding its pension liabilities, which are now an accounting surplus, while divesting several of its lower-ROI business units.
This strategic transformation has resulted in significant improvements to the company’s operational performance, notwithstanding what has been a challenging trading environment. Despite this, the company trades on a forward price to earnings multiple of just 7.9x, which is well below the 13.7x average for the peer group. In our view, the successful transformation of the business towards a more modern, lean manufacturer remains dramatically underappreciated by the market. Solid organic growth, market share gains, and an active M&A strategy provide additional upside, creating a compelling opportunity at current prices.
SThree
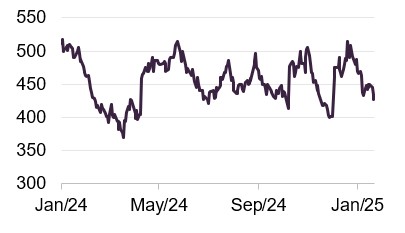
Figure 8: SThree
Source: Bloomberg
UK recruitment agency SThree is another nod towards fund diversification. Specifically, the investment focuses on adding more early-stage business cycle exposure to offset the later-cycle industrial and materials sectors that make up a large portion of the RIII portfolio.
This ties in with the manager’s strategy of balancing portfolio exposure across the growth/value spectrum to reduce volatility and avoid any substantial relative underperformance when particular styles are in or out of favour. It also aligns with their bottom-up approach to investment decisions, rather than attempting to time market cycles.
The managers believe that SThree provides an excellent balance, benefitting from any upswing in economic momentum, with employment generally a solid leading indicator of a market recovery. It also appears to be better positioned than many of its peers to manage risks across the cycle, thanks to its focus on sticky sectors of the economy such as science, tech, engineering and mathematics, providing a better fit for RIII’s long-term approach.
The managers do note that the company has been a poor performer since being added to the portfolio, highlighting the challenges of timing these investments. Although this is unfortunate, the fundamental story behind the investment remains the same, and as a long-term position, the managers remain confident of its ability to re-rate.
Top 10 holdings
Since we last published, there have been three new additions to the top 10, with planning and design software provider Eleco, British airline and travel company Jet2, and ingredients manufacturer and supplier Treatt moving up in place of Alpha Group, Oxford Instruments, and OSB.
Figure 9: 10 largest holdings at 31 December 2024
| Holding | Industry | Percentage of NAV 31/12/2024 (%) | Percentage of NAV 30/06/2024 (%) | Change (%) |
|---|---|---|---|---|
| Renold | Industrials | 7.1 | 8.2 | (1.1) |
| Gamma Communications | Communication services | 6.3 | 6.5 | (0.2) |
| VP | Industrials | 6.1 | 7.7 | (1.6) |
| Macfarlane Group | Consumer cyclical | 6.1 | 6.0 | 0.1 |
| Hill and Smith | Industrials | 6.0 | 7.4 | (1.4) |
| Telecom Plus | Communication services | 5.9 | 5.9 | – |
| Eleco | Communication services | 5.2 | 3.5 | 1.7 |
| Colefax Group | Consumer cyclical | 5.2 | 6.4 | (1.2) |
| Jet2 | Consumer cyclical | 5.1 | 3.7 | 1.4 |
| Treatt | Basic materials | 5.0 | 3.9 | 1.1 |
| Total | 58.0 |
Eleco
Figure 10: Eleco
Source: Bloomberg
Computer-aided design software and AI solutions provider Eleco has been a long-term holding for RIII, with the company’s strong recent performance pushing it into the top 10 holdings. Over the past year, shares are up almost 70% following positive momentum from the build out cycle, and the growing adoption of technology to assist the increasingly complex demands of construction and property management.
Impressive organic growth has been compounded by an active M&A strategy, with the company acquiring the Vertical Digital Group, a software developer and IT consultancy for £ 1.1m early 2024. This appears to have been a strong addition, with the manager believing Vertical Digital will complement Eleco’s own products with its roster of international clients, including Lufthansa Technik, PwC, VW Financial Services, Deloitte and Zoopla.
In January 2025, Eleco announced that it had also acquired SaaS maintenance and management provider PEMAC for €6.0m in cash and up to €2.4m in earn-outs. This appears to be another excellent addition, tapping into the fast-growing regulatory management space across industries such as healthcare and life sciences. The acquisition should be immediately accretive to Eleco’s bottom line and is expected to be highly complementary to its existing maintenance and management operations, allowing Eleco to tap into PEMAC’s impressive list of customers, including Coca Cola, Heineken, and Stryker.
Despite the strong run-up in its shares, the company continues to trade on an attractive valuation as a result of its impressive earnings outlook, with EPS growth expected to be over 30% in 2025. On a forward earnings basis, the company’s P/E ratio of 23x is a steep discount to the peer group average multiple of 30x.
This combination of impressive organic growth, and an active acquisition strategy, should provide considerable optimism going forward.
Jet2
Figure 11: Jet2
Source: Bloomberg
Jet2 is a staple holding across the Jupiter desk, with the UK’s third-largest airline continuing to deliver market share gains and strong fundamental execution. The company offers a relatively unique play on the structural growth opportunities that exist in the travel and leisure market. Whilst still a cyclical and at times volatile industry, it remains one that is exhibiting strong growth with plenty of room for future expansion as passenger numbers climb back above pre-pandemic levels. Despite this recovery, share prices across the sector are still well below recent peaks. Jet2 currently trades on a P/E of just 6.5x, despite its impressive operational results over the past year.
The company continues to benefit from vertical integration across its airline and tour operator, driving up profitability while also improving user experiences, which have contributed to market share gains, particularly in comparison to some of its much-maligned competitors. These are expected to continue, due to the added popularity of its tour arm, which is now the largest in the UK. Management noted that its confidence in this growth is reflected in the group exercising its remaining Airbus order purchase rights. It now has a delivery stream of 146 aircraft delivering through to 2035. Notably, this provides another area of advantage for the company over its competitors, given the supply imbalances created by the issues with Boeing, which could provide a further opportunity for market share gains.
Jet2 also provides RIII with further exposure to growing UK consumer strength which is an area of the market the manager believes is still underappreciated.
Treatt
Figure 12: Treatt
Source: Bloomberg
Treatt is a specialist developer and manufacturer of flavouring and fragrance ingredients, and has been a longstanding holding for RIII. The position is based on the strength of its customer proposition, which has been founded on many decades of research and development expertise. It is seen as a UK-based global champion, although the majority of its revenue is derived from outside the UK. The company experienced a challenging few years following the pandemic, which resulted in a change of CEO in 2023; however, the normalisation of demand trends and an overhaul of the company’s cost base has seen operational performance rebound strongly.
Recent capacity expansions in the UK and US provide further optimism, particularly when set against the current valuation – which remains well below the company’s historical average – and a more than 50% discount to the wider peer group.
Performance
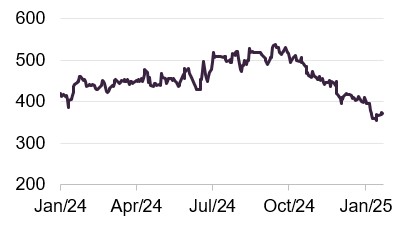
RIII’s performance over the past 12 months can be clearly broken down into two periods, with the trust struggling to continue its strong momentum over the second half of 2024. As we have discussed, the majority of the weakness stems from the rise in bond yields driven by the US, and should not detract from the generally positive outlook for the UK economy, which helped drive the market recovery throughout the first half of 2024.
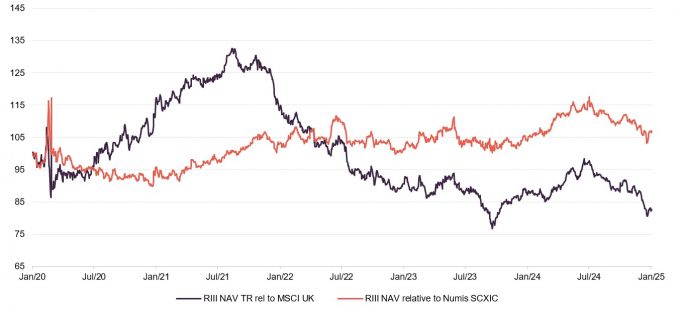
Figure 13 highlights the extent of the weakness experienced over the second half of 2024, especially in Q4, where the company’s NAV declined by 6.3%. As discussed in the asset allocation section, this fall has occurred despite improving fundamentals across much of the RIII portfolio, and we believe market conditions in the UK are much more reflective of performance in the first half of 2024 than the second.
Figure 13: RIII NAV total return performance versus MSCI UK and Deutsche Numis Smaller Companies plus AIM ex Investment Companies indices over five years ending 31 January 2025
Source: Morningstar, Marten & Co
Figure 14: Total return cumulative performance over various time periods to 31 January 2025
| 3 months(%) | 6 months(%) | 1 year(%) | 3 years(%) | 5 years(%) | |
|---|---|---|---|---|---|
| RIII share price | (4.5) | (14.0) | 4.5 | (10.0) | 2.8 |
| RIII NAV | (3.1) | (11.2) | 10.8 | (4.7) | 18.1 |
| MSCI UK | 6.7 | 5.0 | 17.0 | 31.3 | 43.7 |
| Deutsche Numis SC plus AIM ex Inv Trusts | 0.1 | (2.1) | 7.8 | (8.0) | 9.9 |
| Peer group1 median share price | (2.3) | (7.9) | 5.4 | (7.4) | 6.8 |
Despite the trust having continued to outperform its UK smaller companies peer group in the longer term, the recent weakness has weighed heavily on absolute performance. It should be noted, however, that timing factors also play a role in these returns, with both the three-year and five-year growth rates set against previous all-time highs for the trust. Although there is no doubt that recent results have been disappointing, these point-to-point figures used in the comparison in Figure 14 are perhaps not a fair reflection of RIII’s absolute performance. For reference, when we last published using data from 31 July 2024, RIII five-year NAV return was 46%.
Figure 13 highlights the extent of the weakness experienced over the second half of 2024, especially in Q4 where the company’s NAV declined by 6.3%
As discussed, economic conditions over the past few years have been especially difficult for small caps, with the sector highly sensitive to changes in interest rates and growth. In the UK, the issues have been compounded by domestic struggles and negative sentiment. Very few companies have been unaffected, but this has created a situation whereby those who have been able to navigate these challenges, such as RIII, look increasingly well-positioned to benefit as interest rates return to trend and growth steadily improves.
Peer group
Up-to-date information on RIII and its peer group is available on the QuotedData website
RIII is a constituent of the AIC’s UK smaller companies sector, which represents one of the mainstays of the investment trust universe. For the purposes of comparison, we have removed a handful of very small funds, and also Marwyn Value Investors, which follows a very different investment strategy from other members of this peer group.
Figure 15: Peer group comparative data as at 3 February 2025
| Premium/ (discount) (%) | Dividend yield(%) | Ongoing charge(%) | Market cap(£m) | |
|---|---|---|---|---|
| Rights & Issues Investment Trust | (13.5) | 2.0 | 0.9 | 104 |
| Aberforth Smaller Companies | (11.5) | 3.5 | 0.8 | 1,189 |
| abrdn UK Smaller Companies Growth | (10.7) | 2.4 | 0.9 | 342 |
| BlackRock Smaller Companies | (10.7) | 3.3 | 0.8 | 612 |
| BlackRock Throgmorton | (9.3) | 2.5 | 0.5 | 493 |
| Henderson Smaller Companies | (12.6) | 3.3 | 0.5 | 599 |
| Invesco Perpetual UK Smaller Companies | (15.7) | 4.6 | 1.0 | 113 |
| JPMorgan Smaller Companies | (11.9) | 3.4 | 0.6 | 402 |
| Miton UK MicroCap | (11.2) | 0.2 | 1.7 | 35 |
| Montanaro UK Smaller Companies | (10.0) | 4.4 | 0.9 | 174 |
| Odyssean Investment | (0.9) | 0.0 | 1.5 | 204 |
| Oryx International Growth Fund | (34.5) | 0.0 | – | 158 |
| River and Mercantile UK Micro | (16.2) | 0.0 | 1.7 | 60 |
| Rockwood Strategic | 2.3 | 0.3 | 1.6 | 101 |
| Strategic Equity Capital | (10.0) | 1.1 | 1.2 | 145 |
| Median | (11.2) | 2.4 | 0.9 | 174 |
| RIII rank | 12/15 | 9/15 | 6/15 | 12/15 |
RIII discount is slightly wider than the median for the sector. This has been helped by the company’s progressive share buyback programme which has helped to reduce volatility while providing an economic uplift for shareholders. Over the course of 2024, the company bought back 778,881 shares, equivalent to 13.9% of its issued share capital. On 31 July 2024 it was announced that buyback programme would be extended for a further 12 months.
Over 2024, RIII bought back 13.9% of its issued share capital
RIII ranks in the middle of the pack in terms of dividend yield, although in general, this peer group is not managed to produce a yield. The company is smaller than the median fund in the peer group, but still over £100m, which makes it investable for some wealth managers.
Figure 16: Peer group comparative NAV total return data as at 3 February 2025
| 3 months | 6 months | 1 year | 3 years | 5 years | |
|---|---|---|---|---|---|
| Rights and Issues | (3.1) | (11.2) | 10.8 | (4.7) | 18.1 |
| Aberforth Smaller Companies | (2.3) | (8.3) | 12.0 | 10.8 | 23.3 |
| abrdn UK Smaller Companies Growth | 0.3 | (2.9) | 15.1 | (12.7) | (0.0) |
| BlackRock Smaller Companies | (4.4) | (10.0) | 2.5 | (14.9) | (0.5) |
| BlackRock Throgmorton Trust | (3.2) | (7.9) | 4.4 | (13.6) | 6.8 |
| Henderson Smaller Companies | (1.9) | (8.9) | 6.2 | (16.1) | (1.7) |
| Invesco Perpetual UK Smaller | (9.0) | (14.3) | (2.6) | (22.0) | (11.1) |
| JPMorgan Smaller Companies | (0.6) | (7.0) | 10.5 | (3.9) | 21.5 |
| Miton UK Microcap | (0.1) | (6.4) | (5.4) | (43.2) | (2.4) |
| Montanaro UK Smaller Companies | (1.3) | (4.6) | 5.0 | (6.9) | (5.4) |
| Odyssean Investment Trust | (3.0) | (9.1) | (2.3) | (4.1) | 36.7 |
| Oryx International Growth | (3.5) | (4.2) | 4.9 | (7.4) | 40.2 |
| River and Mercantile Micro Cap | 2.5 | (5.5) | 13.7 | (25.6) | 6.5 |
| Rockwood Strategic | 3.4 | 1.1 | 30.6 | 60.8 | 125.8 |
| Strategic Equity Capital | (5.7) | (12.7) | 5.4 | 0.9 | 23.0 |
| Median (wider group) | (2.3) | (7.9) | 5.4 | (7.4) | 6.8 |
| RIII rank (wider group) | 11/15 | 14/15 | 5/15 | 6/15 | 7/15 |
| Median (concentrated group)1 | (2.3) | (8.3) | 6.2 | (12.7) | (0.0) |
| RIII rank (concentrated group) | 6/9 | 8/9 | 3/9 | 3/9 | 3/9 |
Figure 16 highlights the wide dispersion of returns across the UK smaller companies sector. This has increased significantly since the pandemic as a result of the range of different investment styles. For example, the leading investment companies such as Rockwood Strategic and Odyssean have adopted an activist value strategy, which has proven to be successful given the recent prevalence of M&A activity that we discussed earlier. Because of the wide range of investment mandates, the RIII manager has suggested that a more concentrated group would be useful for comparison. This group, highlighted in blue, excludes Aberforth Split Level Income (on structural grounds), abrdn Smaller Companies Income (given its income mandate), the two micro-cap funds (Downing, Miton and River & Mercantile), and those with some element of an activist approach (Crystal Amber, Odyssean, Oryx, Rockwood, and Strategic Equity Capital).
The calculation period used over three and five years is very unfavourable as it corresponds with previous market peaks
Also evident is how poor the performance has been across the entire sector. There is no doubt that the last few years have been a challenging time for many of these companies. However, as we have discussed, the calculation period used, particularly for the longer-term returns over three and five years, are very unfavourable as they correspond with previous market peaks. Despite the recent weakness, RIII remains one of the best-performing trusts over these periods, due to its high-conviction long-term investment approach and diversified exposure across investment styles, which have reduced the cyclical risks experienced by a number of other trusts.
As noted, the manager has broadened the sectoral allocations across areas such as technology and financials, adding exposure to select growth-orientated assets alongside its more traditional value selections. As we highlight in the asset allocation section, this has already proved its value, and we expect the increased diversification of the fund to generate increasingly stable returns going forward.
RIII portfolio provides diversified exposure across investment styles.
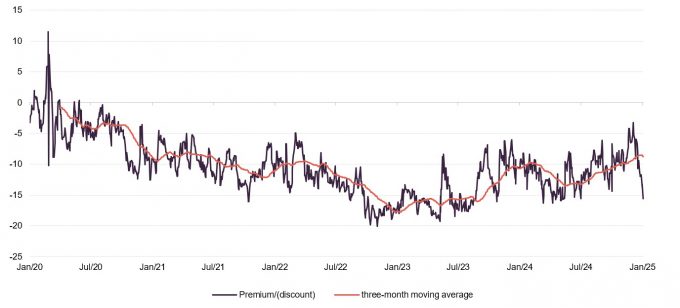
Premium/(discount)
Over the past 12 months, RIII’s shares have traded on an average discount of 11.0%, a high of 3.3%, and a low of 16.3%. As of publishing, the discount stood at 13.4%.
Figure 17: RIII premium/discount over five years to 31 January 2025
Source: Morningstar, Marten & Co
Fund profile
Rights and Issues Investment Trust (RIII) aims to generate a total return that exceeds its benchmark index, the FTSE All Share, over the long term while managing risk. The company invests in equities with an emphasis on UK smaller companies, which will normally constitute at least 80% of its investment portfolio. For the purposes of RIII’s portfolio construction, “UK smaller companies” is deemed to include both listed securities and those admitted to trading on the Alternative Investment Market (AIM). The benchmark does not influence portfolio construction.
More information is available on the manager’s website
For the purposes of this note, we have used the MSCI UK Index as a proxy for the FTSE All-Share and added a comparison to the Numis Smaller Companies plus AIM ex Investment Companies Index, which we believe is more representative of the stocks in RIII’s portfolio.
RIII’s AIFM has delegated investment management of the trust to Jupiter Asset Management Limited. Dan Nickols and Matt Cable took over responsibility for the trust in October 2022. Dan retired at the end of July 2024 and Matt became lead manager, supported by Tim Service.
Previous publications
Readers interested in further information about RIII may wish to read our previous notes.
| Title | Note type | Publication date |
|---|---|---|
| Under new management, same high conviction approach | Initiation | 18 April 2023 |
| Old dog, new tricks | Update | 19 December 2023 |
| Lights and tunnels | Annual overview | 20 August 2024 |
IMPORTANT INFORMATION
This marketing communication has been prepared for Rights and Issues Investment Trust Plc by Marten & Co (which is authorised and regulated by the Financial Conduct Authority) and is non-independent research as defined under Article 36 of the Commission Delegated Regulation (EU) 2017/565 of 25 April 2016 supplementing the Markets in Financial Instruments Directive (MIFID). It is intended for use by investment professionals as defined in article 19 (5) of the Financial Services Act 2000 (Financial Promotion) Order 2005. Marten & Co is not authorised to give advice to retail clients and, if you are not a professional investor, or in any other way are prohibited or restricted from receiving this information, you should disregard it. The note does not have regard to the specific investment objectives, financial situation and needs of any specific person who may receive it.
The note has not been prepared in accordance with legal requirements designed to promote
the independence of investment research and as such is considered to be a marketing
communication. The analysts who prepared this note are not constrained from dealing
ahead of it, but in practice, and in accordance with our internal code of good conduct, will refrain from doing so for the period from which they first obtained the information necessary to prepare the note until one month after the note’s publication. Nevertheless, they may have an interest in any of the securities mentioned within this note.
This note has been compiled from publicly available information. This note is not directed
at any person in any jurisdiction where (by reason of that person’s nationality,
residence or otherwise) the publication or availability of this note is prohibited.
Accuracy of Content: Whilst Marten & Co uses reasonable efforts to obtain information from sources which we believe to be reliable and to ensure that the information in this note is up to date and accurate, we make no representation or warranty that the information contained in this note is accurate, reliable or complete. The information contained in this note is provided by Marten & Co for personal use and information purposes generally. You are solely liable for any use you may make of this information. The information is inherently subject to change without notice and may become outdated. You, therefore, should verify any information obtained from this note before you use it.
No Advice: Nothing contained in this note constitutes or should be construed to constitute investment, legal, tax or other advice.
No Representation or Warranty: No representation, warranty or guarantee of any kind, express or implied is given by Marten & Co in respect of any information contained on this note.
Exclusion of Liability: To the fullest extent allowed by law, Marten & Co shall not be liable for any direct or indirect losses, damages, costs or expenses incurred or suffered by you arising out or in connection with the access to, use of or reliance on any information contained on this note. In no circumstance shall Marten & Co and its employees have any liability for consequential or special damages.
Governing Law and Jurisdiction: These terms and conditions and all matters connected with them, are governed by the laws of England and Wales and shall be subject to the exclusive jurisdiction of the English courts. If you access this note from outside the UK, you are responsible for ensuring compliance with any local laws relating to access.
No information contained in this note shall form the basis of, or be relied upon in connection with, any offer or commitment whatsoever in any jurisdiction.
Investment Performance Information: Please remember that past performance is not necessarily a guide to the future and that the value of shares and the income from them can go down as well as up. Exchange rates may also cause the value of underlying overseas investments to go down as well as up. Marten & Co may write on companies that use gearing in a number of forms that can increase volatility and, in some cases, to a complete loss of an investment.