Geared to growth
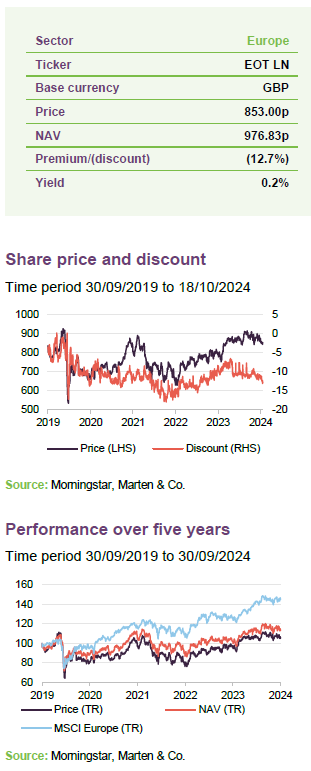
European Opportunities Trust (EOT), demonstrably the most growth-focused of its peers (see page 18), has posted decent absolute returns during the last couple of years but appears to have been held back by its strong growth focus in an environment where inflation has been more stubborn than markets have anticipated. There are signs that this could be changing and, if the growth outlook deteriorates, EOT’s focus on more resilient B2B businesses could be beneficial, and more likely so if previously-robust consumer spending continues to show signs of faltering.
In the meantime, the manager has been using negative sentiment towards Europe and periods of heightened volatility to add to the portfolio where it sees attractive valuations. EOT’s low double-digit discount may also offers an opportunity. The board has been active in making NAV-accretive repurchases.
Capital growth from ‘special’ European companies
The objective of the company is to achieve long-term capital growth by investing in a portfolio of securities of European companies and in sectors or geographical areas which are considered by the investment manager to offer good prospects for capital growth, considering economic trends and business development. The manager looks for ‘special’ companies – these are considered niche winners in their respective fields that can flourish in a range of economic scenarios.
| Year ended | Share price total return (%) |
NAV total return (%) |
MSCI Europe total return (%) | MSCI Europe Growth total return (%) | MSCI World total return (%) |
| 30/09/20 | (19.0) | (11.3) | (4.9) | 8.1 | 5.8 |
| 30/09/21 | 20.7 | 18.0 | 22.7 | 18.8 | 24.1 |
| 30/09/22 | (20.7) | (17.2) | (8.6) | (13.9) | (2.5) |
| 30/09/23 | 26.0 | 17.5 | 18.6 | 13.9 | 12.1 |
| 30/09/24 | 7.8 | 11.1 | 14.7 | 15.3 | 21.1 |
Source: Morningstar, Marten & Co.
Market outlook and valuations
European economies have had a difficult couple of years
Compared to the US, European economies have had a difficult couple of years. European growth, while finally showing signs of some improvement this year, has looked anaemic in comparison to other regions and uncertainty regarding the economic outlook remains. The euro area manufacturing PMI for September 2024 was 44.8, down from 45.8 the month before, suggesting further contraction, and while still modestly expansionary, the outlook for services has shown a marked deterioration with its PMI coming in at 50.5 in September, down from 52.9 a month earlier (ICT being one of the highlights, as it has exhibited strong growth).
The difference in the outlook for manufacturing and services has prevailed for some time and reflects the fact that manufacturing output continues to drag on economic activity within the bloc – particularly in Germany and Italy (the former being more sensitive than most to China’s economy due its significant exports to the region, although this could shift given the large stimulus the Chinese government has put in place).
While risks remain, the war in Ukraine, previously a significant concern, seems to have ground itself into a stalemate, at least for now. Europe has continued to make progress in addressing its energy security, but higher energy prices remain a problem which has affected energy intensive industries (for example chemicals).
Employment has continued to rise, and consumer confidence has improved in recent months
Employment has continued to rise in Europe and, while the pace of growth has been slowing, this and real wage growth appear to have supported consumer expenditure. Consumer confidence has showed improvement in recent months (in contrast to business confidence) although, perhaps reflecting the shifting mood, wage growth exceeded consumer spending growth as consumers added to their savings.
0.5% cut in interest rates as inflation falls
We finally saw the first rate cut of 25bp from the European Central Bank (ECB) in June, which was followed in September by an additional 25bp reduction. The June cut was ‘nearly unanimous’ (Robert Holzmann, the governor of Austria’s central bank, being the one dissenting voice) and the September cut was unanimous. Inflation rose from 2.5% in June to 2.6% in July, before falling to 2.2% in August and then 1.8% for September, below the ECB’s 2% target.
Not surprisingly, services inflation has been higher than the composite – around 4.0%. However, the drivers of inflation have been quite different across the euro area, which makes the ECB’s task all the harder. In reporting on its September rate decision, it lowered its growth outlook slightly, while maintaining its headline inflation guidance and raising its forecast for core inflation for the remainder this year and next.
As is illustrated in Figure 1, which shows the performance of European equities, European growth equities, and broader global equities over the last five years, global markets (driven by the US and the superior economic data coming out of there) have maintained their lead over Europe. At the same time, uncertainty and the associated volatility in Europe’s financial markets has remained.
Figure 2 shows that valuations, while a bit firmer than when we last published in November 2023, are close to or below their five-year averages in Europe – F12m P/E of the MSCI Europe Index is 15.8x, which is 3.7% below its five-year average, and 41.4% below its five-year high; while the MSCI Europe Growth Index is trading at 27.4x, which is 1.5% above its five-year average and 32.9% below its five-year high. In comparison, global equities have become even more expensive in relative terms – the MSCI World Index is trading at 23.3x, which is 11.1% above its five-year average and 23.9% below its five-year high.
Figure 1: Index total return performance over five years, rebased to 100
Figure 2: Index F12m P/E ratios over five years
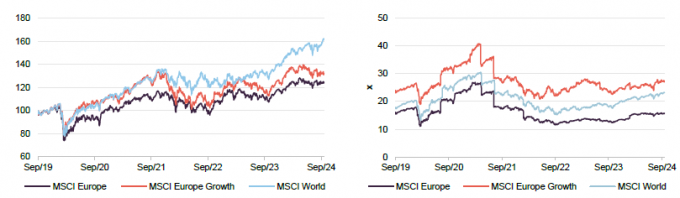
Source: Bloomberg, Marten & Co
Source: Bloomberg, Marten & Co
Manager’s view – inflation receding, recession risk has increased
Forecasting macroeconomics is hard, so EOT’s manager is focused on ‘special companies’
EOT’s manager comments that, while the direction of interest rates is always an important factor for equity markets, higher volatility during the last couple of months illustrates how challenging it is to predict the macro. Only recently, the US Fed was suggesting that it had achieved a much-hoped-for soft landing, but with inflation dropping in recent months, financial markets are increasingly concerned it seems about the prospects of a recession, and it is a similar story in Europe. EOT’s manager thinks that proper visibility over the macro is difficult to achieve, which is why it prefers to focus on its ‘special companies’ – which it describes as niche winners in their respective fields that can flourish in a range of economic scenarios.
Reflecting this, commodities, banks and utilities are not a feature of the portfolio. Instead, positions in technology, healthcare, industrials and media are the key areas of focus. The manager believes that change can often present opportunities, and the key themes within the portfolio at present are:
- Healthcare – Novo Nordisk, Camarus, bioMérieux, Genmab, Grifols and Bachem;
- Alternative finance – Deutsche Boerse, Worldline, Edenred, BFF Bank, and Intermediate Capital;
- Cybersecurity – RELX/Experian, Yubico, BAE Systems/Thales; and
- AI – BE Semiconductor, Experian/RELX, Infineon/Prysmian.
Previously, AI and cybersecurity were encapsulated within ‘Digital technologies’, but given the developments in these spaces, the manager considers them to be key themes in their own right. As can be seen above, holdings can feature in more than one theme.
The manager sees threats from the retreat from globalisation, bigger governments and higher debt burdens, particularly in the aftermath of COVID, inflation and Russia. It feels that the consumer continues to look exposed, but EOT’s portfolio, with its B2B focus because the manager sees such businesses as fundamentally more resilient, has low consumer sensitivity. The manager believes that its focus on structural ‘game changing’ opportunities gives the portfolio an asymmetric risk profile that remains skewed heavily to the upside over the longer term.
AI is helping to drive productivity across the board
AI is driving increased productivity, and while the focus is on the US, where the bulk of AI-related technologies are being developed, all regions should benefit. However, EOT’s manager does not think this will reverse the longer-term structural trend of Europe growing more slowly than the US. The manager says that Europe is also pushing decarbonisation more aggressively than other regions and, while this offers a path to greater energy security, higher energy costs are likely to continue to weigh on economic growth.
European political risk
EOT’s manager considers the European political scene is challenging on a number of fronts at present – highlighting the French elections, in particular, as shifting the dial on political risk in Europe. In response to poor results for his coalition in the European Parliamentary elections, President Macron called a snap election in an attempt to shore up support, but the far-right National Rally (RN) and its allies won by a clear margin in the first round. The left quickly assembled an alliance – the New Popular Front Alliance – pushing Macron’s centrist coalition into second place and RN into third. EOT’s manager thinks that Macron made a clear error of judgement, and the disruption has weighed on French equities. It notes that some of EOT’s worst performers recently have been French stocks, but adds that these are world-leading global businesses, so this does not really make sense.
The manager adds that in the UK, the opposite has been true. Sunak’s decision to call a snap election saw Labour returned with a huge majority and, while the honeymoon period appears to be over, the UK appears to have entered a period of greater political stability.
Germany, the key motor for growth in Europe, has also seen far right parties – in particular, the Alternative für Deutschland (AfD) – polling strongly in recent state elections (this is despite being classified as right-wing extremists in several states by Germany’s intelligence services). At the same time, EOT’s manager thinks that the economic outlook for Germany is particularly concerning, although this has been overlooked given the political backdrop. One issue it says is that Germany is more sensitive to China’s output than other European countries because of its level of manufacturing exports. EOT’s manager cites the example of Volkswagen, where the company has fallen behind on a €10bn cost-cutting drive, initiated in December. Management now say that the programme doesn’t go far enough for it to hit its goal of a 6.5% operating margin by 2026. EOT’s manager adds that the company is struggling against a backdrop of rising competition and is looking at closing plants and cutting jobs, having issued a profit warning in July 2024. EOT’s manager highlights that this is not an isolated example.
Possibly as a consequence, funds continue to flow out of European equities. However, EOT’s manager has seen this as an opportunity and says that it has been taking advantage of volatility in markets, with turnover increasing as a result (EOT’s portfolio turnover is quite low over the long term).
Defence holdings for the first time in 25 years
EOT’s manager has, in a first in its history, added defence stocks to the portfolio. It says that the war in Ukraine and escalating problems in the Middle East have had a marked effect in the sector, with governments now more prepared to spend significant sums and to comply with NATO targets. EOT’s manager says companies still need a differentiated product to succeed, but it sees years of potential growth ahead for the defence sector. It cites the letter of intent signed by both Rheinmetall and Continental to provide the latter’s employees with opportunities to work at the defence company (it is the third such agreement that Continental has come to). EOT’s manager highlights that, while the German automotive parts company is struggling, the defence industry is booming and desperate to attract workers.
EVs
EOT’s managers highlight this as the second biggest area of weakness in Europe after consumer discretionary stocks. The auto industry it says is struggling, sales growth has slowed, the shift to EVs has also slowed, and Chinese demand (an important export market) for European cars has shrunk. With share prices in the sector falling, EOT’s manager has added to Infineon Technologies (see page 11) and Dassault Systèmes (see page 17), both of which are heavily exposed to the automotive market. EOT’s manager thinks that, structurally, these companies are well placed – it explains they are growing but just not quite as fast as they were, reflecting the fact that their end markets are having a torrid time, but it feels this should be temporary.
Signs that consumer confidence is weakening
As noted above, consumer expenditure has showed resilience, but there are signs that it is now weakening in a number of areas, and this could accelerate if we move closer to a recession in Europe. EOT’s manager thinks that its portfolio is relatively well positioned for any deterioration in consumer spending. As noted above, EOT tends to focus on B2B businesses, which it believes to be generally more resilient in times of distress, and it also points to a good level of exposure to business staples and non-discretionary healthcare spending.
Asset allocation
Concentrated portfolio of European equities
As at 30 September 2024, EOT’s portfolio had exposure to 28 securities (down from 30 securities as at 30 September 2023, the most recently available information when we last published). EOT’s portfolio is concentrated; it typically has exposure to between 26 and 35 securities (an average position size of around 3%), but actual position sizes can vary quite markedly (depending on valuation and the manager’s level of conviction). The top 10 holdings tend to account for around 70-80% of the portfolio, with a tail of smaller positions. As illustrated in Figure 10, the top 10 holdings accounted for 71.3% of EOT’s portfolio (as a proportion of net assets) as at 30 September 2024, fractionally down from 72.2% when we last published.
EOT’s portfolio is distinctly different from its benchmark.
The portfolio is distinctly different from its benchmark, the MSCI Europe, with an active share in the region of 92%. While EOT’s portfolio is focused on companies in developed Europe, these have a more global reach, as is illustrated in Figure 3. As is illustrated in Figure 4, EOT’s portfolio also has a much greater allocation to mid-cap stocks versus the benchmark.
Figure 3: EOT weighted average sales by region as at 30 September 20241
Figure 4: EOT market cap split as at
30 September 2024
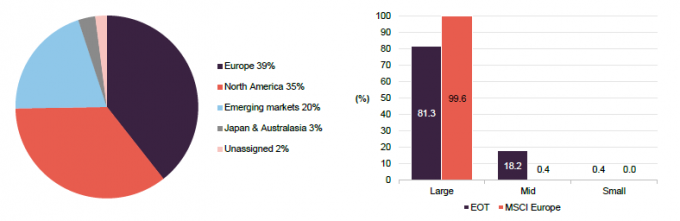
Source: European Opportunities Trust. Note: 1) Excluding cash.
Source: European Opportunities Trust
Geographic allocation
Figure 5: EOT geographic allocation as at 30 September 20241
Figure 6: EOT geographic allocation as at 30 September 20231
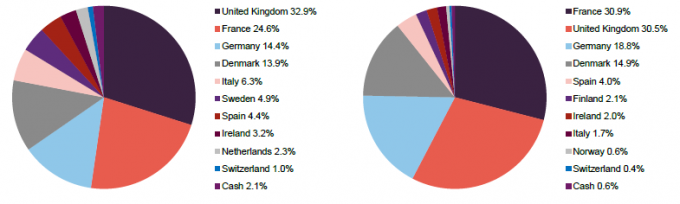
Source: European Opportunities Trust. Note: 1) as a proportion of net assets.
Source: European Opportunities Trust. Note: 1) as a proportion of net assets.
A comparison of Figures 5 and 6, which show EOT’s geographic allocation as at 30 September 2024 and a year prior, illustrates that the main changes have been an increase in exposure to Sweden, Italy, the UK, the Netherlands and Ireland with reductions to France, Germany and Denmark – these figures are calculated on a net assets basis and so the increase in overall allocation reflects an increase in net gearing between the two points. The UK, France, Germany, and Denmark remain the largest allocations, although the significant reduction in the French allocation reflects the retrenchment of that market in the aftermath of the snap election (see page 5), according to the manager. Norway and Finland have been exited altogether, while Sweden and the Netherlands have made new appearances. It should be remembered that, like the sectoral allocations below, the geographic allocations are a result of the manager’s stock selection decision, and the manager is not targeting weights in any region or sector. These are global companies and that, as is illustrated in Figure 3, their sales tend to be much more global too and therefore much less dependent on Europe, which accounted for 39% of sales as at 30 September 2024.
Sectoral allocation
Figure 7: EOT sectoral allocation as at 30 September 20241
Figure 8: EOT sectoral allocation as at 30 September 20231
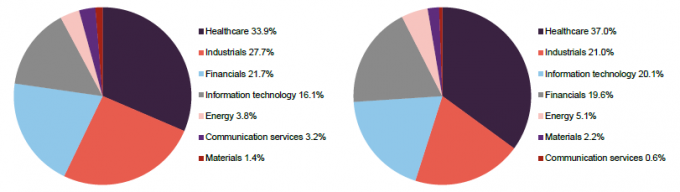
Source: European Opportunities Trust. Note: 1) as a proportion of net assets.
Source: European Opportunities Trust. Note: 1) as a proportion of net assets.
Comparing Figures 7 and 8, which show EOT’s sectoral allocations as at 30 September 2024 and a year prior, the main differences are an increase in the allocations to industrials, communication services, and financials; and decreases in the allocations to information technology, healthcare, and energy. All other changes are less than one percentage point.
Healthcare and industrials have been EOT’s largest sectoral allocations for some time, with financials replacing information technology in third place. Readers may want to note that EOT’s financials exposure is overwhelmingly alternative finance – there is no exposure to mainstream banks or insurance companies. EOT’s holding in Darktrace was sold following a bid from the private equity firm Thoma Bravo (see pages 15 and 16) and the position in Bayer has also been sold in its entirety (see page 12). The manager has also initiated a position in Camurus – discussed below.
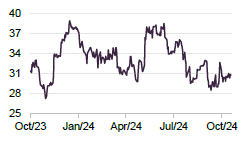
Camurus – game-changing FluidCrystal technology
Figure 9: Camurus (SEK)
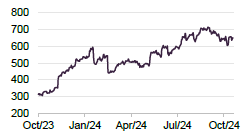
Source: Bloomberg
Camurus (www.camurus.com) describes itself as a Swedish science-led pharmaceutical company committed to developing and commercialising innovative and long-acting medicines for the treatment of severe and chronic diseases. It has an effective treatment for opioid use disorder, Buvidal, which EOT’s manager thinks is particularly interesting, highlighting that this is a significant problem, particularly in the US (The Lancet describes the opioid epidemic as one of the worst public health disasters affecting the USA and Canada, adding that: “over the past two decades, nearly 600,000 people have died from an opioid overdose in these two countries, and an estimated 1.2m people could die from opioid overdoses by 2029”).
EOT’s manager notes that there is a lot of political pressure to find a solution to the opioid epidemic, as well as funding available to help deal with the problem. It says that Camurus’s product removes the cravings that drive the addiction. The active ingredient in the drug is actually off-patent, but the therapy utilises Camurus’s patented FluidCrystal technology. This can be paired with an existing pharmaceutical – which already has established efficacy and safety characteristics – to slow its release, making it longer-acting. The manager explains it can therefore improve treatment outcomes, provide greater convenience, increase life quality for people with serious conditions, and can be more cost-effective than existing treatments.
Buvidal was first launched in Sweden, and following success there, was rolled out in Australia, where it has also done well. The drug has now been launched in the US, where EOT’s manager says it is having real success. EOT’s manager thinks that Camurus’s FluidCrystal technology could be game-changing in a number of areas, for example in GLP-1 inhibitors to treat obesity.
Top 10 holdings
Figure 10 shows EOT’s top 10 holdings as at 30 September 2024, and how these have changed since 30 September 2023 (the most recently available information when we last published). Reflecting the long-term nature of the manager’s investment approach, changes in the composition of the top 10 tend to reflect the relative performance of EOT’s large holdings.
New entrants to the top 10 are Intermediate Capital Group, Prysmian and Infineon Technologies. Names that have moved out of the top 10 are bioMérieux, Bayer and Soitec.
We discuss some of the developments in the next few pages. Other holdings have been discussed in our initiation note and readers may wish to refer to this (see page 25 of this note).
Figure 10: Top 10 holdings as at 30 September 2024
| Holding | Sector | Country | Allocation 30 September 2024 (%) | Allocation 30 September 2023 (%) | Percentage point change |
|---|---|---|---|---|---|
| Novo Nordisk (B) | Healthcare | Denmark | 12.4 | 13.5 | (1.1) |
| Experian | Industrials | UK | 8.9 | 8.6 | 0.3 |
| Dassault Systèmes | Information technology | France | 7.9 | 7.8 | 0.1 |
| Deutsche Boerse | Financials | Germany | 7.8 | 6.9 | 0.9 |
| RELX | Industrials | Netherlands | 7.6 | 8.8 | (1.2) |
| Intermediate Capital Group | Financials | UK | 6.1 | 3.5 | 2.6 |
| Genus | Healthcare | UK | 6.0 | 4.6 | 1.4 |
| Edenred | Information technology | France | 5.3 | 7.0 | (1.7) |
| Prysmian | Industrials | Italy | 4.9 | 1.5 | 3.4 |
| Infineon Technologies | Information technology | Germany | 4.4 | 3.0 | 1.4 |
| Total of top 10 | 71.3 | 72.2 | (0.9) |
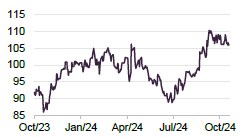
Intermediate Capital Group (6.1%) – structural growth from increasing allocations to private assets
Figure 11: Intermediate Capital share price (GBp)
Source: Bloomberg
Intermediate Capital (www.icgam.com) is an asset management firm that focuses primarily on private equity, credit, and debt investments. In our initiation note (see page 20 of that note), we discussed how EOT’s manager believes that Intermediate Capital is well positioned to benefit from a trend of investment institutions allocating more capital to private markets. The manager says that this trend continues, with the company doing particularly well on the private credit side, where it believes the asset management firm has become the ‘go to’ for these sorts of investments in Europe.
Historically, the company has tended to benefit from an environment of lower interest rates and, with inflation and interest rates receding, the manager expects this should bolster its performance. EOT’s manager notes that Intermediate Capital has a structural advantage as funds are committed for the long-term, which it says should help the company continue to deliver good returns.
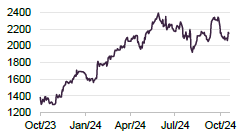
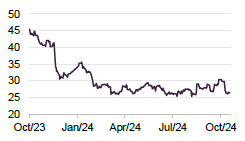
Prysmian (4.9%) – major play on electrification
Headquartered in Italy, Prysmian (www.prysmian.com/en) is a high-performance cable manufacturer that produces underground and submarine cables for power transmission and distribution; special cables for applications in a number of industrial applications; medium- and low-voltage cables for the infrastructure and construction sectors; as well as cables and accessories for voice, video and data transmission for the telecommunications sector.
Figure 12: Prysmian share price (EUR)
Source: Bloomberg
EOT’s manager sees the company as a major play on the long-term structural growth trend of increasing electrification. The company, which was spun out of Pirelli in 2005 (formerly it was called Pirelli Cables & Systems), has an order book of around €20bn (up from c. €15bn pre-COVID), which gives it visibility over its profitability a number of years ahead. EOT’s manager highlights that North America, which currently accounts for over a third of group sales, is the region which is expected to make the greatest contribution to profits growth in the medium term reflecting the pressing need to overhaul and modernise the electricity grid in the US. The managers say that the same is true in Europe, which accounts for over 40% of group sales, but the grid is not as old as that in the US.
EOT’s manager thinks that Prysmian benefits from trade tensions between the US and China and that it will experience additional demand for its products as limitations are put around Chinese imports.
EOT’s manager says that it is inherently wary of businesses that require subsidies to be profitable, which it says applies to a significant proportion of businesses operating in this space in the US (think IRA and CHIPS ACT), but notes that Prysmian does not need subsidies to be profitable.
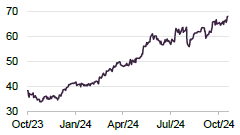
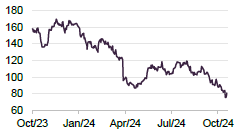
Infineon Technologies (4.4%) – taking advantage of sales slow down
Figure 13: Infineon Technologies share price (EUR)
Source: Bloomberg
Headquartered in Germany and listed on the Frankfurt exchange, Infineon Technologies (www.infineon.com) is Germany’s largest semiconductor manufacturer. It was spun out of Siemens AG in 1999 and has grown so that last year it had over €16bn of revenues, employed 58,600 people and had 17 manufacturing locations and 69 R&D locations. It is structured around four main divisions: automotive; green industrial power; power & sensor systems; and connected secure systems, and EOT’s manager feels that it is well-placed to benefit from the long-term structural growth trends relating to decarbonisation and digitalisation.
EOT’s manager highlights that over half of Infineon’s business is focused on the EV market, and the quantum of semiconductors used in vehicles has gone up dramatically depending on the model (a traditional internal combustion engine vehicle contains between 100 and 300 semiconductor chips, while modern EVs tend to contain between 1,000 and 3,000 units). Infineon also manufactures DC inverters for cars and fast-charging ports. The move to high-speed charging requires more silicon carbide products (high-end) which Infineon has, as well as some older silicon-based products. EOT’s manager says that Infineon has years of experience in supplying auto manufacturers and has established itself as a trusted partner to these companies. It adds that the company is also the market leader in a number of areas and that, combined, these factors make it hard for start-ups to get a foothold in the sector. The manager comments that, at present, Infineon is losing a tiny bit of market share at the bottom end of the value chain to Chinese competitors, but adds that it is gaining at the top, which more than compensates for this. However, EOT’s manager thinks that pressure at the bottom end may recede. It thinks that Infineon will be a beneficiary of Western trade disputes with China, as it sees Chinese companies facing further hurdles out across the value chain.
bioMérieux – getting traction in point of care settings
Figure 14: bioMérieux share price (EUR)
Source: Bloomberg
bioMérieux (www.biomerieux.com) is a French multinational biotechnology company that is focused on in vitro diagnostics – tests done on samples such as blood or tissue that have been taken from the body – which we discussed in our initiation note (see page 15 of that note). Although bioMérieux did well during the pandemic, its share price has been soft during the last three years as the COVID effect has unwound. Sales growth in 2022 was 0.2% (in constant exchange rate terms), which EOT’s manager felt was acceptable given that 2021 sales had benefited from a significant boost due to COVID. It says 2023 was much better, with like-for-like sales growth of 6.6%. Full-year guidance for the 2024 year is for sales to grow organically between 8%–10%, with consolidated EBIT growing between 12%–17%.
As we discussed in our initiation note, EOT’s manager saw bioMérieux’s purchase of Specific Diagnostics in 2022 as a strong strategic move, as it provides exposure to the market for products that address antimicrobial resistance (AMR). The company’s SPECIFIC REVEAL Rapid AST system provides actionable results from positive blood cultures in an average of five hours. EOT’s manager observed that the company has been getting traction in point of care settings (for example, GP surgeries), and so took the decision to increase the position size modestly. It notes that bioMérieux continues to see good momentum from several of its platforms, which should also sales support growth in the coming years.
Bayer – position sold in its entirety
Figure 15: Bayer share price (EUR)
Source: Bloomberg
Bayer (www.bayer.com/en) is a German multinational pharmaceutical and biotechnology company that is one of the largest globally. Its product areas also include consumer healthcare, agricultural chemicals, seeds, and biotechnology products.
In our initiation note, we discussed how Bayer’s crop science business has faced a number of lawsuits in the US relating to its well-known herbicide, Roundup (reportedly the most popular and profitable weed killer ever sold), which it is alleged can cause cancer. EOT’s manager thinks that the concerns around glycophosphates are irrational – it says that long-term data shows this not to be an issue and the Environmental Protection Agency in the US also says it is safe (the fact that the EPA deems it safe would prohibit Bayer from putting a sticker on its product saying otherwise, placing it in a real catch-22 position).
The Supreme Court in the US was asked to review the case but declined to do so, which EOT’s manager thinks is a political decision that has resulted in a messy legal situation (interestingly, Bayer has recently been winning some cases in relation to this). Reflecting the Supreme Court’s decision, the fact that one of its key products is going off-patent and the headwind to sales Bayer faces from low corn and soya prices, EOT’s manager decided to exit the position in full. The manager says that this has been a good decision as the share price has continued to edge down since.
Soitec – establishing itself in the EV substrate market
Figure 16: Soitec share price (EUR)
Source: Bloomberg
Soitec (www.soitec.com/en) is a French multinational that manufactures high-performance substrates that are used in the manufacture of semiconductors. Soitec’s semiconductor materials are used to manufacture chips which equip smartphones, tablets, computers, IT servers, data centres, cars, and other connected devices. As we discussed in our initiation note, EOT’s manager believes that in a world of a rapidly growing internet of things, Soitec benefits from strong long-term growth drivers, which are bolstered by a substantial defensive moat from its significant intellectual property (IP).
EOT’s manager comments that the company has performed very strongly in the mobile segment (it says you will find Soitec products in all mobile phones, as these regulate the wavelength of the antenna), benefiting from the rollout of 5G. Soitec is seeking to leverage this to break into the market for EV substrates, which should have a strong growth runway, the manager adds. However, EOT’s manager comments that, while having a production facility in place for this, no auto manufacturers have taken this up yet. The slower-than-expected EV market has weighed on Soitec, but the manager thinks it should perform strongly as proof of this new adjacent market comes through and that the company will benefit from the significant investments it has made to increase its production capacity.
Performance
Figure 17: EOT NAV total return performance relative to MSCI Europe and MSCI Europe Growth over five years to 30 September 2024
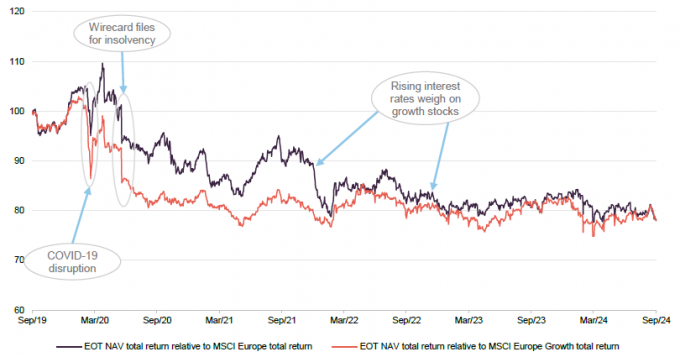
Source: Morningstar, Marten & Co
Like many growth-focused strategies, EOT benefited as markets recovered on the back of the wholesale fiscal and monetary stimulus injected by governments globally to try and prop up their economies following COVID, but its outperformance was cut short by the collapse of Wirecard in June 2020, and although its relative performance has shown signs of stabilising recently, an environment of higher inflation and associated interest rates appears to have weighed on its performance. With inflation now back at target levels and central banks having commenced their interest rate cuts, there is the potential for growth strategies such as EOT’s to outperform again.
Figure 18: Cumulative total return performance over periods ending 30 September 2024
| 1 month (%) | 3 months(%) | 6 months (%) | YTD(%) | 1 year (%) | 3 years(%) | 5 years(%) | 10 years(%) | |
|---|---|---|---|---|---|---|---|---|
| EOT NAV | (4.0) | (2.1) | 1.9 | 2.2 | 11.1 | 8.2 | 13.3 | 136.2 |
| EOT share price | (4.3) | (2.2) | (1.9) | (1.7) | 7.8 | 7.7 | 5.2 | 111.5 |
| MSCI Europe | (1.6) | 0.5 | 1.3 | 7.8 | 14.7 | 24.3 | 45.0 | 121.0 |
| MSCI Europe Growth | (2.5) | (2.2) | (2.1) | 6.5 | 15.3 | 13.1 | 45.3 | 148.8 |
| MSCI World | (0.2) | 0.3 | 3.1 | 13.4 | 21.1 | 32.4 | 73.7 | 232.6 |
| Peer group NAV1 avg. | (2.2) | (2.2) | (2.1) | 5.0 | 15.4 | 11.3 | 50.1 | 154.5 |
| Peer group share price1 avg. | (1.3) | (2.3) | (2.5) | 4.4 | 15.2 | 8.5 | 50.8 | 148.4 |
Performance for the year ended 31 May 2024
EOT’s manager has kindly provided some longer-term performance attribution data for the 12-month period to the end of the last financial year. During this period, EOT provided NAV and share price total returns of 15.5% and 16.5% respectively (in sterling terms). In comparison, the MSCI Europe (EOT’s benchmark) provided a total return of 17.3%.
The data suggests that, over the period, stock picking was a key driver of performance, although stylistically EOT’s above-average exposure to small and mid-sized stocks weighed on its returns, reflecting the more negative sentiment that this segment of the market experienced (anecdotally, the managers believe that many of these companies are significantly undervalued).
Banks performed strongly – buoyed by higher interest rates, strong fee momentum, moderating cost inflation headwinds, lower regulatory costs and benign credit costs that saw earnings come in ahead of expectations, according to the manager. This was a negative for EOT, as it had an underweight exposure to the sector. The managers say that while they recognise that the banks have benefitted from a cyclical tailwind due to rising rates and ongoing low levels of NPLs, they generally avoid business models dependent on high levels of leverage to generate returns above their cost of capital, highlighting that European banks have struggled to generate returns above their cost of capital on a sustainable basis over the longer term.
Top positive contributors to performance for the year ended 31 May 2024
Figure 19: Top five positive contributors to return
| Stock | Total return (%)1 | Relative contribution (%)2 |
|---|---|---|
| Novo Nordisk | 68.2 | 5.4 |
| RELX | 38.7 | 2.8 |
| Darktrace3 | 108.2 | 2.6 |
| Intermediate Capital | 74.9 | 2.9 |
| Experian | 29.3 | 2.2 |
Figure 19 provides the top five contributors to performance for the year ended 31 May 2024. Novo Nordisk, RELX, Darktrace and Experian are discussed below, while Intermediate Capital is discussed in the asset allocation section on page 10.
- Novo Nordisk – a long-time EOT holding that has also been its largest investment for some time, this Danish pharmaceutical company has a strong focus on treatments for Type 1 and Type 2 diabetes and obesity, as well as treatments for haemophilia and growth disorders. The company reported strong profit increases over the last 12 months. Its GLP-1 drugs, for diabetes and weight management, have gained significant traction in many markets; perhaps most importantly, the United States. EOT’s manager says that the anti-obesity part of the business is extraordinary; an almost completely new opportunity that is relevant to the roughly one billion people worldwide that have a BMI of over 30. It adds that recent clinical trial results were very encouraging, with labelling improvements for Wegovy drawing attention to a risk reduction of major adverse cardiovascular events.
- RELX – this B2B data company, which is another long-standing EOT holding and a major investment, describes itself as a global provider of information-based analytics and decision tools for professional and business customers, enabling them to make better decisions, get better results and be more productive. EOT’s manager says that RELX is clearly benefited from the explosion of Generative AI, which is one factor behind the higher growth rates reported in two areas of the company’s business, Risk and Legal. It adds that RELX has for many years developed algorithms which might now be described as AI, and that it has the data sets and domain knowledge that should help maintain good growth rates. The exhibitions side of the business has also rebounded strongly since COVID.
- Darktrace – this British cybersecurity company saw a significant ramp up in its share price following a bid from private equity firm Thoma Bravo, which has built a portfolio of companies focused on this area. EOT invested in Darktrace when it IPO’d in April 2021 and, whilst the exit price was more than twice the IPO price, the manager was disappointed with the outcome, as it felt that it undervalued the company and did not reflect a strong growth runway.
The manager observes that the offer price was a long way off the 2021 share price peak and was still at a big valuation discount to its US peers such as CrowdStrike, but the company had outperformed expectations since IPO by a large margin. In its view, Darktrace was portrayed very negatively in the press – often unreasonably – which blighted its time on listed markets, and this was a significant factor in the company going private. - Intermediate Capital – see page 10.
- Experian – this company, which is a core holding within EOT’s portfolio and has been a major position for some time, is the world’s biggest credit bureau and credit analytics company. As we discussed in our initiation note (see page 13 of that note for more discussion of Experian), EOT’s manager believes that to be successful in the market for credit scoring, you need to be a top-three player.
Experian is strong in the UK, but its biggest markets are the US and Brazil, where it occupies dominant positions, has been growing rapidly and the manager feels the outlook is good. EOT’s manager says that Experian has been vindicated with its differentiated strategy – by developing a consumer-facing credit platform, it says that the company successfully navigated the slowdown in the traditional market for credit bureaus of serving the banks.
Top negative contributors to performance for the year ended 31 May 2024
Figure 20 provides the top five detractors from performance for the year ended 31 May 2024. Edenred, Genus, Dassault Systèmes, Griffols and Worldline are discussed below.
Figure 20: Top five negative contributors to return
| Stock | Total return (%)1 | Relative contribution (%)2 |
|---|---|---|
| Edenred | (27.7) | (1.9) |
| Genus | (27.6) | (1.8) |
| Dassault Systèmes | (10.0) | (1.0) |
| Grifols | (14.7) | (0.6) |
| Worldline | (66.6) | (0.7) |
- Edenred – this company, which describes itself as a leading digital platform for services and payments for employees and employers, focuses on specific-purpose payment solutions for food (such as meal benefits), mobility (such as multi-energy, maintenance, toll, parking, and commuter solutions), incentives (such as gift cards and employee engagement platforms) and corporate payments (such as virtual cards). We discussed it in detail on pages 14 and 15 of our initiation note. The company has been a good long-term performer for EOT, but suffered during the last financial year as concerns about regulatory changes in its main markets, France and Brazil, caused its share price to lag. However, EOT’s manager does not think that that these concerns are a serious threat to Edenred’s position as the leader in its field, and retained the holding.
- Genus – a world-leader in animal genetics with a strong focus on porcine and bovine genetics, Genus analyses animal DNA to look for markers associated with desirable characteristics, so that these can be accurately selected and then used to breed future generations (see page 16 of our initiation note for more discussion). The company’s results suffered from weak performance in the Chinese market – where it has significant exposure, having invested heavily in recent years – as well as delays in the application process for the approval of its gene-edited pigs by the FDA (EOT’s manager says that this is challenging, as the FDA has never approved anything like this before and other regulators will likely look to its decision when considering their own approvals). EOT’s manager expects Genus to receive this approval and believes that this will transform the company’s fortunes, and has retained the position.
- Dassault Systèmes – this French multinational software company, which has been a long-term holding for EOT (it first invested during the company’s IPO in 1996), develops software for 3D product design, simulation, manufacturing, and other 3D-related applications (see page 14 of our initiation note for more discussion of the company and its capabilities). EOT’s manager thinks that Dassault Systèmes’s platform is superior to those of competitors and that its platform should effectively become the operating system for the industry – which should be reflected in what it is able to charge for this. Dassault Systèmes’s share price performed poorly during EOT’s last financial year, which EOT’s manager says reflects the fact that the company’s short-term growth rate has moderated due to slower growth in their life sciences business post-COVID. However, EOT’s managers remain very positive about the company’s position and growth prospects. The automotive industry is a significant customer and the slow-down in sales has weighed on Dassault Systèmes’s share price (as discussed on page 6), but EOT’s manager says that automotive-related demand remains robust and should improve as cost efficiency becomes ever more important with EV development. It adds that aerospace and defence demand is another growing opportunity, and that generative AI is already driving growth. Overall, the manager says that the market is focusing on around 20% of the business (life sciences) that has lagged but will rebound, and not the 80% of the business that is generating 1-12% EPS growth per year. Reflecting this, the manager maintained the holding.
- Grifols – this Spanish pharmaceutical and chemicals manufacturer, which is a global leader in the manufacture and marketing of blood plasma derivatives, suffered as allegations around accounting and governance surfaced. The manager adds that Grifols has also been facing increased competition for its fractionated blood products (see page 22 of our initiation note), although supply for these is very tight, and scale (which Grifols has) is crucial. EOT’s manager says that the company has addressed the governance and accounting concerns, obtained a clean bill of health from the Spanish regulator, published unqualified accounts, appointed a new external CEO and reduced its debt. It also sees considerable scope for Grifols to improve its operating performance, which allows for a significant recovery potential.
- Worldline – this is one of three payments companies in EOT’s portfolio. Its shares plunged around 59% in October 2023 on the day of the announcement of its Q3 2023 results in which it lowered its expectations for revenue growth for the 2023 year. The company’s guidance for organic revenue growth was revised downwards from 8-10% to 6-7%, reflecting tougher macroeconomic conditions in core geographies – in particular, Germany. In addition, the company highlighted shifts in consumer spending from discretionary to non-discretionary that were impacting the business.
Worldline was also experiencing what it saw as some temporary challenges that included terminating some of its merchant relationships following a reassessment of associated risks and costs, coupled with low conversion of opportunities within its financial services division. EOT’s manager continues to think that the company is well-positioned strategically and is still to see the benefits of cost-cutting coming through (it has launched a further cost-cutting plan called Power24 that is targeting €200m run-rate cash costs savings in 2025, with a fast ramp-up this year). EOT’s managers saw value in the shares and increased the holding.
Peer group
Please click here for an up-to-date peer group comparison of EOT versus its Europe sector peers.
EOT is a constituent of the AIC’s Europe sector, which comprises six members, all of which are illustrated in Figures 21 to 24. When we last published, the sector had seven members, but this reduced by one following the merger of Henderson European Focus and Henderson Eurotrust to form Henderson European. Members of the Europe sector will typically have:
- over 80% invested in quoted European shares;
- less than 80% in any single geographic area;
- an investment objective/policy to invest in European shares;
- a majority of investments in medium-to-giant-cap companies; and
- a European benchmark.
There are some notable differences in strategy within the peer group. For example, Henderson European is a strategy that favours growth and so should be a more relevant peer when compared to EOT. Fidelity European and BlackRock Greater Europe have more of a bias to value, while JPMorgan European Growth and Income and Baillie Gifford European Growth operate fairly balanced strategies. However, the principal differentiating factor for EOT from peers is its pan-European – i.e. including the UK – remit.
The map in Figure 21 provides a graphical representation of EOT’s investment style versus its Europe peers as well as the MSCI Europe and MSCI Europe Growth Indices.
The Y-axis (or vertical axis) is a size score – the larger the score, the larger the underlying investments in the portfolio, while the X-axis (or horizontal axis) is a measure of the growth and value factors (the larger the score, the more growth-orientated the trust’s portfolio).
Figure 21: Holdings-based style map1
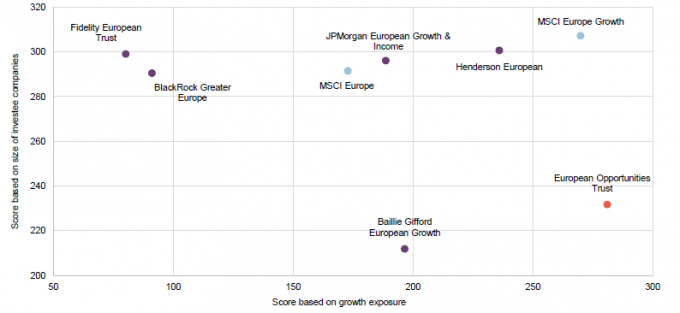
Source: Morningstar, Marten & Co. Note: 1) Scores use information retrieved on 3 September 2024.
Looking at Figure 21 versus its peers, EOT and Baillie Gifford European Growth have portfolios that are at the smaller end of the large-cap spectrum, while EOT and Henderson European are the most growth-focused strategies (of all of the peers, EOT’s growth score is the closest to that of the MSCI Europe Growth Index and is the only fund whose growth score exceeds that of this index).
It is also apparent that the Europe sector offers a range of different propositions in terms of their value-growth tilt, with Fidelity European and BlackRock Greater Europe having more of a value tilt.
Growth sell-off and Wirecard have eaten into EOT’s longer-term performance record.
As we discussed in our initiation note, prior to the collapse of Wirecard, EOT was one of the top-performing trusts within the peer group over the long-term. However, Wirecard’s June 2020 collapse, and the fact that growth stocks have been out of favour in an environment of higher interest rates, has pushed EOT down the peer group rankings. More recently, as inflation has edged down, bringing with it small cuts in interest rates from central banks, confidence around further cuts has showed signs of increasing, which appears to have had a positive impact on growth stocks. While the recovery of growth was not likely to be a straight line, the improvement in EOT’s NAV performance over the three- and six-month periods might indicate that EOT and the other more growth-orientated funds could see strong recoveries if sentiment improves.
Figure 22: Peer group cumulative NAV total return performance to 30 September 2024
| 1 month (%) | 3 months (%) | 6 months (%) | YTD(%) | 1 year (%) | 3 years(%) | 5 years(%) | 10 years(%) | |
|---|---|---|---|---|---|---|---|---|
| EOT | (4.0) | (2.1) | 1.9 | 2.2 | 11.1 | 8.2 | 13.3 | 136.2 |
| Baillie Gifford European Growth | (0.3) | (3.8) | (6.7) | 1.1 | 12.0 | (27.6) | 23.4 | 62.5 |
| BlackRock Greater Europe | (2.3) | (3.9) | (6.1) | 5.8 | 19.5 | 1.7 | 69.5 | 209.9 |
| Fidelity European | (2.0) | (0.3) | 0.8 | 7.3 | 17.4 | 31.0 | 67.0 | 200.0 |
| Henderson European | (2.1) | (1.6) | (1.2) | 5.8 | 16.6 | 25.8 | 63.3 | 167.6 |
| JPMorgan Eur. Growth & Inc. | (2.5) | (1.8) | (1.3) | 7.9 | 15.5 | 29.1 | 64.2 | 150.8 |
| EOT rank | 6/6 | 4/6 | 1/6 | 5/6 | 6/6 | 4/6 | 6/6 | 5/6 |
| Sector arithmetic avg. | (2.2) | (2.2) | (2.1) | 5.0 | 15.4 | 11.3 | 50.1 | 154.5 |
| Sector arithmetic avg. exc. EOT | (1.8) | (2.3) | (2.9) | 5.6 | 16.2 | 12.0 | 57.5 | 158.2 |
Looking at Figure 23, the relative positions of the funds are largely unchanged from Figure 22, although the absolute share price performances are generally poorer over all time frames, reflecting a general trend of widening discounts during the last year, particularly for the more growth-orientated strategies. As we have discussed previously, EOT appears to have suffered from a greater degree of discount widening versus its peers, although the NAV accretive repurchases and 25% tender offer may have helped to keep this in check.
Figure 23: Peer group cumulative share price total return performance to 30 September 2024
| 1 month (%) | 3 months (%) | 6 months (%) | YTD(%) | 1 year (%) | 3 years(%) | 5 years(%) | 10 years(%) | |
|---|---|---|---|---|---|---|---|---|
| EOT | (4.3) | (2.2) | (1.9) | (1.7) | 7.8 | 7.7 | 5.2 | 111.5 |
| Baillie Gifford European Growth | (1.5) | (5.1) | (7.7) | (1.7) | 9.3 | (37.9) | 19.9 | 49.1 |
| BlackRock Greater Europe | (1.0) | (3.1) | (6.5) | 5.4 | 20.7 | (6.5) | 65.8 | 209.8 |
| Fidelity European | (1.4) | (1.1) | (1.0) | 9.3 | 17.3 | 34.0 | 76.0 | 223.3 |
| Henderson European | 1.7 | (0.8) | 3.0 | 8.8 | 20.5 | 25.8 | 68.1 | 146.2 |
| JPMorgan Eur. Growth & Inc. | (1.3) | (1.8) | (1.1) | 6.3 | 15.7 | 28.1 | 69.7 | 150.6 |
| EOT rank | 6/6 | 4/6 | 4/6 | 5/6 | 6/6 | 4/6 | 6/6 | 5/6 |
| Sector arithmetic avg. | (1.3) | (2.3) | (2.5) | 4.4 | 15.2 | 8.5 | 50.8 | 148.4 |
| Sector arithmetic avg. exc. EOT | (0.7) | (2.4) | (2.7) | 5.6 | 16.7 | 8.7 | 59.9 | 155.8 |
While all the funds are a respectable size, there are significant differences between them. EOT is now the fourth-largest in the group (having been the second-largest when we last published) reflecting both its 25% tender offer conducted in January 2024 (see page 23) and the significant efforts that have been made with regard to repurchases, both of which are designed to act on EOT’s discount.
Figure 24: Peer group comparison – size, fees, discount, yield and gearing as at 18 October 2024
| Market cap (£m) | St. dev. of daily NAV1 | Ongoing charges (%) | Perf. fee | Premium/ (discount) (%) | Dividend yield (%) | Gross gearing(%)2 | Net gearing(%)2 | |
|---|---|---|---|---|---|---|---|---|
| EOT | 541.8 | 20.14 | 0.97 | No | (12.7) | 0.2 | 9.7 | 7.5 |
| Baillie Gifford Eur. Growth | 309.1 | 24.03 | 0.62 | No | (17.6) | 0.5 | 9.6 | 8.5 |
| BlackRock Greater Europe | 560.7 | 21.69 | 0.98 | No | (7.8) | 1.2 | 7.4 | 7.6 |
| Fidelity European | 1,502.1 | 17.28 | 0.77 | No | (9.2) | 2.2 | 16.1 | 12.5 |
| Henderson European | 581.6 | 17.77 | 0.80 | No | (12.2) | 2.5 | 4.4 | 4.2 |
| JPMorgan Eur. Growth & Inc. | 430.6 | 17.88 | 0.66 | No | (12.8) | 4.3 | 8.3 | 5.5 |
| EOT rank3 | 4/6 | 4/6 | 7/7 | 3/6 | 6/6 | 5/6 | 3/6 | |
| Sector arithmetic avg. | 654.3 | 19.80 | 0.81 | (12.1) | 1.8 | 9.3 | 7.6 | |
| Sector arithmetic avg. exc. EOT | 676.8 | 20.19 | 0.77 | (11.7) | 2.1 | 9.2 | 7.7 |
Repurchases have been helpful for liquidity but EOT’s ongoing charges ratio has edged up at the margin.
In terms of ongoing charges ratio, EOT’s is currently the second-highest within the peer group (it was the largest when we last published), but it is not out of line with wider industry comparisons and, at 0.97%, is 5bp lower than the 1.02% for the prior year. On page 31 of our initiation note we estimated that the fee changes that took effect from 1 June 2023 would cut the ongoing charges ratio by 10bp. However, the flip side of EOT’s board’s robust approach to repurchases, which provides liquidity to exiting shareholders, is that at the margin, this puts upward pressure on EOT’s ongoing charges (as its fixed costs are spread over a slightly smaller asset base). None of the peer group pays a performance fee.
As observed in the initiation note, the three most growth-focused funds are those that have experienced the highest volatility in their returns, although EOT’s continues to be the lowest volatility of these, and its volatility is fractionally below the sector average.
Reflecting its growth focus, EOT has the lowest yield in the sector, while the more value-orientated funds have higher yields. As is discussed in the dividend section below, reflecting its growth focus, EOT’s primary reason for paying a dividend is to maintain its investment trust status.
EOT’s discount is above the sector average (c.100bp), which is a little wider than when we last published (c.50bp), although the average continues to be pulled up by Baillie Gifford European Growth.
When we last published, EOT ranked as one of the more geared funds within the peer group (although, in absolute levels, both gross and net gearing were at quite sensible levels), but while EOT’s net gearing has increased by 1.7 percentage points, it has increased its gearing less than its peers so that its net gearing is close to the sector average and it ranks middle of the pack.
Dividend
Capital growth focused with one dividend annually, primarily to maintain investment trust status.
EOT is focused primarily on generating capital growth, rather than income, and so dividend income makes up a relatively small part of its overall returns. EOT primarily pays a dividend to maintain its investment trust status and so the level can fluctuate, although this has almost always been covered (see Figure 34 on page 28 of our November 2023 initiation note for an illustration of this). This has allowed EOT to gradually build its revenue reserve over time. The trust pays one dividend annually, as a final, usually towards the end of November each year, following its approval at the company’s AGM.
The trust is proposing to pay a dividend of 2.0p per share for the year 31 May 2024 (payable to shareholders on the register as at 8 November 2024 with an ex-dividend date of 7 November 2024), down from 3.5p per share for the prior year. The 2.0p dividend is a yield of 0.2% on the trust’s share price of 853.0p per share on 18 October 2024. EOT is not permitted to pay dividends out of capital. The reduction in the dividend for the 2024 year reflects the fact that EOT disposed of a number of high-income-generating securities during the year, which has led to a particularly steep decline in the revenue return per share for the 2024 year to 0.3p per share from 3.3p for the prior year.
EOT’s board has said that, while it has generally been its policy to pay a covered dividend, in view of the sharpness of the decline in revenue income and the importance of income to many shareholders and the trust’s ample revenue reserves, it is recommending a final dividend of 2.0p, which is uncovered.
Premium/(discount)
Prior to the onset of COVID and the collapse of Wirecard that occurred shortly thereafter, EOT was trading at a markedly narrower discount than the high single-digit/low teens discount that it tends to trade at today. It seems reasonable that a significant factor behind EOT’s historic premium was its long-term record of strong absolute performance and performance relative to its peers. This was impacted when Wirecard collapsed, but then EOT came under further pressure when it underperformed as growth stocks sold off in the face of higher inflation and interest rates. Subsequent to this, EOT’s discount experienced some narrowing at the time that inflation started to retrench and in the run up to the 25% tender that completed in January, although it widened again as soon as this completed.
Figure 25: EOT discount over five years
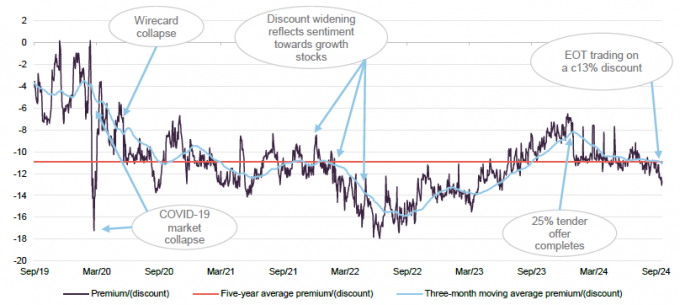
Source: Morningstar, Marten & Co
More recently, EOT has traded within a relatively narrow discount rage, likely aided by significant share repurchases that appear to be keeping the discount in check – since the tender completed, EOT has repurchased 8.6m shares (11.9% of its issued share capital following the tender). Saba Capital, the discount-driven investor that agitated for the 25% tender offer last year, is no longer a shareholder in EOT.
Figure 26: EOT net monthly repurchases since January 20211
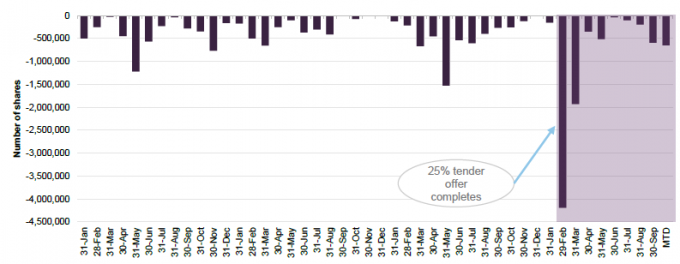
Source: European Opportunities Trust, Marten & Co Note: 1) Excludes 25% tender offer that was conducted in January 2024 with 24.1m shares repurchased at 918.1p per share. .
Although the discount has moved out following the completion of the 25% tender offer on in January 2024, shareholders may take comfort from the extensive repurchase efforts noted above. These provide liquidity for shareholders choosing to exit and are NAV-accretive for remaining shareholders. As Figure 26 illustrates, the amount of repurchasing required to keep EOT’s discount in this band has reduced recently, perhaps suggesting that the share register may have been cleaned up significantly.
Conditional tender offer in 2026 if EOT’s NAV underperforms the benchmark
Conditional 25% tender at prevailing NAV less 2% in 2026.
EOT’s board has committed to providing shareholders with a 25% tender offer in 2026 if its NAV total return does not equal or exceed that of its benchmark, the MSCI Europe Index, over the three-year period beginning 1 June 2023 and ending on 31 May 2026. This tender offer, which is subject to shareholders approving the continuation resolution at the 2026 AGM, is to be held as soon as is practicable following the conclusion of that AGM.
If the conditions to trigger the tender are met, the tender will be priced at the prevailing NAV at the time of repurchase (adjusted for the costs associated with the tender offer) less 2%, which will make it NAV-accretive for remaining shareholders. EOT’s board says that the introduction of the conditional tender offer will not change the board’s current approach to discount management that is discussed above.
Fund profile
More information can be found at the manager’s website:
EOT aims to achieve long-term capital growth by investing in a portfolio of European companies and in sectors or geographical areas which are considered by the investment manager to offer good prospects for capital growth, considering economic trends and business development. The manager looks for ‘special’ companies – which it describes as niche winners in their respective fields that can flourish in a range of economic scenarios. Such companies will typically benefit from an advantageous industry structure, multiple protections and multiple avenues for growth.
The manager believes its special companies’ products will not be commodifiable and that, over the long term, their results will outweigh growth versus value considerations, market fashions, geographic influences, political risks, and the risk of unconstrained supply.
The approach is long-term in nature – EOT’s board considers five years as a reasonable holding period for investment in equities – and the portfolio is reasonably focused (typically 26-35 holdings). The concentration risk within the portfolio is mitigated by a strong focus on company fundamentals to understand the risks involved, as well as high diversification by activity and geography across the holdings.
Management arrangements
The trust was launched in November 2000 and has had the same lead portfolio manager, Alexander Darwall, since launch. Originally, EOT (then called Jupiter European Opportunities) was part of the Jupiter stable of investment trusts, but EOT’s board took the decision to follow Alexander when he left that firm, moving the management contract to Devon Equity Management Limited in November 2019, after Alexander had founded that business. EOT’s investment manager also acts as its AIFM. The manager had a total AUM of £1.35bn as at 31 August 2024.
Benchmark
EOT’s benchmark is the MSCI Europe Index (total return in sterling). However, the composition of the index has no bearing on the manager’s choice of stocks or position sizes. As evidence of this, the active share at the end of September 2024 was about 92%.
Reflecting EOT’s growth focus, we have also included performance numbers for the MSCI Europe Growth Index as we feel it offers a useful comparison, as well as numbers for the MSCI World Index to provide a comparison against global equities more generally. However, it should be noted that neither of these are indexes that the trust compares its own performance to. A peer group comparison is also included on pages 18 to 22.
Previous publications
Readers interested in further information about EOT, such as investment process, fees, capital structure, life and the board, may wish to read our initiation note ‘Special’ growth companies, published on 1 November 2023.
Important Information:
This marketing communication has been prepared for European Opportunities Trust Plc by Marten & Co (which is authorised and regulated by the Financial Conduct Authority) and is non-independent research as defined under Article 36 of the Commission Delegated Regulation (EU) 2017/565 of 25 April 2016 supplementing the Markets in Financial Instruments Directive (MIFID). It is intended for use by investment professionals as defined in article 19 (5) of the Financial Services Act 2000 (Financial Promotion) Order 2005. Marten & Co is not authorised to give advice to retail clients and, if you are not a professional investor, or in any other way are prohibited or restricted from receiving this information, you should disregard it. The note does not have regard to the specific investment objectives, financial situation and needs of any specific person who may receive it. The note has not been prepared in accordance with legal requirements designed to promote the independence of investment research and as such is considered to be a marketing communication. The analysts who prepared this note are not constrained from dealing ahead of it, but in practice, and in accordance with our internal code of good conduct, will refrain from doing so for the period from which they first obtained the information necessary to prepare the note until one month after the note’s publication. Nevertheless, they may have an interest in any of the securities mentioned within this note. This note has been compiled from publicly available information. This note is not directed at any person in any jurisdiction where (by reason of that person’s nationality, residence or otherwise) the publication or availability of this note is prohibited.
Accuracy of Content: Whilst Marten & Co uses reasonable efforts to obtain information from sources which we believe to be reliable and to ensure that the information in this note is up to date and accurate, we make no representation or warranty that the information contained in this note is accurate, reliable or complete. The information contained in this note is provided by Marten & Co for personal use and information purposes generally. You are solely liable for any use you may make of this information. The information is inherently subject to change without notice and may become outdated. You, therefore, should verify any information obtained from this note before you use it.
No Advice: Nothing contained in this note constitutes or should be construed to constitute investment, legal, tax or other advice.
No Representation or Warranty: No representation, warranty or guarantee of any kind, express or implied is given by Marten & Co in respect of any information contained on this note.
Exclusion of Liability: To the fullest extent allowed by law, Marten & Co shall not be liable for any direct or indirect losses, damages, costs or expenses incurred or suffered by you arising out or in connection with the access to, use of or reliance on any information contained on this note. In no circumstance shall Marten & Co and its employees have any liability for consequential or special damages.
Governing Law and Jurisdiction: These terms and conditions and all matters connected with them, are governed by the laws of England and Wales and shall be subject to the exclusive jurisdiction of the English courts. If you access this note from outside the UK, you are responsible for ensuring compliance with any local laws relating to access.
No information contained in this note shall form the basis of, or be relied upon in connection with, any offer or commitment whatsoever in any jurisdiction.
Investment Performance Information: Please remember that past performance is not necessarily a guide to the future and that the value of shares and the income from them can go down as well as up. Exchange rates may also cause the value of underlying overseas investments to go down as well as up. Marten & Co may write on companies that use gearing in a number of forms that can increase volatility and, in some cases, to a complete loss of an investment.