“Vote against Saba” to protect your investment
Herald Investment Trust (HRI) closed-end structure allows its manager to take a long-term view and buy into what it believes are up-and-coming technology stocks at an early stage of their development, with the aim of providing its shareholders with a differentiated source of alpha.
Saba Capital’s recent attempt to wrestle control of HRI, change its mandate, and install itself as manager could represent a significant risk to its shareholders’ investment and may see them miss out on potential upside. HRI’s board was unanimous in rejecting Saba proposals. It believes very strongly that shareholders of all sizes should vote to reject all of Saba’s resolutions at the upcoming general meeting, details of which can be found here.
Despite Saba’s antics, HRI generated positive returns over 2024, with several of its holdings reporting triple-digit returns. In part, this could reflect HRI’s exposure to the themes of AI-based services or their critical infrastructure. HRI’s share price has also benefitted from the recent narrowing of its discount.
Small-cap technology, telecommunications, and multi-media
HRI’s objective is to achieve capital appreciation through investments in smaller quoted companies in the areas of telecommunications, multimedia, and technology. Investments may be made across the world, although the portfolio has a strong position in UK stocks.
| 12 months ended | Share price total return (%) | NAV total return (%) | Numis ex IC plus AIM (%) | B’berg US 2000 Tech TR (%) |
|---|---|---|---|---|
| 31/12/2020 | 51.7 | 37.4 | 4.9 | 43.9 |
| 31/12/2021 | 11.6 | 19.0 | 20.0 | 12.9 |
| 31/12/2022 | (28.9) | (23.1) | (21.9) | (25.4) |
| 31/12/2023 | 7.9 | 5.4 | 3.2 | 18.2 |
| 31/12/2024 | 26.4 | 12.2 | 5.0 | 19.9 |
Source: Morningstar, Marten & Co
Saba may profit at your expense
Saba Capital has simultaneously launched campaigns against seven UK investment trusts, HRI included
HRI has recently become the target of Saba Capital, a US-based hedge fund that has built substantial stakes in seven investment trusts. Saba has 25.5% of HRI as at 15 January 2025, but in some cases owns just shy of 30% of the trusts’ outstanding shares. In an announcement made on 18 December, Saba Capital declared its intention to remove all members of the existing boards of these trusts and replace them with just two members each – both Saba nominees, one of whom is a Saba employee. Furthermore, Saba plans to dismiss the current investment managers and substitute them with its own team.
Saba’s ultimate objective is to merge these trusts into a single entity and operate it as a fund of investment trusts, under which your portfolio of technology companies would be sold into a market that may know HRI is a seller. Its strategy may pose risks for existing shareholders. We have published several articles outlining our arguments against Saba Capital, with the initial announcement covered here.
HRI’s board has already issued public rebuttals to Saba’s proposals, encouraging shareholders to vote against them at the Extraordinary General Meeting (EGM) to be held on 22 January. HRI’s board unanimously recommends that HRI shareholders vote against Saba’s resolutions. The board’s rebuttals are detailed here, and here.
Fundamental flaws in Saba’s strategy
Saba’s rationale for targeting HRI appears to have some flaws and its actions could result in destruction of value for HRI’s shareholders.
1. Liquidity risks and value destruction?
HRI’s portfolio comprises over 300 specialist small-cap equities, many of which have limited liquidity. These companies benefit from being held within a pool of permanent capital, such as HRI. However, as many of these trade by appointment, a wholesale sell-off – necessary for Saba’s plans – could see Saba move the market against HRI, if it becomes recognised as a forced seller, which seems quite possible. HRI’s manager thinks that the best way to prevent the destruction of shareholder value is to allow the existing management team to continue to run the trust with the current mandate, given its long-term track record and future return potential.
Saba could end up destroying value for HRI’s shareholders if it gets its way
2. Loss of unique risk-return profile?
HRI is a distinctive strategy with an idiosyncratic risk-return profile, as we evidence on pages 6 and 7. Converting it into a portfolio of investment companies fundamentally alter this profile, potentially rendering it unsuitable for some existing shareholders.
- HRI has delivered long-term returns for its shareholders, having increased its NAV by more than three-fold over the last 10 years on a total return basis, and 27 times since its inception in February 1994.
- HRI has a record of returning cash to shareholders. Having raised just £95m in capital since its launch – £65m at its IPO in 1994 which was topped up with an additional £30m in 1996 – HRI has, to date, returned over five times this amount to shareholders (£480m) via buybacks. This is while still retaining some £1.25bn of net assets for shareholders.
- Saba refers to its ETF of closed-ended funds (CEFS) several times in its recent announcements. We would observe that CEFS is not a closed end fund; the two closed end funds that Saba manages in the US trade at discounts to NAV and CEFS has a more complicated strategy than HRI’s based on its holdings.
- CEFS utilises leverage in its investment approach (11% as of 30 November), which may be unpalatable for some investors given its increased market exposure when compared to HRI’s unleveraged position (with HRI currently having 8.4% in cash).
- The leverage that CEFS employs is complex and makes use of derivative instruments. If Saba were to be successful in converting HRI into a fund of investment trusts and ran it in a similar way to CEFS, it is possible that this complexity may make it unsuitable for some of HRI’s existing investors.
- Investors in CEFS also incur noticeably higher fees than shareholders in HRI. CEFS has an annual management fee of 1.1% which, when combined with 1.39% in other expenses, gives ongoing charges equivalent to 2.49%, which is more than twice HRI’s 1.07% ongoing charges ratio.
3. Misleading performance comparisons?
Saba claims that CEFS has outperformed HRI over all relevant time periods since CEFS’s launch in 2017. This assertion is a cornerstone of its argument for being able to improve shareholder outcomes. However, whilst CEFS outperformed HRI over its chosen time periods (all ending 13 December 2024), prior to 2020, HRI had outperformed CEFS.
Another consideration is that CEFS is only sold in the US market, and as such its returns are not impacted by currency effects.
CEFS’s performance is also calculated based on the market value of its investments, not their reported NAVs. If we were to compare the share price returns of HRI to CEFS’s price returns (since CEFS’s inception on 21 March 2017), we would find that HRI outperformed CEFS by 39.4% in sterling terms as of 31 December 2024. Even if we calculate HRI’s performance at the end of September, before the recent narrowing of HRI’s discount on the back of Saba’s own buying activity, HRI’s share price returns would have still exceeded CEFS’s by 15.2%.
4. Inappropriate benchmarking?
Saba has also compared HRI’s performance to the Russell 2000 Technology Index in its public announcement, which is an entirely-US-focused index. This comparison is problematic, as HRI has a global remit, making it akin to comparing apples to oranges. Even then, HRI has, over the longer term, been able to outperform the US market – generating higher NAV returns than the Bloomberg US 2000 Technology Index since its inception, as we point out on page 13.
If we stick with Saba’s benchmarking, HRI’s manager thinks that a fairer comparison would be to compare Herald’s North American allocation to the US Small Cap Technology index. As can be seen in Figure 1, HRI’s North American allocation has not only beaten the US index over 2024, but also since HRI first invested in the region in July 1996.
Figure 1: HRI North American portfolio performance versus index to 31 December 2024.
| One-year | Three-year (ann.) | Five-year (ann.) | Since US portfolio inception (ann.)1 | |
|---|---|---|---|---|
| HRI | 35.2 | 12.6 | 20.1 | 10.7 |
| Russell 2000 Technology Index | 25.9 | 2.9 | 11.7 | 7.3 |
We note that, despite Saba’s claims of strong performance, CEFS has also failed to beat its own benchmark, the S&P 500, over the last five years. As of 31 December 2024, the S&P 500 had outperformed CEFS by 28.7 percentage points over the previous five years.
5. On the cash offer
Saba has said that it “would encourage the new board to offer all shareholders a 100% cash exit at 99% of the trust’s NAV” and “as a result, Saba expects that shareholders will have the opportunity to sell their entire position at 99% of NAV, if they wish”.
However, reading the fine detail, we can see that this is not 99% of today’s NAV as it is suggesting that this exit would be after “at least a year” during which the value of HRI’s portfolio may shift form today’s level. This could be important given the illiquidity of a high proportion of HRI’s holdings. We note that the time frame for achieving this is currently open ended.
There is a potentially flawed logic in Saba’s statement in that it appears to claim to know what an independent board might want to do in the future. This only really stands if Saba believes it will have control of the board. However, the board is legally required to be independent of the manager. As such, Saba’s proposed cash return is not really in its power to grant. In addition, there is an additional concern that shareholders could find this difficult to enforce after the event.
We note that HRI has generated capital gains for many of its investors, and a cash exit would lead to an unavoidable tax liability particularly for its long-term shareholders.
We observe that HRI already has a continuation vote scheduled for April 2025 and every three years thereafter.
In conclusion, Saba Capital’s proposed strategy for HRI poses potential risks to shareholder value. HRI’s board have encouraged its shareholders to carefully consider these flaws and vote against Saba’s proposals.
Herald – like nothing else
With the headlines surrounding technology companies and the anticipated impacts of AI, it may be worth reminding readers of the arguably unique aspects of HRI.
HRI’s unique investment focus
HRI’s is a truly unique investment strategy amongst those available to UK investors
HRI stands out as the only investment trust that focuses exclusively on global small-cap technology stocks. While there are open-ended funds with similar approaches, none offer the potential benefits of a closed-ended structure, such as access to permanent capital.
HRI’s manager says that its permanent capital is a component of HRI’s investment philosophy, as it allows the trust to invest in small, quoted companies whose lack of liquidity would ordinarily prevent equivalent open-ended funds from holding them. It adds that this enables HRI to identify and invest in the next generation of listed small-cap technology firms earlier and potentially at more attractive valuations than equivalent open-ended funds.
Moreover, HRI’s structure allows it to take what its managers believe is a strategic approach to capital allocation. The trust can act as a source of liquidity or funding for small tech firms when others may not be able to, with the HRI team noting that this creates opportunities to acquire shares at uncommon discounts, particularly in periods when open-ended funds are forced sellers.
HRI’s specialist portfolio
HRI’s differentiated approach may be seen in the composition of its portfolio. According to Morningstar’s assessment of its investment “style”, the average company size within Herald’s portfolio is multiples smaller than that of any open-ended technology fund available in the UK (as classified by the Investment Association).
This position may also define HRI’s role within an investor’s portfolio. It offers an arguably differentiated source of alpha, potentially enabling investors to capitalise on trends within the technology sector without overexposure to the large-cap technology firms that dominate most technology funds – and, by extension, the wider global equity market.
Performance analysis
HRI’s offers a differentiated source of alpha
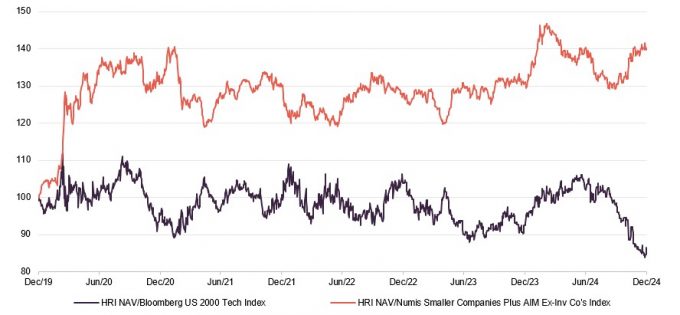
Whilst recent market trends seem to have broadly favoured large-cap technology firms over small-caps, historical data supports HRI’s position as a specialist source of alpha. Figure 2 illustrates that, since its inception in 1994, HRI has delivered superior NAV returns and alpha, with a lower correlation and higher Sharpe ratio, than the open-ended technology sector, proxied by the Investment Association technology sector averages (note that Figure 2 reflects the average five-year value for statistics, sampled weekly).
While these figures may initially appear marginal, it should be noted that HRI has achieved these figures while not being able to invest in the mega-cap technology stocks that have driven the returns of global equity market returns recently. Furthermore, it would seem that there is little risk of significant overlap between Herald’s offering and other technology funds.
Figure 2: HRI risk-return data vs open-ended peers
| Average five-year return | Average Sharpe ratio | Average Alpha | Average Correlation | |
|---|---|---|---|---|
| HRI | 90.1 | 0.09 | 0.07 | 0.75 |
| IA technology & technology innovation | 83.7 | 0.07 | 0.02 | 0.83 |
| IA Global | 42.9 | 0.05 | -0.02 | 0.75 |
Market update
Although it has only been seven months since our last publication, several developments have occurred across the technology sector and the wider global economy.
The technology sector: AI at the forefront
The returns from AI have begun to spread across the wider technology sector
Artificial intelligence (AI) has continued to be a major force within the technology industry, both in terms of development and adoption. The demand for AI and the infrastructure required to sustain it have become notable drivers for many major technology firms. In the third quarter of 2024 alone, leading companies such as Microsoft, Amazon, Alphabet, and Meta collectively spent $67bn on AI – a 47% year-on-year increase. Total AI spending for 2024 is on track to exceed $200bn.
HRI’s manager says that, despite being in relative infancy, AI adoption has already delivered measurable returns across the sector. It adds that, while semiconductor giant Nvidia has been the poster child of the AI boom due to its pivotal role in developing AI-enabling hardware, its growth has slowed in recent months – rising just 10% compared to its remarkable 158% surge in the first half of the year. Instead, the manager contends, the past six months have seen a broader range of AI “winners”, including companies not only facilitating AI development, but also successfully commercialising its integration.
For example, CRM software firm Salesforce has gained 43% over the last six months, seemingly driven by strong demand for its AI-powered tool, “Agentforce”. This diversification of returns appears to have also benefitted HRI, as several of its holdings, such as Celestica and Pegasystems (detailed on page 12), have reported improved outlooks due to heightened demand for their AI-related services.
AI also appears to have been a catalyst in the private equity sector, with it attracting capital deployment. The second quarter of 2024 set a record for AI-related private equity deals, with 53 transactions totalling $8bn. Notably, two outsized investments – Safe Superintelligence and World Labs – were valued at $5bn and $1bn respectively, earning them “unicorn” status. Within HRI’s portfolio, 11 companies have been acquired over the past six months, five of which were in December alone, and have raised £63.7m for HRI. One example of this is its investment in Esker (also detailed on page 13).
Political developments
A notable event since our last note has been the conclusion of the US presidential election, which saw Donald Trump elected as the new president. There have been signs that a Trump administration could bring changes to technology policy, potentially including AI deregulation, increased onshoring of US chip production, and reduced scrutiny of antitrust issues, such as the dominance of mega-cap tech firms in industries like web search and social media, for example.
The election of Trump may continue the dominance of US tech firms
It is perhaps too early to do anything other than speculate, as Trump will take power on 20 January 2025, although it seems reasonable that the new administration may favour the continual dominance of US technology firms (given the president elect’s “America first” attitude), which may help proliferate current sector trends, such as a rapid expansion of America’s AI sector.
Meanwhile, the UK experienced its own political event, with a Labour government taking power for the first time in 14 years. Labour’s recently unveiled budget includes expanded public spending funded by increased taxation, raising concerns about near-term stagflation. Markets have reacted cautiously, with 2024 marking a record year for investor withdrawals from UK funds. The HRI team has previously noted the lack of depth in the UK market, with limited liquidity driving a strategic shift away from UK-based investments (illustrated in Figures 3 and 4 on page 10).
However, this lack of liquidity may also present opportunities. HRI maintains a large pool of liquid capital, which can enable it to act swiftly to take advantage of mispriced securities when these occur.
Interest rate policy and market expectations
Global interest rate policy continues to play a role in influencing the technology sector. High-growth technology firms have a tendency to be sensitive to interest rate changes, making shifts in rate expectations a potentially important factor in investor sentiment towards them.
Although our last note highlighted a dampening of global rate expectations, recent months have seen a shift in sentiment, notably in the aftermath of the US presidential election. Inflationary pressures, possibly driven also by factors such as the UK Labour government’s budget and a more resilient US economy, appear to have led central banks to reconsider their plans for further rate cuts, and the yield of government bonds has been on the rise.
On 18 December, the US Federal Reserve implemented a 0.25% rate cut. However, it has also revised its forecast for 2025, reducing the anticipated number of rate cuts to just two. This announcement seemed to prompt a retreat in US markets, possibly reflecting tempered optimism around future monetary easing.
Asset allocation
HRI’s portfolio continues to tilt further towards the US
Whilst HRI retains some of the characteristics noted in our previous update, such as a material cash allocation, there has been a shift in its geographical exposure. HRI’s allocation to the UK has decreased by 4%, while its exposure to the US has risen by 2.5%.
This shift reflects the relative performance of these regions, with US technology companies continuing to outpace their international counterparts – a trend also highlighted in our last note. The recent growth in US technology firms may be partly attributed to the interest in AI, with the US commanding the lion’s share of the ‘AI winners’.
The decline in HRI’s UK allocation aligns with broader trends in investor activity. UK equity markets have experienced long-term declines in participation, as investors seem to be increasingly favour more-liquid international markets. In contrast, the US has the world’s deepest and most liquid market (based on investor volumes), even amongst smaller companies. US smaller firms have market capitalisations in the billions, which the HRI team believes makes them more likely to meet the minimum size thresholds required by institutional investors.
HRI’s cash levels and its exposure to Asia Pacific and EMEA (Europe, the Middle East, and Africa) remain largely unchanged from the previous note, as seen in Figures 3 and 4. Despite maintaining a flat overall cash allocation, the HRI team has been active in managing liquidity.
Gains were realised from the team’s investment in Super Micro Computer (detailed on page 15), with a significant portion of the proceeds used to fund share buybacks (outlined on page 18).
Figure 3: Geographic allocation as at 30 November 2024*
Figure 4: Geographic allocation as 30 April 2024*
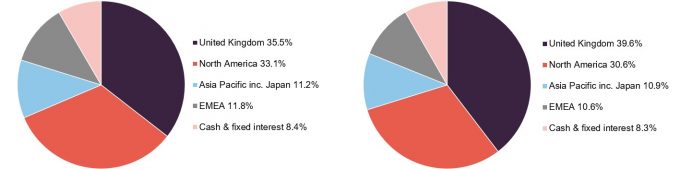
Source: Herald Investment Management *Note: as a proportion of gross assets
Source: Herald Investment Management *Note: as a proportion of gross assets
Valuations remain consistent
HRI’s valuations remain consistent despite the share price growth of AI-related companies
HRI and the broader technology sector have delivered positive returns over the past 12 months, largely driven by demand for AI-related stocks. The technology sector was among the best-performing sectors in 2024.
Despite the capital inflows into technology stocks, HRI’s price-to-earnings (P/E) ratio has remained reasonably consistent with its long-term average, as illustrated in Figure 5. This implies that the market’s apparent enthusiasm for “AI winners” has been supported by growing earnings.
Figure 5: HRI P/E ratio versus market
| 2017 (x) | 2018 (x) | 2019 (x) | 2020 (x) | 2021 (x) | 2022 (x) | 2023 (x) | Q3 2024 (x) | |
|---|---|---|---|---|---|---|---|---|
| HRI | 20.7 | 17.7 | 23.2 | 30.7 | 25.9 | 17.8 | 19.6 | 19.8 |
| MSCI World Small Cap Technology Index | 29.8 | 21.8 | 33.0 | 43.9 | 30.9 | 21.1 | 28.1 | 29.4 |
HRI’s valuations remain lower than those of the broader global small-cap technology universe. This may be a result of its greater diversification as HRI has less exposure to the more highly valued US sector. The team also tends to focus on what it believes are companies with higher quality earnings, which may reduce HRI’s exposure to the more highly valued segments of the technology market.
Top 10 holdings
Figure 6 shows HRI’s top 10 holdings as at 30 November 2024 and how these have changed since our last note. We detail the three largest new entrants below.
There has been heightened level of turnover in HRI’s top 10 compared to our past publications. This may in part be attributed to individual trading activity by the team, as is the case with Super Micro Computer, but also in the improving performance of some stocks, such as Celestica. We note that none of the new entrants are new positions for HRI, as the team typically initiates positions with smaller position sizes, with these building over time as its thesis plays out.
Figure 6: Top 10 holdings as at 30 November 2024
| Holding | Sector | Country | Allocation 30 November 2024 (%) | Allocation 30 April 2024 (%) | Percentage point change |
|---|---|---|---|---|---|
| Celestica Inc | Tech hardware and semiconductors | US | 2.3 | 1.2 | 1.1 |
| Fabrinet | Tech hardware and semiconductors | US | 2.3 | 1.7 | 0.6 |
| Trustpilot | Media | UK | 2.2 | 1.6 | 0.6 |
| Diploma | Support services | UK | 2.0 | 1.7 | 0.3 |
| BE Semiconductor Industries | Tech hardware and semiconductors | Netherlands | 1.9 | 2.2 | (0.3) |
| Pegasystems Inc | Software & computer services | US | 1.7 | 1.1 | 0.6 |
| Esker SA | Support services | France | 1.7 | 1.2 | 0.5 |
| Super Micro Computer | Technology hardware & equipment | US | 1.6 | 4.3 | (2.7) |
| GB Group | Support services | UK | 1.4 | 1.1 | 0.3 |
| Descartes Systems | Software & computer services | Canada | 1.4 | 1.3 | 0.1 |
| Total of top 10 | 18.5 | 18.8 | (0.3) |
Celestica Inc
Figure 7: Celestica Inc (USD)
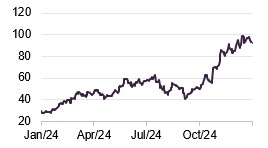
Source: Bloomberg
Celestica (www.celestica.com) is an American-Canadian firm that designs, manufactures, and provides hardware platforms and supply chain solutions. Its services are split into two segments: Advanced Technology Solutions and Connectivity & Cloud Solutions. As the name implies its Advance Technology Solutions arm services industries life defence and health technology, offering products such as semiconductors and robotics equipment. While Connectivity & Cloud Solutions typically services the telecommunications and enterprise sectors.
Celestica reported a positive third quarter for 2024, with revenues increasing 22% year on year to $2.5bn, surpassing its management’s expectations. The growth was primarily driven by Connectivity & Cloud Solutions, which saw revenue increase by 42%, while the Advanced Technology Solutions saw a 5% decrease.
Celestica’s profitability saw a sharp increase, with its earnings per share increasing 60% year on year (YoY), while its profit margin increased to 6.7% from 5.7% a year previously. Celestica’s returns reflected the growth of the AI market, as Celestica benefitted from the increase in capital expenditure by the wider technology sector, with Google being its largest customer. A new example of this is Celestica’s recent strategic relationship with AI company Groq to manufacture AI/machine learning servers and rack solutions.
On the expectation of capitalising on opportunities presented by AI, Celestica’s management have raised its full-year revenue guidance to $9.6bn, up from the previous forecast of $9.4bn. They are also targeting $10.4bn in revenue for 2025.
This improving outlook has been reflected in Celestica’s share price, which rose 221% over the course of 2024, with 93% of that growth occurring in the last quarter alone. As a result, Celestica has been one of HRI’s most significant contributors to returns.
Pegasystems
Figure 8: Pegasystems (GBP)
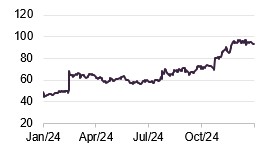
Source: Bloomberg
Pegasystems (www.pegasystems.com) develops enterprise software designed to enhance business agility, with the aim of enabling organisations across various industries to better adapt to change. Based in America, its core product is a platform that facilitates the automation of customer interfaces, streamlining operations and improving customer experiences.
Pegasystems has been a long-held position for HRI and was previously one of its top 10 holdings. Pegasystems’s share price more than doubled in 2024, moving it back into HRI’s top 10 holdings.
In its most recent performance update, Pegasystems’s management highlighted the growth of both its cloud and AI services. The company reported a 16% year-on-year (YoY) increase in annual contract value, with its Pega Cloud service – encompassing AI and automation offerings – growing by 30%.
This growth has translated into an improvement in financial performance. Pegasystems’s free cash flow nearly doubled YoY, reaching $246m by the end of the third quarter. Gross margins have also expanded, now standing at 78% – just shy of the management’s 80% target.
Pegasystems’s management emphasised its continued focus on transitioning more of the business to its cloud services platform. They note that strategy not only provides the benefits of a recurring revenue model, but also aims to sustain the company’s leadership in AI and automation.
Esker
Figure 9: Esker (EUR)
Source: Bloomberg
Esker (www.esker.co.uk) is a French software developer whose products allow firms to eliminate the use of paper from their business management processes. Its products are split into three suites: source-to-pay, order-to-cash, and global invoicing. In September 2024 Esker announced that Bridgepoint, a US private equity firm, had made a bid for the company, paying €262 per share, and valuing the company at €1.6bn, a 30% premium on the day of the announcement. Bridgepoint commented that Esker is a “leading global player” with cutting-edge products and technology as well as market leadership in its home country of France, and a strong presence in Europe, the Asia-Pacific region, and North America.
GB Group
GB Group (www.gbgplc.com) is a British software developer whose products split along three distinct segments: identity verification, location intelligence and fraud prevention. GB Group has roughly 20,000 clients across the global, ranging from large banks, to ecommerce, to the public sector; with the majority of its revenues generated outside of the UK.
Its recent half-year results for its 2025 financial year indicated that the firm is on track for single-digit growth, reporting £137m in revenues in the first six months, up 3.4% YoY. This growth was primarily driven by growth in its identity verification (up 6.0%) and location intelligence segments (up 8.6%), partially offset by a decline in fraud prevention (down 9.2%), which was due to timing of licence renewals rather than reduced demand.
GB Group
Figure 10: GB Group (GBP)
Source: Bloomberg
GB Group reported profits increasing by 21.3% YoY to £29.0m, representing a margin of 21.2% (up from 18.1%). Its management notes that growth was due to a combination revenue growth and successful cost-reduction initiatives implemented in the prior financial year. GB Group’s management have also taken steps to improve its balance sheet, reducing net debt by £9.0m to £71.9m, representing a leverage ratio of 1.05x EBITDA.
Its management has maintained the same outlook from the start of the financial year, expecting mid-single-digit revenue growth and high-single-digit profit growth.
Performance
As can be seen in Figures 11 and 12, HRI has been able to generate returns which have exceeded the Deutsche Numis Smaller Cos plus AIM ex Investment Companies Index (which captures the performance of the wider UK small-cap market). Prior to the second half of 2024, HRI was also ahead of the Bloomberg US 2000 Technology Index (a proxy for the US small-cap technology space that is also a close proxy for the Russell 2000 Index), though it has begun to lag over the last six months, leading it to underperform. Although it has still been able to exceed the US market over the longer term, since the Bloomberg US 2000 Technology Index’s inception on 31 March 2015, HRI has generated a 291.6% NAV total return compared to the index’s 269.6%. As we mention on page 5, HRI’s US investments have outperformed the US small cap technology sector in 2024 and the longer term.
HRI remains well ahead of the UK market, though it has begun to lag the US in recent months
HRI’s overall underperformance relative to US small-cap technology stocks could partly be attributed to the relative dominance of US tech companies to their international peers. Investors may have shifted their focus beyond mega-cap AI winners to smaller firms whose returns are now being driven by demand for AI services or by providing the ancillary solutions required for AI development.
Whilst many of HRI’s top contributors (detailed on page 15) are among this cohort of the US’s AI winners, the trust’s regional diversification and UK exposure have weighed on its performance relative to the US market overall – as the region has been the main driver of returns in the global technology market.
Figure 11: HRI’s NAV total return relative to various indices, over five years to 31 December 2024
Source: Morningstar, Marten & Co
Figure 12: Cumulative total return performance over periods ending 31 December 2024
| 1 month (%) | 3 months(%) | 6 months (%) | 1 year (%) | 3 years(%) | 5 years(%) | 10 years(%) | |
|---|---|---|---|---|---|---|---|
| HRI NAV | 0.8 | 5.5 | 0.5 | 12.2 | (9.0) | 48.8 | 204.6 |
| HRI share price | 3.2 | 16.5 | 11.2 | 26.4 | (3.0) | 64.2 | 268.7 |
| Deutsche Numis Smaller Cos plus AIM ex IC | (0.1) | (2.4) | 0.8 | 5.0 | (15.4) | 6.6 | 62.4 |
| Bloomberg US 2000 Technology | 1.0 | 19.4 | 18.6 | 19.9 | 5.8 | 71.8 | n/a* |
Source: Morningstar, Bloomberg, Marten & Co. * The Bloomberg US 2000 Technology was launched on 31 March 2015. Since its inception it has generated a total return of 269.6%, compared to the 291.6% NAV total return of HRI.
Key contributors
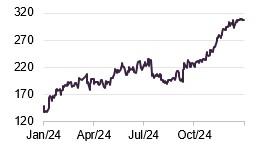
The HRI team have highlighted a few major contributors to the trust’s returns over the last 12 months: Celestica (which we covered on page 12), Fabrinet, Trustpilot and Super Micro Computer.
Super Micro Computer
Figure 13: Super Micro Computer (USD)
Source: Bloomberg
Super Micro Computer (SMC) (www.supermicro.com) is a producer of high-performance and high-efficiency servers. Based in Silicon Valley, SMC provides servers and platforms for a wide range of markets, including enterprise data centres, cloud computing, artificial intelligence (AI), fifth-generation (5G) technology, and edge computing.
SMC was the largest contributor to HRI’s returns at the time of our last publication, given its pivotal role in developing AI infrastructure, with Nvidia as one of its largest suppliers. However, SMC’s share price peaked in March 2024, following a series of negative news announcements related to its accounting practices and governance. This was further compounded by the company being publicly targeted by a prominent short-seller.
The HRI team remains optimistic about SMC’s long-term prospects, believing that much of the negative press has been overstated. The concerns around SMC’s accounts were raised by its previous auditor, who resigned after being unable to sign off on its accounts. However, a new auditor has since been appointed and has not identified any material issues.
The HRI team has also noted that none of the operational and accounting concerns initially raised about SMC have been substantiated. They believe that the only credible issue relates to the company’s hiring practices, which are being addressed.
Recognising the previous gains in SMC’s share price, the team had been actively trimming its position. From an initial investment of £7m, HRI has realised over £100m in gains. The trust continues to hold an approximately £17m position in SMC.
Fabrinet
Figure 14: Fabrinet (USD)
Source: Bloomberg
Fabrinet (www.fabrinet.com) is an EMS provider, constructing other companies’ products on their behalf. Fabrinet offers solutions for the entire manufacturing process – from design and engineering to final assembly and testing. It focuses on low-volume production for a wide variety of complex products. The majority of its assets are based in East, and Southeast Aisa, with a substantial presence in Thailand.
Fabrinet’s recent results (for the first quarter of its current financial year) showed that it had sustained its double-digit profit margins, at 10.7%, as well as generating 17% YoY revenue growth. Having reported quarterly revenues of $804m, Fabrinet’s management expect its revenues to increase over the next quarter, with a top-end guidance of $820m.
Whilst Fabrinet reported revenue growth across all of its segments, its largest earner was its telecommunications arm, which generated 61% of Fabrinet’s revenues. With zero debt and $909m of cash on its balance sheet, alongside increasing demand for high-speed optical equipment, Fabrinet’s management team said that it remains confident in meeting its top-end earnings target.
Trustpilot
Figure 15: Trustpilot (GBP)

Source: Bloomberg
Trustpilot (www.uk.trustpilot.com) is the UK-listed and Danish-headquartered online review provider. Trustpilot IPOd in 2021; however, the HRI team delayed investing until 2023, believing it was mispriced when it entered the market. They initiated position after its post-IPO selloff, with Trustpilot falling c.50% in the first six months. Trustpilot’s share price doubled over 2024, closing out the year at a share price that finally exceeded its IPO level.
Trustpilot’s growth was underpinned by its half-year performance announcement, with earnings coming in 10% ahead of expectations and EBITDA reaching $10.6m. This was driven by a 28% YoY growth in monthly users, reaching 67m per month, with the number of reviews need nearing 300m, a 24% YoY growth. Confident in its momentum, Trustpilot’s management upgraded its earnings guidance for the 2024 financial year and is now expecting results to land at the top end of market consensus (approximately $22m) – roughly a 10% increase from its initial projection.
Trustpilot’s share price appears to have benefited from management’s ongoing commitment to share buybacks. In addition to returning $25.6m to shareholders during the first half of the financial year, the company announced an additional £20m share buyback programme.
Dividend
HRI is focused primarily on generating capital growth, and dividend income makes up only a small part of returns. The consequence of this is that HRI only declares a dividend where this is necessary to retain investment trust status, and in practice, no dividend has been declared since 2012.
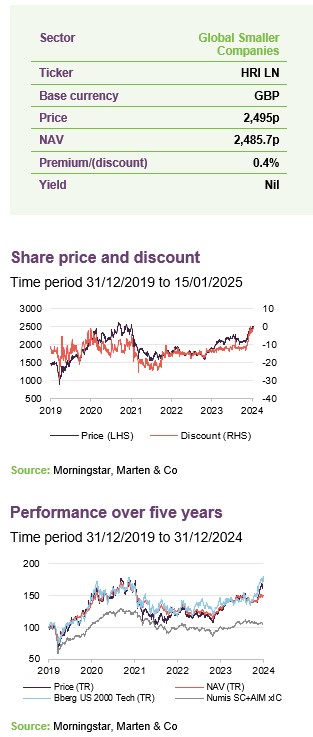
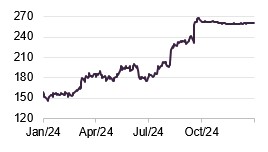
Premium/(discount)
HRI’s discount has narrowed substantially due to fears around tax changes and the board’s buy-back efforts.
Over the five years ended 31 December 2024, HRI traded on an average discount of 13.6%. However, over the last 12 months, HRI has traded at a narrower level, with a 12-month average discount of 10.4%. However, as can be seen in Figure 16, this has come with a more volatile discount, ranging from a max discount of 13.4% to a premium of 0.1%. As of 14 January 2025, HRI trades on a 0.4% premium.
HRI’s discount benefitted from a trend of gradual narrowing over the first 10 months of 2024, as shown in Figure 16. This may have been driven by an improving outlook for technology stocks, the board’s buyback initiatives, and share purchases by Saba Capital (detailed on page 3).
The last two months of 2024 saw heightened investor concerns surrounding the Labour Party’s budget – which raised potential fears of potential increases in capital gains taxes (an issue particularly for some longer-term investors who have booked significant gains over many years) – that increased the number of shares coming to market. HRI was able to repurchase some of these, but was active in the market alongside Saba, which was also actively buying to increase the size of its holding in advance of launching its activist campaign against HRI. The combined actions help drive the discount down, though Saba’s buying activities have been the primary factor in recent weeks, with HRI’s shares trading at par as of today.
Figure 16: HRI premium/(discount) over five years
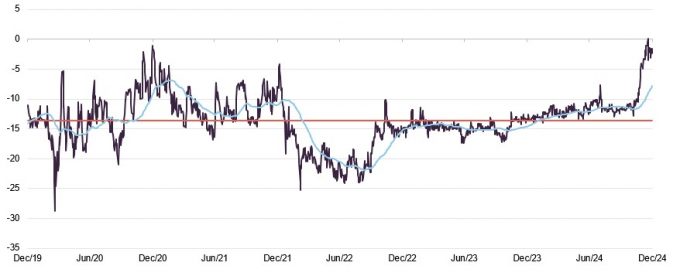
Source: Morningstar, Marten & Co
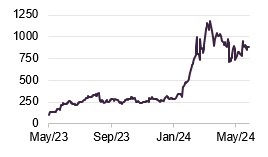
2024 was a year of near-record-high repurchases, just behind the 6m repurchased in 2023, as can be seen from Figure 17. Whilst HRI’s policy is not to attempt to control the discount, because it is not considered appropriate by its board or managers given the limited liquidity available within the underlying portfolio companies, the trust will repurchase shares when they deem it opportunistically advantageous. Where repurchases are undertaken, the aim is to enhance the NAV per share for remaining shareholders.
Figure 17: HRI share repurchases over the past 10 calendar years
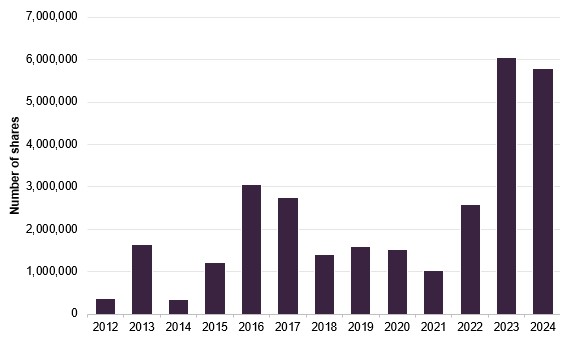
Source: Herald Investment Trust
Fund profile
More information can be found at the trust’s website: www.heralduk.com.
Established in 1994, HRI invests globally in small technology, communications and multimedia companies with the aim of achieving capital growth. It is the only UK listed fund of its type. The trust invests globally, but has a strong bias towards the UK, which further distinguishes it from other global technology funds, which can tend to be biased towards the US.
New investments in the fund will typically have a market capitalisation of $3bn or less but are generally much smaller when the first investment is made. If successful, these can grow to be a multiple of their original valuation. This type of investing is longer-term in nature and so the trust’s portfolio tends to have low turnover. Reflecting the risks inherent in this type of investing, and the liquidity constraints of having a small-cap investment remit, the trust maintains a highly diverse portfolio of investments (typically in excess of 250) to help mitigate this risk.
HRI’s lead fund manager, Katie Potts, has managed HRI since its launch.
Katie was a technology analyst at SG Warburg (later UBS) prior to launching the fund. She owns a substantial stake in the company and a significant minority stake in the management company. She has built of a team around her that now manages a large proportion of HRI’s portfolio – Katie is supported by 8 dedicated professionals.
Noteworthy members of the Herald team include: Fraser Elms – HRI’s deputy manager – who joined Herald Investment Management in 2000 and covers Herald’s Asian portfolios and the semiconductor sector; Taymour Ezzat, who joined in 2004 and covers Heralds European investments and media; Hao Luo, who also joined in 2004 helps cover Asia and manufacturing sectors alongside Peter Jenkin, who joined Herald in 2015, and also covers Herald’s North American and software investments.
HRI’s closed-ended structure can be advantageous during market selloffs
HRI has been lauded for playing an important role as a provider of capital to listed technology companies looking for expansion capital. This role could be particularly valuable in a downturn as it could provide HRI with additional opportunities to generate alpha when others are not able to.
HRI offers a liquid subcontract for any investor looking to gain access to this part of the market. Given their different focuses, an investment in HRI has the potential to be complementary to an investment in one of the large-cap technology funds.
Previous publications
Readers interested in further information about HRI may wish to read our previous notes (details are provided in Figure 18 below). You can read the notes by clicking on them in Figure 18 or by visiting our website.
IMPORTANT INFORMATION
Marten & Co (which is authorised and regulated by the Financial Conduct Authority) was paid to produce this note on Herald Investment Trust Plc.
This note is for information purposes only and is not intended to encourage the reader to deal in the security or securities mentioned within it. Marten & Co is not authorised to give advice to retail clients. The research does not have regard to the specific investment objectives financial situation and needs of any specific person who may receive it.
The analysts who prepared this note are not constrained from dealing ahead of it but, in practice, and in accordance with our internal code of good conduct, will refrain from doing so for the period from which they first obtained the information necessary to prepare the note until one month after the note’s publication. Nevertheless, they may have an interest in any of the securities mentioned within this note.
This note has been compiled from publicly available information. This note is not directed at any person in any jurisdiction where (by reason of that person’s nationality, residence or otherwise) the publication or availability of this note is prohibited.
Accuracy of Content: Whilst Marten & Co uses reasonable efforts to obtain information from sources which we believe to be reliable and to ensure that the information in this note is up to date and accurate, we make no representation or warranty that the information contained in this note is accurate, reliable or complete. The information contained in this note is provided by Marten & Co for personal use and information purposes generally. You are solely liable for any use you may make of this information. The information is inherently subject to change without notice and may become outdated. You, therefore, should verify any information obtained from this note before you use it.
No Advice: Nothing contained in this note constitutes or should be construed to constitute investment, legal, tax or other advice.
No Representation or Warranty: No representation, warranty or guarantee of any kind, express or implied is given by Marten & Co in respect of any information contained on this note.
Exclusion of Liability: To the fullest extent allowed by law, Marten & Co shall not be liable for any direct or indirect losses, damages, costs or expenses incurred or suffered by you arising out or in connection with the access to, use of or reliance on any information contained on this note. In no circumstance shall Marten & Co and its employees have any liability for consequential or special damages.
Governing Law and Jurisdiction: These terms and conditions and all matters connected with them, are governed by the laws of England and Wales and shall be subject to the exclusive jurisdiction of the English courts. If you access this note from outside the UK, you are responsible for ensuring compliance with any local laws relating to access.
No information contained in this note shall form the basis of, or be relied upon in connection with, any offer or commitment whatsoever in any jurisdiction.
Investment Performance Information: Please remember that past performance is not necessarily a guide to the future and that the value of shares and the income from them can go down as well as up. Exchange rates may also cause the value of underlying overseas investments to go down as well as up. Marten & Co may write on companies that use gearing in a number of forms that can increase volatility and, in some cases, to a complete loss of an investment.