February
Monthly | Investment companies
Kindly sponsored by abrdn
Winners and losers in January 2025
Despite an uncertain economic outlook, European focused trusts were among the best performers in January. In fact, the Stoxx Europe 600 benchmark index posted a 6% monthly gain, reaching 6.5% earlier in the month, its highest performance on a monthly basis in over two years. Outperforming the S&P500 by its widest margin in a decade, these gains signified an investor shift from US equities as trade war concerns brought on by President Trump saw heightened interest in large European stocks. Moreover, the switch of investor attention from the US was reinforced by the major sell-off of US AI stocks after the success of Chinese AI firm DeepSeek, which challenged the necessity of the level of funding and equipment in American AI technology. Meanwhile, the valuations of European small caps appeared particularly attractive, given that the European Central Bank continued its rate cuts.
Best performing sectors in January 2025 by total price return
| Median share price total return (%) |
Median NAV total return (%) |
Median discount 31/01/25 (%) |
Median sector market cap 31/01/25 (£m) | Number of companies in the sector | |
|---|---|---|---|---|---|
| Europe | 9.9 | 9.9 | (9.2) | 562.3 | 6 |
| Property – UK logistics | 7.0 | 0.0 | (30.6) | 509.7 | 3 |
| European smaller companies | 6.9 | 7.5 | (9.7) | 428.6 | 4 |
| Technology & technology innovation | 6.7 | 4.9 | (7.8) | 3,053.5 | 2 |
| North American smaller companies | 5.3 | 4.8 | (5.2) | 239.4 | 2 |
Contrasting with its poor run of form over December, the Property – UK logistics sector was supported by factors such as government efforts to improve inter-city transport connectivity, namely the re-establishment of the Oxford-Cambridge Arc initiative. Coming off the back of Blackstone’s acquisitions of warehouses amounting to over £1bn last year, investor optimism has been driven by the increasing demand for the sector’s limited supply. Although several technology investment companies were hit by the significant 17% plunge of Nvidia’s share price on 27 January, companies elsewhere in the technology sector made up for the losses, with trusts exposed to heavyweights like Amazon, whose stock closed on an all-time high on 28 January, to benefit from their rallies.
Anticipations of an incoming cut to interest rates by the Federal Reserve fuelled interest in North American smaller companies. It may also be worth noting that the sector’s gains could be cyclical, as for the last five out of six times a US president has been elected, the Russell 2000 index has outperformed the S&P500 for the next twelve months. Some point out that the reason for this may be that American smaller companies have a lesser exposure to the trade-related headwinds that larger companies are vulnerable to with their higher exposure to foreign markets.
On the downside, amid slowing growth brought on by reduced consumption and wage growth, the backdrop for Indian equities has been challenging. January marked a fourth consecutive month of decline for Indian stocks, with the benchmark indices Nifty 50 and Sensex experiencing their longest monthly decline in over twenty-three years. Contributing factors include worse than expected earnings, in addition to pull backs on foreign investment.
Worst performing sectors in January 2025 by total price return
| Median share price total return (%) |
Median NAV total return (%) |
Median discount 31/01/25 (%) |
Median sector market cap 31/01/25 (£m) | Number of companies in the sector | |
|---|---|---|---|---|---|
| India/indian subcontinent | (5.7) | (5.2) | (13.8) | 423.5 | 4 |
| Renewable energy infrastructure | (4.3) | 0.0 | (37.3) | 229.2 | 21 |
| Infrastructure | (2.7) | 0.0 | (25.1) | 866.4 | 9 |
| Leasing | (1.5) | 0.8 | (32.8) | 163.3 | 5 |
| Growth capital | (1.4) | 0.0 | (36.5) | 121.0 | 7 |
Materialising the concerns of renewable energy investors, President Trump’s first month in office saw the signing of many executive orders, such as ‘Unleashing American Energy’ by raising fossil fuel resource exploration and production, whilst halting funding for the Inflation Reduction Act. Another factor at work was rising government bond yields, this also affected demand for infrastructure funds.
The leasing sector’s downturn was prompted by individual declines in performance, notably for Taylor Maritime Investments due to the falling value of one of its fleets.
Best performing investment companies
Back as the top performing trust after two months, Golden Prospect Precious Metals’ NAV and share price jumped with the price of gold, which surged to a record $2,800 per ounce on 31 January, a nearly 7% increase year to date. Investors flocked to the metal to protect their investments against geopolitical uncertainty, which has been exacerbated by perceptions of the US’s new presidential administration. CQS Natural Resources Growth and Income was also a beneficiary of this. Elsewhere in the commodities sector, Geiger Counter’s share price growth was supplemented by a share buyback, in addition to renewed interest in nuclear energy. The previously mentioned ‘Unleashing American Energy’ executive order has called for a re-evaluation of the US’ energy sources, bringing greater focus on nuclear production. However, the president has threatened 25% tariffs on Canada, the country’s largest supplier of uranium.
The improving picture for the private sector among Latin American countries supported BlackRock Latin American’s NAV and share price growth. Foreign investment has increased as countries across the region have shown greater participation in digital transformation. The region was the top recipient of foreign investment flows among emerging markets in 2024, receiving $6.6bn whilst Emerging Asia took in $5.3bn.
As discussed, numerous European equities enjoyed a month of rallies. All the European focused trusts in the table benefitted from their holdings in Novo Nordsik. The Danish pharmaceutical giant’s share price rose in January after the positive news of its amycretin clinical trials, strengthened by investor anticipation of good news in the firm’s February results. Moreover, Fidelity European Trust was also able to benefit from the gains of its overweight position in Deutsche Borse, the operator of the Frankfurt Stock Exchange is benefitting from higher turnover. For Baillie Gifford European Growth and Income, a large share buyback programme by Ferrari has had a positive influence on its NAV, as the luxury car manufacturer continues with its roughly €2bn programme. Another notable company present in the portfolios of some of these trusts is ASML, the semiconductor equipment manufacturer, which profited from the excitement surrounding its strong results for the last quarter. As discussed, European small caps were receptive to news of an ECB rate cut, which is evident in Montanaro European Smaller’s share price growth.
A globally diversified portfolio permitted Scottish Mortgage to take advantage of the rallies of select US tech large caps like Amazon, whilst also benefiting from the growth seen in Europe and in holdings elsewhere like Mercardo Libre, which built on its leading market position in Latin American e-commerce. Interestingly, SMT was rewarded by its November decision to reduce its exposure to Nvidia, as manager Tom Slater cited the ‘high cost’ of ‘large-scale AI adoption’, a move that diminished the impact of the tech company’s historical price drop on SMT’s NAV and share price.
Best performing trusts in total NAV (LHS) and share price (RHS) terms over January 2025
| Fund | Sector | (%) | Fund | Sector | (%) |
|---|---|---|---|---|---|
| Golden Prospect Precious Metal | Commodities & natural resources | 20.9 | Ground Rents Income Fund | Property – UK residential | 46.4 |
| BlackRock Latin American | Latin America | 12.9 | Golden Prospect Precious Metal | Commodities & natural resources | 16.9 |
| Fidelity European Trust | Europe | 10.3 | Downing Renewables & Infrastructure | Renewable energy infrastructure | 15.3 |
| European Opportunities Trust | Europe | 9.9 | Amedeo Air Four Plus | Leasing | 14.3 |
| Baillie Gifford European Growth | Europe | 9.9 | Scottish Mortgage | Global | 13.7 |
| BlackRock Greater Europe | Europe | 9.8 | Geiger Counter | Commodities & natural resources | 13.4 |
| CQS Natural Resources G&I | Commodities & natural resources | 9.6 | Baillie Gifford European Growth | Europe | 12.1 |
| Scottish Mortgage | Global | 9.6 | Petershill Partners | Growth capital | 11.5 |
| Henderson European Trust | Europe | 8.6 | BlackRock Latin American | Latin America | 11.2 |
| JPMorgan European Growth & Income | Europe | 8.6 | Montanaro European Smaller | European smaller companies | 10.3 |
Leading the share price growth column by some distance, Ground Rents Income Fund was propelled higher by a £32.5m offer by Victoria Property for the embattled trust. More offers followed over the month but GRIO’s board has rejected these advances.
Share buybacks contributed to a rise in Downing Renewables and Infrastructure’s share price, but we would also like to think that investors are recognising the trust’s superior growth profile. Over in the leasing sector, Amedeo Air Four Plus announced an agreement with Emirates that will see the redelivery of an aircraft along with a $17m payment. With spare cash on its balance sheet, the company also announced a £27.8m compulsory redemption of shares. Petershill Group built on its substantial growth last year with a January sale of most of its holding in General Catalyst, amounting to a figure of $726m.
Worst performing investment companies
As mentioned, Indian focused funds endured one of their worst months in recent years, with several factors at play, one of which has been faltering consumer demand, as 72% of companies listed on the Nifty 50 showed lowered earnings per share revisions. Dixon Technologies India, a core holding for India Capital Growth Fund, suffered a price fall in the wake of reduced estimates for the company’s earnings forecasts. With considerable allocations to Tata Consultancy Services, both abrdn New India and Ashoka India Equity’s NAV were impacted by the software firm’s failure to meet expectations for its third quarter results.
Although Ground Rents Income Fund topped the list for share price growth, it also led the list for falls in NAV, which was brought on by several legacy issues and ongoing headwinds related to building safety and leasehold reform. The management of Taylor Maritime Investments cited the soft values of its assets for its performance.
The NAV falls of both BH Macro GBP and BH Macro USD came alongside the announcement of its class closure resolution that could result in a few different outcomes, including a wind up of the trust if holders of both of its classes approve the resolution.
The woes of Digital 9 Infrastructure persisted through January, marked by the ‘extremely disappointing’ agreement to sell its stake in subsea fibre business, Aqua Comms, for roughly £40m. DGI9 cited Aqua Comms’ inability to profit from its expansion plans and RCF-induced restrictions as core factors for the fall in the company’s valuation.
Worst performing trusts in total NAV (LHS) and share price (RHS) terms over January 2025
| Ground Rents Income Fund | Property – UK residential | (14.1) | Digital 9 Infrastructure | Infrastructure | (52.4) |
| India Capital Growth | India/indian subcontinent | (7.2) | VH Global Energy Infrastructure | Renewable energy infrastructure | (18.5) |
| Ashoka India Equity Investment | India/indian subcontinent | (5.2) | Bluefield Solar Income Fund | Renewable energy infrastructure | (12.7) |
| Aberforth Geared Value & Income | UK smaller companies | (5.1) | Taylor Maritime Investments | Leasing | (11.9) |
| abrdn New India Investment Trust | India/indian subcontinent | (5.1) | India Capital Growth | India/indian subcontinent | (11.2) |
| BH Macro GBP | Hedge funds | (4.8) | Aberforth Geared Value & Income | UK smaller companies | (10.8) |
| HgCapital Trust | Private equity | (4.6) | Gresham House Energy Storage | Renewable energy infrastructure | (10.6) |
| BH Macro USD | Hedge funds | (4.4) | Life Science REIT | Property – UK commercial | (10.5) |
| NB Distressed Debt Inv Extended Life | Debt – loans & bonds | (4.3) | Rights & Issues Investment Trust | UK smaller companies | (10.1) |
| Premier Miton Glb Renewables Trust | Infrastructure securities | (3.7) | Syncona | Biotechnology & healthcare | (9.9) |
The recent political changes in the US may be influential in the share price falls of renewable energy infrastructure funds. Among the funds in the above table is VH Global Energy Infrastructure, despite the positive news of the successful energising of two solar assets in Brazil. However, general negative sentiment surrounding the sector seems to have dampened any gains.
UK small cap trusts continue to struggle as evidenced by the presence of Aberforth Geared Value and Income and Rights and Issues in this table. Syncona’s ongoing buy backs failed to shore up its share price.
Moves in discounts and premiums
The surge in Ground Rents Income Fund’s share price saw its discount narrow considerably, whilst difficulties for the renewable energy infrastructure sector led to several discounts widening. Most entrants on the table have been already mentioned, except for Livermore Investments which featured amongst the list of best-performing trusts last year – as featured in our annual roundup.
Discounts in the renewable energy sector continue to break records and are impossible to justify. Bluefield Solar’s share price, for example, is hitting new lows. It now offers a yield in excess of 10.9% on a dividend that has been growing and is well covered by earnings. Moreover, much of the company’s income is locked in through subsidy arrangements or forward sales of power. Bluefield Solar also has a funding arrangement with a consortium of UK pension funds to help finance its pipeline of new projects. There is no logic to the discount which, we feel, must reflect a buyers’ strike by professional investors related to misleading cost disclosure rules. The danger is that an investor with deep pockets takes advantage of the opportunity by bidding for this and/or other trusts in the sector at a knockdown price.
More expensive (LHS) and cheaper (RHS) relative to NAV over January 2025
| Fund | Sector | Disc/ Prem 31/12/24 (%) |
Disc/ Prem 31/01/25 (%) |
Fund | Sector | Disc/ Prem 31/12/24 (%) |
Disc/ Prem 31/01/25 (%) |
|---|---|---|---|---|---|---|---|
| Ground Rents Income Fund | Property – UK residential | (69.0) | (44.9) | Digital 9 Infrastructure | Infrastructure | (58.7) | (80.3) |
| Geiger Counter | Commodities & natural resources | (16.1) | (4.8) | VH Global Energy Infrastructure | Renewable energy infrastructure | (40.7) | (51.8) |
| Downing Renewables & Infrastructure | Renewable energy infrastructure | (34.6) | (24.9) | Rights & Issues Investment Trust | UK smaller companies | (5.2) | (15.5) |
| Petershill Partners | Growth capital | (23.6) | (16.1) | Taylor Maritime Investments | Leasing | (22.7) | (32.8) |
| Livermore Investments | Flexible investment | (20.0) | (12.6) | Bluefield Solar Income Fund | Renewable energy infrastructure | (25.4) | (35.3) |
Money raised and returned
| Fund | Sector | £m raised | Fund | Sector | £m returned |
|---|---|---|---|---|---|
| JPMorgan Global Growth & Income | Global equity income | 22.0 | Scottish Mortgage | Global | (250.6) |
| JPMorgan American | North America | 12.5 | Finsbury Growth & Income | UK equity income | (42.6) |
| Ashoka India Equity Investment | India/indian subcontinent | 7.1 | Pershing Square Holdings | North America | (39.4) |
| CVC Income & Growth GBP | Debt – loans & bonds | 6.2 | Monks | Global | (37.2) |
| M&G Credit Income Investment | Debt – loans & bonds | 3.2 | Smithson Investment Trust | Global smaller companies | (29.9) |
JPMorgan Global Growth and Income’s popularity continues to translate into stock issuance, while JPMorgan American appears for a second month running. Ashoka India Equity continues to issue stock, despite the setback in Indian markets that we referred to earlier. The higher interest rate environment means that bond funds are in still vogue.
It is no surprise to see Scottish Mortgage dominating the buyback list, adding to the over £1bn of shares purchased over 2024. Finsbury Growth and Income, Monks, Pershing Square, and Smithson Investment Trust also feature regularly in this table. Pershing Square’s various attempts to pull off some corporate transaction that would boost its rating have failed and its one-year NAV returns are lagging those of peers such as JPMorgan American and North American Income.

Major news stories and QuotedData views over January 2025
Portfolio developments
- JPMorgan Emerging EMEA Securities announces proceedings to restrain VTB Bank
- HydrogenOne’s Sunfire gets €200m of guaranteed funding
- Majority of Chrysalis’s portfolio continues to perform strongly
- HydrogenOne’s Elcogen secures investment from SmartCap
- Digital 9 Infrastructure sells Aqua Comms for “extremely disappointing” US$48m
- Positive momentum for Gore Street Energy Storage Fund as Californian project energised
- 75% of Oakley Capital Investments NAV growth driven by earnings gains
- Bankers looks to increased US exposure to address underperformance
- Stock selection drives impressive gains for BlackRock Income and Growth
- Sale of Calpine adds 3p to Pantheon Infrastructure’s NAV
- RTW announces Windward Bio and Umoja Biopharma investments
- Triple Point Energy Transition sells remaining investments
- CC Japan Income & Growth’s NAV continues to beat
- Greencoat UK Wind revises yield estimates with 6.5p hit to NAV
- HarbourVest shake up to narrow discount
- Aberforth Smaller Companies beats benchmark in good year for UK equities
Corporate news
- Herald urges shareholders to VOTE AGAINST Saba’s resolutions
- Edinburgh Worldwide questions validity of Saba’s requisition
- CQS Natural Resources – Saba’s proposals “without merit and misleading”
- abrdn Asian Income announces enhanced dividend policy
- Patria Private Equity extends loan facility for three more years
- Class closure meetings triggered for BH Macro
- GCP Infrastructure sells interests in two onshore wind assets
- The European Smaller Companies Trust introduces three-yearly conditional tender offer
- Keystone Positive Change presses pause on capital return pending Saba vote
- Herald highlights significant long term underperformance from Saba
- Glass Lewis reiterates vote “AGAINST” all Saba’s proposed requisitioned resolutions for KPC
- abrdn Diversified Income and Growth makes progress on wind-down
- BlackRock Trusts off limits for Saba until at least 2027
- All three proxy advisers say VOTE AGAINST SABA’S PROPOSALS for CQS Natural Resources
- Patria Private Equity extends loan facility for three more years
Property news
- Ground Rents Income Fund receives £32.5m potential offer for company
- LondonMetric makes £124m of sales and acquisitions
- Residential Secure Income progresses with portfolio sale
- abrdn European Logistics Income sells first three assets of managed wind-down
- Ground Rents Income posts new NAV following possible offer for the company
- Home REIT publishes 2023 annual accounts
- Macau Property Opportunities wind up limps on
- Tritax Big Box REIT taps into data centre boom with London development
- Tritax Big Box REIT pre-let 1m sq ft scheme
- Safestore investing in growth
- Social Housing REIT proposes change to investment policy to deal with non-performing tenant
QuotedData views
Visit www.quoteddata.com for more on these and other stories plus in-depth analysis on some funds, the tools to compare similar funds and basic information, key documents and regulatory news announcements on every investment company quoted in London.

Interviews
Have you been listening to our weekly news round-up shows? Every Friday at 11 am, we run through the more interesting bits of the week’s news, and we usually have a special guest or two answering questions about a particular investment company.
Research
The first nine months of 2024 provided signs of a return to normality in the UK. With inflation falling steeply, the Bank of England was able to begin its interest rate-cutting cycle, while a steady pickup in growth provided a sense of optimism that had long been absent from the market. The Rights and Issues Investment Trust (RIII) responded in kind, delivering a shareholder total return of 17% to 30 September 2024. Unfortunately, this momentum slowed over the latter part of the year as investors fled UK small caps, particularly AIM (Alternative Investment Market) stocks, in advance of the budget, and yields climbed on both UK government bonds (gilts) and US treasuries, back towards cycle highs.
Although frustrating for investors, we believe the conditions that drove the first half recovery remain in place, and the recent weakness should not detract from the generally positive outlook for the UK, and RIII in particular. Market activity has finally begun to pick up as investors capitalise on historically cheap valuations and we believe that for active, high-conviction managers like RIII’s, the opportunity to outperform in the coming years has arguably never been better.
For most of 2024, financial conditions had finally started to turn favourably for infrastructure investors. Inflation had dropped sharply from the previous year, allowing the Bank of England to begin its interest rate cutting cycle, while the new government’s ambitious plans for infrastructure development provided a renewed sense of optimism across the sector. These green shoots were evidenced by GCP’s annual results, which showed a total shareholder return of 28.4%, leading to a significant narrowing of its stubborn discount to net asset value (NAV). Unfortunately, a negative reaction to the UK budget, and concerns around the inflationary impact of US tariffs, saw the yield on UK gilts retrace their highs, erasing some of these gains.
Despite this, we remain increasingly optimistic about GCP’s prospects as it continues to execute on its capital recycling programme (see page 8). Coupled with improving market conditions, an impressive policy backdrop, and its long track record of capitalising on changing market dynamics, we believe there is a considerable opportunity for investors at current prices.
Despite having many attractive features, NextEnergy Solar Fund (NESF) has seen its share price derate significantly during the last two years (driven largely by macroeconomic headwinds, such as the impact of higher interest rates on income-producing assets, which has affected the whole renewable energy sector and has been a factor again very recently). A hefty and, in our view irrational, discount to net asset value (NAV) has opened up, bringing with it significant yield expansion – NESF now has the second-highest dividend yield in the FTSE 350 – despite its dividend being 1.3x cash-covered during its financial year ended 31 March 2024 (FY2024), with a coverage target of 1.1x – 1.3x for the year ending 31 March 2025 (FY2025) on a higher target dividend.
NESF has been making progress with its capital recycling programme (a strategy that involves selling assets and reinvesting the proceeds into higher-returning opportunities) (see page 8), with the proceeds used to reduce debt and fund share repurchases that, at current discount to NAV levels, are very NAV-accretive. The final phase for 100MW of assets could prove transformational.
Polar Capital Technology’s (PCT’s) manager contends that it has never been a better time to be an active manager in the artificial intelligence (AI) driven technology sector, with potential winners diversifying from the magnificent seven (Mag7) technology stocks (a group of seven major technology companies that have demonstrated significant influence and performance in financial markets, particularly in recent years – Apple, Microsoft, Aplhabet, Amazon, NVIDIA, Tesla and Meta Platforms) to a range of sectors and companies. Reflecting this, the fund’s active share is as large at 50% as it has ever been, on the expectation that the spread in performance between large-cap and small- and mid-cap technology stocks will narrow considerably.
AI innovation, capex and adoption rates have all continued their rapid growth since our last note six months ago, which should act to quell fears of an AI-induced technology valuation bubble. The pace of corporate adoption has been particularly impressive, with several use-cases pointing to vast efficiency and productivity gains, suggesting a snowball in adoption. The skills of an active manager such as PCT’s in picking AI winners (and identifying incumbent casualties) makes its 12.3% discount to net asset value (NAV) look good value.
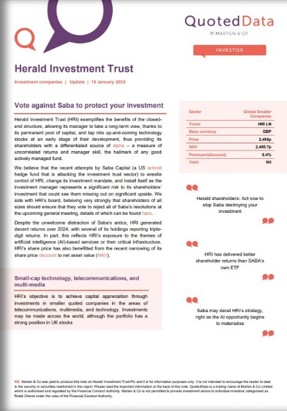
Herald Investment Trust (HRI) exemplifies the benefits of the closed-end structure, allowing its manager to take a long-term view, thanks to its permanent pool of capital, and tap into up-and-coming technology stocks at an early stage of their development, thus providing its shareholders with a differentiated source of alpha – a measure of uncorrelated returns and manager skill, the hallmark of any good actively managed fund.
We believe that the recent attempts by Saba Capital (a US activist hedge fund that is attacking the investment trust sector) to wrestle control of HRI, change its investment mandate, and install itself as the investment manager represents a significant risk to its shareholders’ investment that could see them missing out on significant upside. We side with HRI’s board, believing very strongly that shareholders of all sizes should ensure that they vote to reject all of Saba’s resolutions at the upcoming general meeting, details of which can be found here.
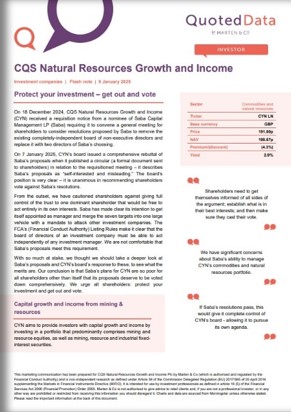
On 18 December 2024, CQS Natural Resources Growth and Income (CYN) received a requisition notice from a nominee of Saba Capital Management LP (Saba) requiring it to convene a general meeting for shareholders to consider resolutions proposed by Saba to remove the existing completely-independent board of non-executive directors and replace it with two directors of Saba’s choosing.
On 7 January 2025, CYN’s board issued a comprehensive rebuttal of Saba’s proposals when it published a circular (a formal document sent to shareholders) in relation to the requisitioned meeting – it describes Saba’s proposals as “self-interested and misleading.” The board’s position is very clear – it is unanimous in recommending shareholders vote against Saba’s resolutions.
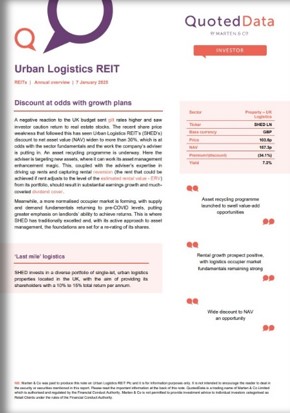
A negative reaction to the UK budget sent gilt rates higher and saw investor caution return to real estate stocks. The recent share price weakness that followed this has seen Urban Logistics REIT’s (SHED’s) discount to net asset value (NAV) widen to more than 30%, which is at odds with the sector fundamentals and the work the company’s adviser is putting in. An asset recycling programme is underway. Here the adviser is targeting new assets, where it can work its asset management enhancement magic. This, coupled with the adviser’s expertise in driving up rents and capturing rental reversion (the rent that could be achieved if rent adjusts to the level of the estimated rental value – ERV) from its portfolio, should result in substantial earnings growth and much-coveted dividend cover.
Meanwhile, a more normalised occupier market is forming, with supply and demand fundamentals returning to pre-COVID levels, putting greater emphasis on landlords’ ability to achieve returns. This is where SHED has traditionally excelled and, with its active approach to asset management, the foundations are set for a re-rating of its shares.
Upcoming events
Here is a selection of what is coming up. Please refer to the Events section of our website for updates between now and when they are scheduled:
- JPMorgan Indian AGM 2025
- River UK Micro Cap shareholder presentation 2025
- GCP Infrastructure Investments AGM 2025
- Polar Capital Global Healthcare AGM 2025
- Edinburgh Worldwide EGM 2025
- BlackRock Throgmorton Trust EGM 2025
- Impax Environmental Markets EGM 2025
- abrdn Equity Income Trust EGM 2025
- Biotech Growth Trust EGM 2025
- Majedie Investments AGM 2025
- JPMorgan Asia Growth & Income 2025 AGM
- Home REIT AGM 2025
- Downing Strategic Micro-Cap EGM 2025
- Schroder UK Mid Cap Fund AGM 2025
- Triple Point Energy Transition EGM 2025
- Bankers Investment Trust AGM 2025
- Renewables Infrastructure Group shareholder presentation 2025
- abrdn Diversified Income and Growth AGM 2025
- Bluefield Solar Income Fund shareholder presentation 2025
Guide

Our independent guide to quoted investment companies is an invaluable tool for anyone who wants to brush up on their knowledge of the investment companies’ sector. Please register on www.quoteddata.com if you would like it emailed to you directly.
Appendix 1 – median performance by sector, ranked by 2025 year to date price total return
| YTD Rank |
Sector | Share price total return YTD (%) | NAV total return YTD (%) |
Discount 31/01/25 (%) |
Discount 31/12/24 (%) |
Change in discount (%) |
Median mkt cap 31/01/24 (£m) |
|---|---|---|---|---|---|---|---|
| 1 | Latin America | 11.2 | 12.9 | (11.9) | (11.6) | 2.9 | 89.9 |
| 2 | Europe | 9.9 | 9.9 | (9.2) | (10.0) | (8.1) | 562.3 |
| 3 | Property – UK logistics | 7.0 | 0.0 | (30.6) | (34.9) | (12.2) | 509.7 |
| 4 | European smaller companies | 6.9 | 7.5 | (9.7) | (10.7) | (9.2) | 428.5 |
| 5 | Technology & technology innovation | 6.7 | 4.9 | (7.8) | (9.4) | (16.3) | 3,053 |
| 6 | North American smaller companies | 5.3 | 4.8 | (5.2) | (5.7) | (10.0) | 239.4 |
| 7 | Global | 5.3 | 5.2 | (7.6) | (8.0) | (5.0) | 842.9 |
| 8 | Global equity income | 5.1 | 4.4 | (7.4) | (8.9) | (16.8) | 333.1 |
| 9 | China / greater China | 4.6 | 2.0 | (10.5) | (12.9) | (18.4) | 193.0 |
| 10 | Environmental | 4.6 | 4.4 | (8.9) | (10.2) | (12.9) | 125.3 |
| 11 | Biotechnology & healthcare | 4.4 | 3.9 | (10.3) | (12.5) | (17.9) | 369.7 |
| 12 | North America | 4.2 | 4.7 | (8.7) | (8.0) | 7.6 | 428.0 |
| 13 | Property – UK healthcare | 4.2 | 0.0 | (27.1) | (29.6) | (8.5) | 446.0 |
| 14 | UK equity income | 3.5 | 4.8 | (6.2) | (6.9) | (8.8) | 384.6 |
| 15 | UK all companies | 3.4 | 4.1 | (9.8) | (10.1) | (3.2) | 268.7 |
| 16 | Commodities & natural resources | 3.3 | 3.9 | (11.0) | (16.1) | (31.8) | 69.7 |
| 17 | Japan | 3.1 | 2.9 | (12.3) | (13.1) | (6.0) | 301.0 |
| 18 | Asia Pacific equity income | 2.9 | 3.8 | (9.2) | (9.3) | (0.9) | 338.3 |
| 19 | Global emerging markets | 2.8 | 3.0 | (11.9) | (12.8) | (7.2) | 296.2 |
| 20 | Debt – structured finance | 2.7 | 1.0 | (8.7) | (17.3) | (49.5) | 166.5 |
| 21 | Japanese smaller companies | 2.7 | 3.2 | (3.5) | (3.0) | 16.8 | 332.5 |
| 22 | Global smaller companies | 2.2 | 3.0 | (11.3) | (9.1) | 24.7 | 755.5 |
| 23 | Insurance & reinsurance strategies | 2.2 | 0.8 | (19.5) | (20.6) | (5.2) | 68.3 |
| 24 | UK equity & bond income | 1.8 | 4.8 | (9.9) | (7.0) | 40.9 | 284.8 |
| 25 | Asia Pacific | 1.3 | 1.3 | (12.5) | (12.0) | 4.2 | 526.8 |
| 26 | Property – Europe | 1.0 | 0.6 | (38.1) | (38.1) | 0.0 | 199.2 |
| 27 | Country specialist | 0.9 | 2.4 | (14.9) | (12.2) | 21.6 | 380.4 |
| 28 | Hedge funds | 0.8 | 0.8 | (19.4) | (18.2) | 6.3 | 88.9 |
| 29 | Debt – loans & bonds | 0.8 | 1.1 | 0.4 | 0.2 | 145.5 | 143.0 |
| 30 | Flexible investment | 0.8 | 1.1 | (12.6) | (20.0) | (36.8) | 108.5 |
| 31 | Private equity | 0.6 | 0.0 | (33.3) | (31.4) | 5.8 | 587.2 |
| 32 | UK smaller companies | 0.3 | 0.0 | (11.3) | (11.5) | (2.1) | 102.5 |
| 33 | Property – rest of world | 0.0 | 0.0 | (74.9) | (68.1) | (12.9) | 16.3 |
| 34 | Property – debt | 0.0 | 0.0 | (14.8) | (11.9) | 23.9 | 27.1 |
| 35 | Financials & financial innovation | (0.4) | 3.2 | (22.2) | (20.1) | 10.0 | 395.9 |
| 36 | Asia Pacific smaller companies | (0.4) | (2.8) | (13.8) | (15.8) | (12.6) | 349.1 |
| 37 | Infrastructure securities | (0.4) | 0.0 | (12.4) | (11.9) | 3.4 | 109.0 |
| 38 | Property – UK residential | (0.7) | 0.0 | (49.2) | (40.7) | 20.7 | 91.3 |
| 39 | Debt – direct lending | (0.9) | 0.0 | (16.8) | (16.5) | 1.9 | 79.3 |
| 40 | Property – UK commercial | (1.2) | 0.0 | (25.5) | (22.6) | 12.4 | 140.2 |
| 41 | Growth capital | (1.4) | 0.0 | (36.5) | (35.4) | 3.0 | 120.9 |
| 42 | Leasing | (1.5) | 0.8 | (32.8) | (23.7) | 38.5 | 163.3 |
| 43 | Infrastructure | (2.7) | 0.0 | (25.1) | (21.7) | 15.2 | 866.4 |
| 44 | Renewable energy infrastructure | (4.3) | 0.0 | (37.3) | (34.2) | 8.9 | 229.1 |
| 45 | India/Indian subcontinent | (5.7) | (5.2) | (13.8) | (12.2) | 13.4 | 423.5 |
MEDIAN |
2.2 | 1.3 | (12.3) | (12.5) | 0.07 | 279.7 |
IMPORTANT INFORMATION
This note was prepared by Marten & Co (which is authorised and regulated by the Financial Conduct Authority).
This note is for information purposes only and is not intended to encourage the reader to deal in the security or securities mentioned within it. Marten & Co is not authorised to give advice to retail clients. The note does not have regard to the specific investment objectives, financial situation and needs of any specific person who may receive it.
Marten & Co may have or may be seeking a contractual relationship with any of the securities mentioned within the note for activities including the provision of sponsored research, investor access or fundraising services.
This note has been compiled from publicly available information. This note is not directed at any person in any jurisdiction where (by reason of that person’s nationality, residence or otherwise) the publication or availability of this note is prohibited.
Accuracy of Content: Whilst Marten & Co uses reasonable efforts to obtain information from sources which we believe to be reliable and to ensure that the information in this note is up to date and accurate, we make no representation or warranty that the information contained in this note is accurate, reliable or complete. The information contained in this note is provided by Marten & Co for personal use and information purposes generally. You are solely liable for any use you may make of this information. The information is inherently subject to change without notice and may become outdated. You, therefore, should verify any information obtained from this note before you use it.
No Advice: Nothing contained in this note constitutes or should be construed to constitute investment, legal, tax or other advice.
No Representation or Warranty: No representation, warranty or guarantee of any kind, express or implied is given by Marten & Co in respect of any information contained in this note.
Exclusion of Liability: To the fullest extent allowed by law, Marten & Co shall not be liable for any direct or indirect losses, damages, costs or expenses incurred or suffered by you arising out or in connection with the access to, use of or reliance on any information contained in this note. In no circumstance shall Marten & Co and its employees have any liability for consequential or special damages.
Governing Law and Jurisdiction: These terms and conditions and all matters connected with them, are governed by the laws of England and Wales and shall be subject to the exclusive jurisdiction of the English courts. If you access this note from outside the UK, you are responsible for ensuring compliance with any local laws relating to access.
No information contained in this note shall form the basis of, or be relied upon in connection with, any offer or commitment whatsoever in any jurisdiction.
Investment Performance Information: Please remember that past performance is not necessarily a guide to the future and that the value of shares and the income from them can go down as well as up. Exchange rates may also cause the value of underlying overseas investments to go down as well as up. Marten & Co may write on companies that use gearing in a number of forms that can increase volatility and, in some cases, to a complete loss of an investment.