May
Monthly | Investment companies
Winners and losers in April 2025
April’s top performing sector, Infrastructure Securities, was buoyed by improving sentiment around interest rate stability and a broader rebound in risk appetite. Although these funds typically move in line with bond markets, their equity-like traits may have drawn income-seeking investors back into the fold as inflation expectations settled. It should also be said that Premier Miton Global Renewables was boosted by its highly geared structure. The strong showing from Japanese Smaller Companies reflects the benefits of continued corporate governance reforms despite a weaker yen. These stocks are cheap, as evidenced by their low price to book ratios. Moreover, despite the market slumps following US president Trump’s “Liberation day”, there was relative optimism that Japan’s leadership might be able to negotiate the lowering of tariffs on auto manufacturers, which reversed earlier price losses.
European Smaller Companies also performed well, likely fuelled by signs of improving economic data across the eurozone, stimulus from Germany, and easing recession fears. European stocks were also encouraged by a calmer end of the month to the US trade saga, seeing the European STOXX Europe 600 rising by 2.8%. Small caps have appeared especially cheap recently, helped by the expectation of outperforming their larger peers amid rate cuts, which the European Central Bank continued to execute in April.
Best performing sectors in April 2025 by total price return
| Median share price total return (%) |
Median NAV total return (%) |
Median discount 30/04/25 (%) |
Median sector market cap 30/04/25 (£m) | Number of companies in the sector | |
|---|---|---|---|---|---|
| Infrastructure Securities | 5.1 | 4.3 | (13.8) | 113.5 | 2 |
| Japanese Smaller Companies | 4.1 | 2.7 | (2.9) | 301.0 | 3 |
| European Smaller Companies | 3.9 | 4.4 | (8.3) | 415.2 | 4 |
| Renewable Energy Infrastructure | 3.8 | (1.2) | (33.7) | 376.1 | 19 |
| Property – UK Commercial | 3.5 | 1.6 | (16.9) | 157.1 | 10 |
Interestingly, Renewable Energy Infrastructure made the list despite a negative NAV return, suggesting that discount narrowing might have played a major role as investors revisited the recently challenged sector on valuation grounds. As the AIC noted, tariff related sell offs propelled the sector’s yields to an all-time high in April, reaching 10.6%. Finally, UK Commercial Property’s recovery could be reflective of tentative optimism about the outlook for interest rates, in addition to strong rental growth off the back of its sector’s positive first quarter performance.
Worst performing sectors in April 2025 by total price return
| Median share price total return (%) |
Median NAV total return (%) |
Median discount 30/04/25 (%) |
Median sector market cap 30/04/25 (£m) | Number of companies in the sector | |
|---|---|---|---|---|---|
| China / Greater China | (10.9) | (8.4) | (11.0) | 210.9 | 3 |
| Country Specialist | (8.5) | (10.7) | (16.8) | 314.4 | 4 |
| North American Smaller Companies | (7.3) | (6.6) | (9.8) | 176.7 | 2 |
| Growth Capital | (4.8) | (1.4) | (43.0) | 122.8 | 7 |
| Debt – Structured Finance | (3.9) | 0.8 | (12.0) | 155.8 | 4 |
In terms of the worst performing sectors, China trusts were hit hardest, amid underwhelming economic data and investor doubts over the effectiveness of Beijing’s stimulus efforts. The major cause for concern was the escalating trade tensions with the US, which was met with a sharp fall in Chinese markets, indicated by the Shanghai Composite Index’s daily drop of 12% on 7 April, the largest fall since the 2008 global financial crisis. Funds with exposure to Hong Kong would have also been affected, with the Hang Seng Index posting a daily fall of 13.2%, the largest since the 1997 Asian financial crisis.
The Country Specialist sector also struggled due to its majority exposure to Vietnamese funds. An entirely unexpected proposal for 46% US tariffs on Vietnamese goods led to significant losses. In fact, between 15 and 19 April, approximately $20bn was wiped off Vietnamese market caps, as foreign withdrawals exacerbated these falls.
North American Smaller Companies suffered as the market priced in fewer rate cuts from the Fed, there were increased concerns about a US recession, and small-cap earnings guidance disappointed. The country’s small caps are particularly vulnerable, due to their heightened sensitivities to domestic conditions. The Russell 2000 Index, the benchmark for US small caps, dropped by 6.6% on 3 April, a 20% plummet from a previous high. For the third straight week through to 30 April, US focused funds saw major outflows, with $3.9bn coming directly out of small cap funds.
Meanwhile, Growth Capital trusts struggled due to illiquidity, a more difficult environment for portfolio exits, and widening discounts, a theme that has persisted despite efforts to reassure investors. Early stage high growth companies will have also been susceptible to tariff related downturns. The Debt – Structured Finance sector saw its share prices slide despite modest NAV gains, reflecting growing caution around credit quality, especially in real estate-linked assets. Investor appetite for complex debt strategies appears to have waned as macro uncertainty continues.
Best performing investment companies
It was a strong month for Geiger Counter, which possibly benefitted from the renewed interest in nuclear as a clean energy source amid Europe’s lingering energy security concerns. The trust has also been helped by stabilising uranium prices and sustained demand forecasts driven by reactor restarts and new builds in Asia and the Middle East.
In the case of BlackRock Latin American, commodity prices and a rebound in Brazilian equities were strong influences on its NAV. Progress on interest rate cutting cycles across the region and improving currency stability also bolstered returns. Notably, Mexican equities, which make up a considerable portion of the trust’s portfolio, were reportedly the world’s best performing country asset class in the wake of 3 April’s tariffs. This was due to Trump’s exemption of the US’s neighbours as they had already received levies in previous weeks. The benchmark Mexbol Index rose 2%, to its highest level in nine months.
Although UK small caps have faced recent challenges, a relative rotation into cyclical names and clearer macro signals from the BoE may be refocusing investor attention back into the sector, raising JPMorgan UK Small Cap Growth and Income’s NAV. This will have been the same for Mercantile’s returns, alongside better than expected earnings from some of the trust’s core holdings in industrials and financials. Aurora UK Alpha’s gains, especially in its share price, may have been supported by anticipation for the outcome of its upcoming continuation vote. In terms of UK property, LondonMetric said it was keen to takeover Urban Logistics. Regional REIT’s pricing uplift is likely on the back of a modest NAV gain and some confidence returning to the UK regional office market.
Premier Miton Global Renewables Trust’s share price could have been helped by talk of a wind up. Downing Renewables and Infrastructure will have benefitted from improving sentiment towards renewables. Moreover, investors may be expecting potential interest rate cuts in the coming weeks. Bluefield Solar Income will have been exposed to similar tailwinds, whereas Harmony Energy Income’s price growth was propelled by a cash offer received from PP Bidco (a new company formed by two funds managed by Foresight LLP). This bid came in higher than the 88p per share offered by Drax in previous weeks. The competing bids highlight the valuation upside in the sector.
International Biotechnology’s superior stock picking skills shone through again as it outperformed peers by a wide margin..
As discussed, European smaller companies experienced a positive month of growth, as European Assets’ NAV will have grown with the stronger than expected economic data in the Eurozone. For Golden Prospect Precious Metals, continued geopolitical uncertainty, fuelled by tariff concerns, underpinned strong gold and silver prices. It is not the first time this year that the price of gold has hit an all-time high, which occurred on 22 April, a positive development for the trust.
Best performing trusts in total NAV (LHS) and share price (RHS) terms over April 2025
| Fund | Sector | (%) | Fund | Sector | (%) |
|---|---|---|---|---|---|
| Geiger Counter | Commodities & Natural Resources | 7.0 | Social Housing REIT | Property – UK Residential | 15.7 |
| Mercantile | UK All Companies | 6.9 | JPMorgan Emerg EMEA Sec | Global Emerging Markets | 12.3 |
| BlackRock Latin American | Latin America | 6.4 | Urban Logistics REIT | Property – UK Logistics | 12.0 |
| Weiss Korea Opportunity | Country Specialist | 6.1 | Regional REIT | Property – UK Commercial | 10.4 |
| JPMorgan UK Small Cap Growth & Income | UK Smaller Companies | 5.7 | Bluefield Solar Income Fund | Renewable Energy Infrastructure | 10.4 |
| Aurora UK Alpha | UK All Companies | 5.2 | Downing Renewables & Infrastructure | Renewable Energy Infrastructure | 9.4 |
| Premier Miton Glb Renewables Trust | Infrastructure Securities | 5.1 | Aurora UK Alpha | UK All Companies | 9.2 |
| International Biotechnology | Biotechnology & Healthcare | 4.9 | Harmony Energy Income Trust | Renewable Energy Infrastructure | 8.8 |
| European Assets | European Smaller Companies | 4.7 | Nippon Active Value | Japanese Smaller Companies | 8.7 |
| Golden Prospect Precious Metal | Commodities & Natural Resources | 4.5 | Premier Miton Glb Renewables Trust | Infrastructure Securities | 7.6 |
There was no news of significance from Social Housing REIT, but it had looked oversold. The aforementioned rallies for Japanese smaller companies were instrumental for Nippon Active Value Fund but also news of its annual results, which indicated strong NAV growth over the year ended December 31, 2023, notably outperforming the trust’s MSCI Japan Small Cap index benchmark.
Worst performing investment companies
The already discussed headwinds affecting Vietnamese markets will have been the reason for the significant NAV and share price drops of Vietnam Holding and Vietnam Enterprise. As mentioned, the imposition of 46% US tariffs on Vietnamese goods hit market sentiment hard, wiping out billions in market cap, with many of the companies affected appearing in the three trust’s portfolios.
The Chinese equity downturns were led by large cap tech such as Alibaba and Tencent, both major positions in the portfolios of Fidelity China Special Situations, Baillie Gifford China Growth Trust and JPMorgan China Growth and Income. Alibaba’s share price fell by nearly 10% on 7 April, with the e-ecommerce giant being subject to potential renewed regulatory crackdown. Fidelity China Special Situations’ overweight to smaller, higher-growth companies might have been a negative influence due to more severe corrections that state backed companies were less exposed to.
Worst performing trusts in total NAV (LHS) and share price (RHS) terms over April 2025
| Fund | Sector | (%) | Fund | Sector | (%) |
|---|---|---|---|---|---|
| VietNam Holding | Country Specialist | (13.1) | Livermore Investments | Flexible Investment | (14.4) |
| Vietnam Enterprise | Country Specialist | (12.1) | VietNam Holding | Country Specialist | (14.0) |
| Fidelity China Special | China / Greater China | (11.1) | Schroder British Opportunities | Growth Capital | (12.9) |
| VinaCapital Vietnam Opp Fund | Country Specialist | (9.4) | Symphony International Holding | Private Equity | (11.6) |
| Manchester & London | Global | (8.6) | Fidelity China Special | China / Greater China | (11.3) |
| Baillie Gifford China Growth Trust | China / Greater China | (8.4) | JPMorgan China Growth & Income | China / Greater China | (10.9) |
| JPMorgan China Growth & Income | China / Greater China | (8.0) | HydrogenOne Capital Growth | Renewable Energy Infrastructure | (10.9) |
| JPMorgan US Smaller Companies | North American Smaller Companies | (8.0) | Vietnam Enterprise | Country Specialist | (10.4) |
| NB Distressed Debt Inv Extended Life | Debt – Loans & Bonds | (7.8) | Chelverton UK Dividend Trust | UK Equity Income | (10.3) |
| BlackRock Energy and Resources Inc | Commodities & Natural Resources | (6.5) | Baillie Gifford China Growth Trust | China / Greater China | (10.1) |
Manchester and London’s underperformance likely stems from its high conviction positions in US large cap technology stocks, namely the ‘Magnificent 7’. Nvidia and Alphabet both sold off during April, a trend that has continued since the beginning of the year as Trump’s derailing of the US economy has gathered pace, shifting investor attention away from the country. JPMorgan US Smaller Companies may have been affected by stronger US employment data and sticky inflation, which might have delayed market expectations for rate cuts by the Federal Reserve.
An announcement from Chelverton UK Dividend Trust that its proposed placing of new zero dividend preference shares (ZDPs) in 2031 ZPDCo will not go ahead due to a lack of demand, will have been detrimental to its share price. This comes on top of the cancellation of a recently proposed scheme of reconstruction.
Whilst the renewables sector saw a price rally, HydrogenOne lagged behind, most likely due to its focus on early-stage technologies and companies not yet generating material cash flow. The trust’s largest holding, Sunfire GmbH (an industrial electrolyser company), was rumoured to be facing funding delays.
Schroder British Opportunities was hit by the woes of widening discounts and investor disillusionment with growth capital trusts more broadly. This could have been exacerbated by a lack of exits and persistent illiquidity. For NB Distressed Debt, recent mixed performance during the planning for its wind down may have dampened investor interest.
BlackRock Energy and Resources may have been impacted by its exposure to stocks sensitive to the underwhelming Chinese government stimuli and the correction in iron ore prices. The trust holds positions in diversified mining companies such as Rio Tinto and Glencore, which were adversely affected by weakening demand signals from Asia and declining base metal prices.
Moves in discounts and premiums
More expensive (LHS) and cheaper (RHS) relative to NAV over April 2025
| Fund | Sector | Disc/ Prem 31/03/25 (%) |
Disc/ Prem 30/04/25 (%) |
Fund | Sector | Disc/ Prem 31/03/25 (%) |
Disc/ Prem 30/04/25 (%) |
|---|---|---|---|---|---|---|---|
| JPMorgan Emerg EMEA Sec | Global Emerging Markets | 327.2 | 390.8 | Livermore Investments | Flexible Investment | 6.6 | (9.1) |
| Urban Logistics REIT | Property – UK Logistics | (18.3) | (8.9) | Weiss Korea Opportunity | Country Specialist | (0.8) | (13.1) |
| Majedie Investments | Flexible Investment | (7.6) | 1.5 | Chelverton UK Dividend Trust | UK Equity Income | 5.9 | (4.3) |
| Manchester & London | Global | (25.2) | (16.7) | Literacy Capital | Private Equity | (15.3) | (23.8) |
| Harmony Energy Income Trust | Renewable Energy Infrastructure | (4.5) | 3.9 | Schroder British Opportunities | Growth Capital | (37.0) | (45.1) |
Investors seem to be warming to Majedie’s new investment approach. Livermore regularly features in this table. Weiss Korea is supposed to be winding down so its discount widening seems odd. Literacy Capital has de-rated since it cut its charitable donations and upped its management fee.
For JPMorgan Emerging EMEA, its premium jump might be reflective of hopes of an end to the war with Ukraine and a normalisation of relations with Russia – but we are probably some way off that.
Money raised and returned
Money raised (LHS) and returned (RHS) over April 2025 in £m
| Fund | Sector | £m raised | Fund | Sector | £m returned |
|---|---|---|---|---|---|
| Globalworth Real Estate Investments | Property – Europe | 24.7 | Scottish Mortgage | Global | (157.4) |
| M&G Credit Income Investment | Debt – Loans & Bonds | 7.4 | Smithson Investment Trust | Global Smaller Companies | (34.8) |
| Law Debenture Corporation | UK Equity Income | 6.3 | JPMorgan European Discovery | European Smaller Companies | (31.2) |
| Henderson Far East Income | Asia Pacific Equity Income | 4.6 | BlackRock American Income Trust | North America | (21.6) |
| CQS New City High Yield | Debt – Loans & Bonds | 3.6 | Monks | Global | (20.5) |
Globalworth Real Estate was the standout for capital raised, reflecting the issue of shares in relation to a scrip dividend. There is a clear bias for income producing investments in the rest of the money raising table.
Meanwhile, Scottish Mortgage continued its programme of buybacks amid persistent discount pressure. Smithson, JPMorgan European Discovery, and Monks also returned capital, signalling outflows from growth-heavy global and European strategies.
Major news stories and QuotedData views over April 2025
Portfolio developments
- HydrogenOne reports portfolio revenue growth but NAV and share price retrench
- ICG Enterprise – Minimax sale brings in €53m
- AVI launches public campaign on Rohto Pharmaceutical
- Further outperformance from AVI Japan Opportunity as corporate reform momentum grows
- Chrysalis announces InfoSum sale at premium to NAV
- Great year for Pantheon Infrastructure followed by first exit
- North American Income delivers strong performance alongside shift to Janus Henderson
- Fair Oaks Income delivers double-digit returns amid improving credit backdrop
- Aquila European Renewables reports on tough year as wind down begins
- Gore Street to pocket £18–19m from US tax credit sale
- Baillie Gifford China beats China’s bounce
- Franklin Global relaunches with expanded resources but lags in challenging year
Corporate news
- BBGI offer resumes following regulatory clearance but take up very low
- Fidelity Japan bows to the inevitable and launches strategic review
- Pacific Horizon introduces conditional tender linked to five-year performance
- Crystal Amber should prosper from De la Rue bid
- European Smaller to shrink dramatically as it strikes deal with Saba
- Polar Capital Global Financials outlines plans post-2025 tender
- Please support the AIC’s My share, my vote campaign
- AVI Japan Opportunity wants to merge with Fidelity Japan, largest shareholder onside
- Impax Environmental Markets pleads case for continuation after difficult year
- BlackRock Frontiers and BlackRock Latin America announce manager changes amid GEM team reshuffle
- Literacy Capital backs Langford’s as first deal for Red Sky Food Group
- RM Infrastructure Income makes solid progress on portfolio wind-down
Property news
QuotedData views
Visit quoteddata.com for more on these and other stories plus in(depth analysis on some funds, the tools to compare similar funds and basic information, key documents and regulatory news announcements on every investment company quoted in London.

Interviews
Have you been listening to our weekly news roundup shows? Every Friday at 11 am, we run through the more interesting bits of the week’s news, and we usually have a special guest or two answering questions about a particular investment company
| Friday | The news show | Special Guest | Topic |
|---|---|---|---|
| 1 January | BPCR, RNEW | Job Curtis | City of London |
| 8 December | JARA, WKOF, ROOF, HGEN, FGEN, SUPR | Ian ‘Franco’ Francis | CQS New City High Yield |
| 15 December | BGCG, CHRY, AJOT | Sebastian Lyon | Personal Assets Trust |
| 22 December | BGLF, EWI, MINI | Alex Crooke | Bankers Investment Trust |
| 29 December | HEIT, GRID, CLDN | Weekly News Show Special | Investing for income |
| 6 December | KPC, GPM, HOME | David Smith | Henderson High Income |
| 13 December | RNEW, AGT, TMI | Craig Baker | Alliance Witan |
| 3 January | Review of 2024 | James Carthew & Andrew McHattie | Review of 2024 |
| 10 January | CYN, MINI, RTW | Alexander Darwall | European Opportunities |
| 17 January | ENRG, FGEN, MTU, BOOK | Gary Robinson | Baillie Gifford US Growth |
| 24 January | SWEF, TMI, CRT, BLND | Joe Bauernfreund | AVI Global Trust |
| 31 January | LBOW, ESCT, THRG, IEM, ORIT | Douglas Brodie | Edinburgh Worldwide |
| 7 February | RNEW, RESI, PSDL, RSE, PEY, CYN | Mark Boggett | Seraphim Space |
| 14 February | BASC, JGC, Saba | Prashant Khemka | Ashoka WhiteOak Emerging Markets Trust |
| 21 February | FSFL, AIC, HRI, AGR. HOME | Samantha FitzPatrick | Murray International |
| 28 February | MHN, BRAI, TRIG | Richard Hulf | HydrogenOne Capital |
| 7 March | Saba, VEIL, WHR, SUPR, SHED | Philip Kent | GCP Infrastructure |
| 14 March | MGCI, AGR, CRT, SHED, LABS | Nicola Takada Wood | AVI Japan Opportunity Trustl |
| 21 March | TMPL, HEIT, SDV | Richard Stone | The AIC |
| 28 March | MTE, INPP, FJV, OCI | In the HotSeat Special | Ideas for your ISA |
| 4 April | FJV, AJOT, ENRG, EAT | Laura Foll & Denis Jackson | Law Debenture |
| 11 April | PCFT | Stephen Rosser | NextEnergy Capital |
| 25 April | BBH, SDV | Richard Shepherd-Cross, Marcus Phayre-Mudge, Bradley Biggins | In The HotSeat Special: When will REITs rebound? |
| 2 May | BBGI, GCL, MCT | Nick Brind | Polar Capital Global Financials Trust |
| 9 May | EOT, CHRY, SDV | Mark Sheppard | Manchester & London Investment Trust |
| Coming up | |||
| 16 May | Alex Wright | Fidelity Special Values | |
| 23 May | Alan Gauld | Patria Private Equity Trust |
Research
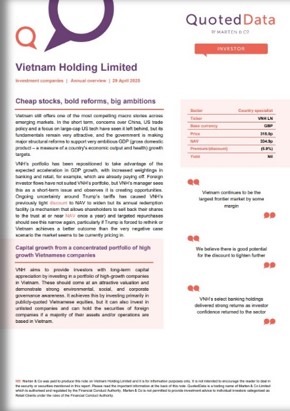
Vietnam still offers one of the most compelling macro stories across emerging markets. In the short term, concerns over China, US trade policy and a focus on large(cap US tech have seen it left behind, but its fundamentals remain very attractive, and the government is making major structural reforms to support very ambitious GDP (gross domestic product – a measure of a country’s economic output and health) growth targets.
VNH’s portfolio has been repositioned to take advantage of the expected acceleration in GDP growth, with increased weightings in banking and retail, for example, which are already paying off. Foreign investor flows have not suited VNH’s portfolio, but VNH’s manager sees this as a short(term issue and observes it is creating opportunities. Ongoing uncertainty around Trump’s tariffs has caused VNH’s previously tight discount to NAV to widen but its annual redemption facility (a mechanism that allows shareholders to sell back their shares to the trust at or near NAV once a year) and targeted repurchases should see this narrow again, particularly if Trump is forced to rethink or Vietnam achieves a better outcome than the very negative case scenario the market seems to be currently pricing in.
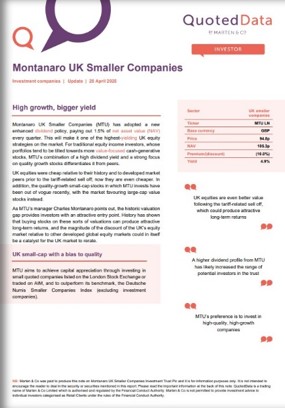
Montanaro UK Smaller Companies (MTU) has adopted a new enhanced dividend policy, paying out 1.5% of net asset value (NAV) every quarter. This will make it one of the highest(yielding UK equity strategies on the market. For traditional equity income investors, whose portfolios tend to be tilted towards more value(focused cash(generative stocks, MTU’s combination of a high dividend yield and a strong focus on quality growth stocks differentiates it from peers.
UK equities were cheap relative to their history and to developed market peers prior to the tariff(related sell off; now they are even cheaper. In addition, the quality(growth small(cap stocks in which MTU invests have been out of vogue recently, with the market favouring large(cap value stocks instead.
As MTU’s manager Charles Montanaro points out, the historic valuation gap provides investors with an attractive entry point. History has shown that buying stocks on these sorts of valuations can produce attractive long(term returns, and the magnitude of the discount of the UK’s equity market relative to other developed global equity markets could in itself be a catalyst for the UK market to rerate.
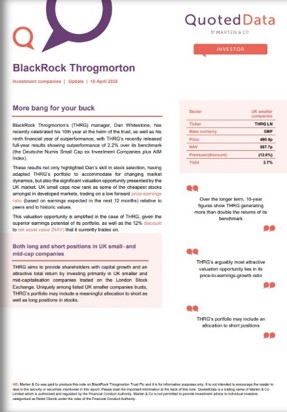
BlackRock Throgmorton’s (THRG) manager, Dan Whitestone, has recently celebrated his 10th year at the helm of the trust, as well as his ninth financial year of outperformance, with THRG’s recently released full(year results showing outperformance of 2.2% over its benchmark (the Deutsche Numis Small Cap ex Investment Companies plus AIM Index).
These results not only highlight Dan’s skill in stock selection, having adapted THRG’s portfolio to accommodate for changing market dynamics, but also the significant valuation opportunity presented by the UK market. UK small caps now rank as some of the cheapest stocks in developed markets, trading on a low forward price(earnings ratio (based on earnings expected in the next 12 months) relative to peers and to historic values.
This valuation opportunity is amplified in the case of THRG, given the superior earnings potential of its portfolio, as well as the 12% discount to net asset value (NAV) that it currently trades on.
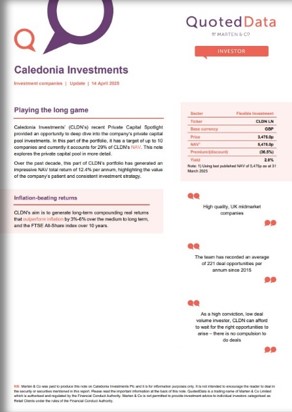
Caledonia Investments’ (CLDN’s) recent Private Capital Spotlight provided an opportunity to deep dive into the company’s private capital pool investments. In this part of the portfolio, it has a target of up to 10 companies and currently it accounts for 29% of CLDN’s NAV. This note explores the private capital pool in more detail.
Over the past decade, this part of CLDN’s portfolio has generated an impressive NAV total return of 12.4% per annum, highlighting the value of the company’s patient and consistent investment strategy.
Upcoming events
Here is a selection of what is coming up. Please refer to the Events section of our website for updates between now and when they are scheduled:
- Henderson International Income EGM 2025
- LMS Capital AGM 2025
- Bellevue Healthcare Trust EGM 2025
- Global Opportunities Trust AGM 2025
- Literacy Capital AGM 2025
- Montanaro European Smaller Companies EGM 2025
- Renewables Infrastructure Group AGM 2025
- JPMorgan European Discovery EGM 2025
- AVI Japan Opportunity Trust AGM 2025
- Caledonia Investments shareholder presentation 2025
- Merchants Trust AGM 2025
- Caledonia Investments shareholder presentation 2025
- Fidelity Japan Trust AGM 2025
- Miton UK Microcap Trust EGM 2025
- VH Global Energy Infrastructure AGM 2025
- Care REIT AGM 2025
- Petershill Partners AGM 2025
- Dunedin Income Growth AGM 2025
- Aquila Energy Efficiency Trust AGM 2025
- CT Private Equity Trust AGM 2025
- Bellevue Healthcare Trust EGM 2025
- LMS Capital EGM 2025
- HgCapital Trust AGM 2025
- Greencoat Renewables AGM 2025
- Mobius Investment Trust AGM 2025
- Regional REIT AGM 2025
- Smithson Investment Trust EGM 2025
- Social Housing REIT AGM 2025
- Baillie Gifford Shin Nippon AGM 2025
- Impax Environmental Markets AGM 2025
- Baillie Gifford Shin Nippon AGM 2025
- BlackRock World Mining AGM 2025
- HICL Infrastructure shareholder presentation
- Schroders Capital Global Innovation Trust AGM 2025
- abrdn UK Smaller Companies Growth EGM
- Mercantile Investment Trust AGM 2025
- Riverstone Credit Opportunities Income AGM 2025
- Ecofin US Renewables Infrastructure AGM 2025
- Henderson International Income EGM 2025
Guide

Our independent guide to quoted investment companies is an invaluable tool for anyone who wants to brush up on their knowledge of the investment companies’ sector. Please register on www.quoteddata.com if you would like it emailed to you directly.
Appendix 1 – median performance by sector, ranked by 2025 year to date price total return
| YTD Rank |
Sector | Share price total return YTD (%) | NAV total return YTD (%) |
Discount 30/04/25 (%) |
Discount 31/03/25 (%) |
Change in discount (%) |
Median mkt cap 30/04/25 (£m) |
|---|---|---|---|---|---|---|---|
| 1 | Property – UK Logistics | 39.5 | 0.6 | (15.5) | (18.3) | 2.8 | 677.1 |
| 2 | Property – UK Healthcare | 27.1 | 1.4 | (15.1) | (17.1) | 2.0 | 527.7 |
| 3 | Latin America | 15.7 | 18.8 | (13.0) | (11.1) | (1.9) | 92.1 |
| 4 | Europe | 10.0 | 4.0 | (6.4) | (7.3) | 0.9 | 532.3 |
| 5 | European Smaller Companies | 9.7 | 8.7 | (8.3) | (7.8) | (0.5) | 415.2 |
| 6 | Infrastructure Securities | 7.3 | 9.2 | (13.8) | (14.4) | 0.6 | 113.5 |
| 7 | UK Equity & Bond Income | 7.1 | 7.8 | (6.9) | (7.8) | 1.0 | 292.3 |
| 8 | Japanese Smaller Companies | 6.7 | 6.1 | (2.9) | (6.5) | 3.6 | 301.0 |
| 9 | Property – UK Residential | 5.7 | 1.1 | (35.4) | (40.7) | 5.4 | 194.3 |
| 10 | China / Greater China | 5.4 | (0.3) | (11.0) | (9.1) | (1.9) | 185.5 |
| 11 | Leasing | 5.2 | (1.1) | (30.2) | (28.7) | (1.5) | 139.9 |
| 12 | Property – UK Commercial | 4.8 | 1.9 | (16.9) | (20.0) | 3.1 | 157.1 |
| 13 | UK Equity Income | 3.8 | 2.1 | (5.1) | (5.4) | 0.2 | 374.7 |
| 14 | Property – Europe | 3.7 | 3.6 | (31.3) | (33.2) | 1.9 | 196.8 |
| 15 | Renewable Energy Infrastructure | 2.9 | 1.5 | (33.7) | (34.0) | 0.3 | 376.1 |
| 16 | Global Equity Income | 2.9 | (2.5) | (1.8) | (2.4) | 0.7 | 336.1 |
| 17 | Debt – Structured Finance | 2.3 | 0.8 | (12.0) | (8.8) | (3.3) | 155.5 |
| 18 | Property – Debt | 1.3 | 1.0 | (15.9) | (15.0) | (0.9) | 27.5 |
| 19 | UK All Companies | 0.8 | 0.6 | (8.9) | (9.1) | 0.1 | 285.2 |
| 20 | Flexible Investment | 0.7 | (0.7) | (20.3) | (12.9) | (7.4) | 107.9 |
| 21 | Debt – Loans & Bonds | 0.7 | 1.2 | 0.7 | 1.4 | (0.7) | 161.5 |
| 22 | Japan | (0.1) | (1.5 | (10.2) | (11.7) | 1.5 | 279.6 |
| 23 | Infrastructure | (0.2) | 0.0 | (22.4) | (23.7) | 1.3 | 1,013,.6 |
| 24 | Global Emerging Markets | (1.3) | (2.0) | (11.3) | (11.9) | 0.6 | 283.4 |
| 25 | Debt – Direct Lending | (3.2) | 0.0 | (14.4) | (16.5) | 2.0 | 76.2 |
| 26 | Asia Pacific Smaller Companies | (3.2) | (6.9) | (10.4) | (13.1) | 2.7 | 332.7 |
| 27 | Asia Pacific Equity Income | (3.7) | (4.2) | (9.0) | (9.2) | 0.2 | 361.2 |
| 28 | Property – Rest of World | (4.2) | (3.1) | (69.3) | (67.9) | (1.3) | 15.1 |
| 29 | Hedge Funds | (5.1) | (6.2) | (11.6) | (16.7) | 5.1 | 82.2 |
| 30 | North America | (6.1) | (5.8) | (8.5) | (9.6) | 1.2 | 499.4 |
| 31 | Private Equity | (6.6) | 0.8 | (39.5) | (36.9) | (2.6) | 562.6 |
| 32 | Commodities & Natural Resources | (6.8) | (0.2) | (10.2) | (9.6) | (0.7) | 55.3 |
| 33 | Asia Pacific | (7.1) | (7.7) | (10.5) | (11.8) | 1.3 | 447.1 |
| 34 | Asia Pacific | (7.7) | (6.2) | (11.8) | (11.2) | (0.6) | 100.9 |
| 35 | Global | (8.0) | (7.0) | (9.3) | (9.2) | (0.2) | 969.1 |
| 36 | Country Specialist | (8.3) | (9.7) | (8.7) | (11.7) | 3.0 | 405.5 |
| 37 | Global Smaller Companies | (8.8) | (8.5) | (10.3) | (11.4) | 1.1 | 664.9 |
| 38 | Financials & Financial Innovation | (9.7) | (8.3) | (10.9) | (11.1) | 0.2 | 745.6 |
| 39 | UK Smaller Companies | (11.0) | 0.8 | (27.4) | (26.3) | (1.1) | 362.1 |
| 40 | Environmental | (12.6) | (1.0) | (43.0) | (37.2) | (5.8) | 122.8 |
| 41 | India/Indian Subcontinent | (13.0) | (9.9) | (10.6) | (7.6) | (3.0) | 294.2 |
| 42 | Biotechnology & Healthcare | (15.0) | (15.8) | (16.8) | (14.1) | (2.7) | 314.4 |
| 43 | North American Smaller Companies | (16.2) | (15.0) | (10.6) | (11.4) | 0.8 | 2,353.9 |
| 44 | Insurance & Reinsurance Strategies | (16.4) | (6.2) | (26.0) | (26.0) | 0.0 | 55.3 |
| 45 | Technology & Technology Innovation | (19.8) | (16.6) | (9.8) | (9.0) | (0.8) | 176.7 |
MEDIAN |
(1.6) | (0.0) | (12.0) | (12.1) | (0.2) | 283.4 |
IMPORTANT INFORMATION
This note was prepared by Marten & Co (which is authorised and regulated by the Financial Conduct Authority).
This note is for information purposes only and is not intended to encourage the reader to deal in the security or securities mentioned within it. Marten & Co is not authorised to give advice to retail clients. The note does not have regard to the specific investment objectives, financial situation and needs of any specific person who may receive it.
Marten & Co may have or may be seeking a contractual relationship with any of the securities mentioned within the note for activities including the provision of sponsored research, investor access or fundraising services.
This note has been compiled from publicly available information. This note is not directed at any person in any jurisdiction where (by reason of that person’s nationality, residence or otherwise) the publication or availability of this note is prohibited.
Accuracy of Content: Whilst Marten & Co uses reasonable efforts to obtain information from sources which we believe to be reliable and to ensure that the information in this note is up to date and accurate, we make no representation or warranty that the information contained in this note is accurate, reliable or complete. The information contained in this note is provided by Marten & Co for personal use and information purposes generally. You are solely liable for any use you may make of this information. The information is inherently subject to change without notice and may become outdated. You, therefore, should verify any information obtained from this note before you use it.
No Advice: Nothing contained in this note constitutes or should be construed to constitute investment, legal, tax or other advice.
No Representation or Warranty: No representation, warranty or guarantee of any kind, express or implied is given by Marten & Co in respect of any information contained in this note.
Exclusion of Liability: To the fullest extent allowed by law, Marten & Co shall not be liable for any direct or indirect losses, damages, costs or expenses incurred or suffered by you arising out or in connection with the access to, use of or reliance on any information contained in this note. In no circumstance shall Marten & Co and its employees have any liability for consequential or special damages.
Governing Law and Jurisdiction: These terms and conditions and all matters connected with them, are governed by the laws of England and Wales and shall be subject to the exclusive jurisdiction of the English courts. If you access this note from outside the UK, you are responsible for ensuring compliance with any local laws relating to access.
No information contained in this note shall form the basis of, or be relied upon in connection with, any offer or commitment whatsoever in any jurisdiction.
Investment Performance Information: Please remember that past performance is not necessarily a guide to the future and that the value of shares and the income from them can go down as well as up. Exchange rates may also cause the value of underlying overseas investments to go down as well as up. Marten & Co may write on companies that use gearing in a number of forms that can increase volatility and, in some cases, to a complete loss of an investment.