Significant progress on “Reset for growth”
In November 2024, Edinburgh Worldwide (EWI) set out its “Reset for growth” plan, which included team changes, process changes, a more-focused portfolio, and a commitment to return up to £130m to shareholders in 2025 (see pages 4 and 5 for more details). Shareholders approved changes needed to implement the plan in December, and since this time the trust has made significant progress.
A new enhanced portfolio construction framework has been put in place, which has seen the portfolio tilted more towards cash-generative businesses (at least 50% of listed assets are supposed to be FCF positive), performance has improved recently, and EWI’s discount has narrowed. Nonetheless, EWI’s small-cap growth exposure remains significantly out of favour. The manager remains enthused about the prospects for the businesses in its portfolio. We believe that a change in sentiment towards small caps is overdue and markets will eventually reward the success of these companies.
Capital growth from entrepreneurial companies
EWI aims to achieve capital growth from a global portfolio of initially immature entrepreneurial companies, which offer long term growth potential, normally over at least a five-year horizon, with a market capitalisation no greater than that of the largest constituent of the S&P Global Small Cap Index.
| Year ended | Share price total return (%) | NAV total return (%) | S&P Global Small Cap total return (%) | MSCI AC World total return (%) |
|---|---|---|---|---|
| 31/07/2021 | 23.6 | 25.4 | 35.5 | 25.7 |
| 31/07/2022 | (40.9) | (35.3) | (3.0) | 2.3 |
| 31/07/2023 | (20.9) | (9.1) | 3.3 | 6.8 |
| 31/07/2024 | 6.4 | (10.7) | 9.9 | 17.2 |
| 31/07/2025 | 17.7 | 18.4 | 5.4 | 12.5 |
Fund profile
Long-term growth potential
EWI is an investment trust which invests globally in a portfolio of listed and private companies. It aims to profit from a global portfolio of initially immature entrepreneurial companies, which offer long term growth potential – normally over at least a five-year horizon – and which typically have a market capitalisation no greater than the market capitalisation of the largest constituent of the company’s comparative index (the S&P Global Small Cap Index) at the time of initial investment.
Further information is available at the Baillie Gifford’s website
The board chooses to compare the trust’s performance to the S&P Global Small Cap Index (total return in sterling). However, the composition of the index has no bearing on the manager’s choice of stocks or position sizes. As evidence of this, the active share at the end of June 2025 was 99% (relative to the S&P Global Small Cap Index).
To achieve a spread of risk, the portfolio should have between 60 and 100 holdings and have exposure to at least six countries and at least 15 industries. No more than 5% of the portfolio will be invested in a single security (at the time of acquisition).
The trust was launched in 1998, but did not adopt its current strategy until 31 January 2014. EWI’s AIFM is Baillie Gifford & Co Limited, a wholly-owned subsidiary of Baillie Gifford & Co.
Douglas Brodie, Svetlana Viteva, and Luke Ward co-manage the trust (see page 27 for short biographies). Svetlana and Luke, previously deputy managers on EWI’s portfolio, were appointed as co-managers in November 2024 as part of the ‘reset for growth’ plan. Douglas, Svetlana, and Luke, along with four analysts and one product specialist, make up the Global Discovery team at Baillie Gifford. The team also manages EWI’s open-ended equivalent, the Global Discovery Fund. The wider firm had £224bn of AUM at 31 December 2024 and the Global Discovery Team was managing £1.75bn of that.
Exposure to unlisted securities
The board and the managers believe that for EWI to gain access to the most exciting immature entrepreneurial companies, it must have the flexibility to invest across private and listed companies. The reason being that technological advances have lowered the initial capital requirement needed to establish and scale many companies.
The quantum of funding available to promising private companies is considerable. Entrepreneurs may never need to turn to public markets for growth capital, instead choosing to use an IPO as a means to provide liquidity for backers once the business is large and mature.
Up to 25% of the portfolio may be invested in unlisted securities.
Up to 25% of the portfolio (at the time of investment) may be invested in unlisted securities (shareholders approved the increase from 15% to the current limit at the AGM in February 2022).
The relative valuation movements of the unlisted and listed parts of the portfolio mean that at the end of June 2025, 29.3% of EWI’s portfolio was in unlisted securities. Some of these are discussed from page 15 onwards.
“Reset for growth” plan
On 20 November 2024, EWI’s board unveiled a package of measures specifically aimed at putting trust on a path to renewed growth. This announcement came following a period of disappointing returns, which led to EWI’s board to take a detailed look at its strategy, execution, and performance.
EWI’s vision intact; action plan set to improve execution
EWI’s vision of identifying and managing a carefully selected portfolio of transformative businesses, that has the potential to deliver outsized returns for shareholders, remains intact. However, the board set out an action plan designed to improve the trust’s execution of that vision.
Plan to return £130m
Alongside this, the board also committed to returning up to £130m to shareholders during 2025, which followed a share buyback programme that had reduced EWI’s discount, while being value-accretive for remaining shareholders. The proposals required a change in investment policy and a reduction in the share premium account to create a distributable reserve, which shareholders approved at a general meeting on 18 December 2024.
Portfolio refocused and mandate updated
Greater concentration allows for deeper engagement
Central to the plan was a change to the investment policy reducing the number of holdings from being in the 75–125 range to 60–100. This greater concentration in the portfolio would allow deeper engagement with investee companies.
The upper market cap threshold for new investments was also increased from a fixed US$5bn to the size of the largest constituent in the trust’s benchmark, the S&P Global Small Cap Index (around US$30bn today). The rationale was that this would give the managers access to a larger pool of global small-cap businesses and flexibility to access emerging winners at the upper end of the small-cap spectrum.
Private companies remain an important element of the strategy
EWI’s access to private companies, such as SpaceX and Psi Quantum, remains an important element of the strategy.
Team changes and process improvements
Following a rigorous appraisal of the trust’s returns, EWI’s board concluded that Baillie Gifford has the right skills and expertise to deliver the strategy but recognised that changes were necessary to improve performance. This led to an overhauling of the investment team structure. Long-time lead manager Douglas Brodie is now co-lead alongside Luke Ward and Svetlana Viteva. Broadening the team was aimed at bringing fresh perspectives and developing a more collaborative approach. Alongside this, internal processes around decision-making, challenge, and execution have been tightened, with the aim of enhancing long-term discipline and performance. A new enhanced portfolio construction framework has been put in place to achieve a better balance in terms of financial maturity of EWI’s holdings (see page 9).
Up to £130m capital return during 2025
EWI’S board committed to returning up to £130m to shareholders in 2025, subject to the necessary shareholder and court approvals, which have since been received. The intention was that the capital return would primarily be executed through buybacks while EWI’s shares trade at a wide discount to NAV, which has been the approach so far. Shareholders approved a reduction in the share premium account (c.£500m at the time of approval) to create a distributable reserve. The idea was that this would allow for further capital returns as necessary, including potential dividends and tender offers. As we show in Figure 16 on page 25, 21.8m shares (about £42m worth) have been bought back over 2025, to date.
Managers’ view
The world has been forced rapidly to adjust to rapidly changing geopolitical norms
EWI’s managers comment that, so far this year, it has been an incredibly turbulent period in global equity markets, with real gyrations in expectations as the world has been forced to adjust to rapidly changing geopolitical norms. In the second half of 2024, there was strong positive sentiment towards global small caps that saw them outperform US large caps, reversing a pattern of marked underperformance over the previous two years. As valuations became stretched – particularly in the US as the market looked forward to tax cuts and deregulation designed to stimulate economic activity – EWI’s manager took the opportunity to trim some holdings that had done particularly well (for example, Doximity and Axon Enterprise), rotating into opportunities where it saw better value.
However, much of the turnaround in the latter part of 2024 has unwound so far in 2025, as global equity markets have had to reappraise US policy priorities. The era of globalisation and frictionless trade that defined the past two decades has given way to heightened geopolitical tension and shifting alliances. Strategic self-reliance is now a clear priority – evident in both corporate efforts to secure supply chains and renewed focus at the sovereign level on access to critical technologies and defence capability.
This is clearly a less benign backdrop. However, it brings with it a degree of clarity that investors are beginning to treat as the new normal – despite the many uncertainties that remain. We see two key implications. First, it enables investors to extend their time horizons once more, reversing the trend toward shorter-term thinking that followed the inflation and interest rate shocks. Perhaps more significantly, it helps delineate which areas of structural change – whether technological, sectoral, or company-led – are best placed to benefit from this evolving landscape.
EWI’s managers are leaning into their process
EWI’s managers have stuck to their philosophy, look for the best long term growth opportunities in companies that are disrupting their marketplaces.
EWI’s managers say that, against less certain outlook, they have stuck to their philosophy and process and continue to look for the best long-term growth opportunities in companies that are disrupting their marketplaces. The managers say that they are not trying to model everything in relation to tariffs – they do not see this as practical in any event – but the narrative is shifting continually, and it is impossible to know where these will eventually settle. However, while they are not assessing the impact of tariffs on a line-by-line basis, they have been thinking about where the portfolio’s exposure to them lies, and they believe it is very well insulated.
Insulated by focus on digitally led/IP-based businesses
EWI’s portfolio is its tilt toward businesses that are resilient to trade frictions or shifts in global supply chains.
One notable feature of EWI’s portfolio is its tilt toward digitally led and IP-based businesses, which are inherently more resilient to the sorts of trade frictions that can arise from geopolitical tensions or shifts in global supply chains. Many of these companies do not rely on physical goods crossing borders – making them less vulnerable to the imposition of tariffs – and in the case of IP-led models, costs are often easier to pass on to end users. Examples such as CyberArk, Appian, and Upwork typify this: they are software and platform-based businesses with global reach but minimal physical exposure.
Further insulating the portfolio from global disruption is the geographic composition of revenue. A significant proportion of holdings generate the bulk of their earnings from domestic markets – particularly the US. Axon Enterprise, for instance, derives around 90% of its revenues from the US, while Zillow is entirely US-focused.
EWI has “local for local” businesses within its portfolio
The managers also highlight the presence of “local for local” models within the portfolio – companies that operate within and serve their domestic ecosystems. A case in point is Informant, which secures supplies for the hospitality sector and is very much a Japan-centric business. These kinds of exposures help reduce vulnerability to international trade barriers and currency volatility.
Hardware businesses vulnerable to tariffs
Hardware business are at risk but EWI’s holdings have unique capabilities and long-term structural growth drivers.
EWI does have a small but notable exposure to hardware-focused companies that, by virtue of their physical goods and globally distributed supply chains, are inherently more vulnerable to tariffs and cross-border frictions. EWI’s manager estimates that around 5–10% of the portfolio falls into this category. One example is Aehr Test Systems Inc, a Nasdaq-listed firm specialising in test solutions for semiconductor devices across multiple stages – wafer-level, singulated die, packaged parts, and installed systems. While exposed to global supply chains, Aehr is seen as differentiated by its unique capabilities in the increasingly critical area of semiconductor testing, so should be well positioned to pass on cost increases.
Another example is Ambarella, a fabless semiconductor design company focused on computer vision and low-power video processing. Although it operates in a globally integrated industry, Ambarella has made strong operational progress, particularly in proprietary vision chips. The managers believe its current valuation remains reasonable relative to the company’s growth trajectory and expectations.
Whilst these positions do carry some exposure to geopolitical and supply chain risk, they are held selectively and with a strong emphasis on unique capabilities and long-term structural growth drivers.
Well-positioned for a less stable world
EWI’s managers comment that its portfolio has exposure to the growing global demand for security across multiple fronts – cyber, geopolitical, resource, and industrial. These themes have been gaining momentum over the last couple of years and, more recently, have seen an acceleration in response to shifting geopolitical dynamics and supply chain realignments.
Cybersecurity remains a significant area of opportunity, which is reflected in holdings such as CyberArk, which offers identity-focused cybersecurity solutions. As threats grow more sophisticated and pervasive, demand for robust digital defences continues to increase across both public and private sectors.
EWI is also exposed to the theme of geopolitical security, through holdings such as AeroVironment Inc. Based in Virginia, AeroVironment is a leading developer of unmanned aerial vehicles (UAVs) and is viewed as well placed to benefit from heightened defence spending and the rising strategic importance of drone technology.
Resource and energy resilience is another growing focus. American Superconductor (AMSC) provides superconducting technologies that enhance the efficiency and reliability of power infrastructure – an increasingly important consideration as the US seeks to strengthen its domestic energy networks and reduce reliance on imported components.
Finally, the push toward industrial supply chain localisation is reflected in the trust’s holding in Xometry, a Maryland-based digital marketplace for on-demand manufacturing. Xometry – discussed further on page 13 – connects buyers and sellers of custom industrial parts, specialising in small-batch orders with rapid turnaround.
Collectively, these positions reflect the trust’s exposure to a broader shift towards greater autonomy, resilience, and security in a more uncertain global environment.
Valuation anomalies persist, but sentiment can shift quickly
EWI’s managers continue to highlight the presence of compelling valuation anomalies within the global small-cap universe, which remains markedly out of favour with small caps trading at significant discounts relative to their larger-cap peers. The managers note that global small caps now make up less than 5% of the market – one of the lowest proportions on record – reflecting how unloved the asset class has become.
Whilst the managers do not attempt to time market rotations, they point to the sharp moves seen late last year as evidence of how quickly sentiment can swing when capital returns to the space. They believe that, should there be a broader re-rating of small caps, EWI’s portfolio – which is heavily skewed toward this underappreciated segment – stands to benefit meaningfully.
Philosophy and process
The philosophy that drives the construction of EWI’s portfolio is common to other Baillie Gifford trusts and is based on the managers’ observation of the asymmetry of returns. Only a few stocks have the ability to become global leaders in their fields and sustain that position. The rewards that accrue to them are considerable. By contrast, most companies will struggle to outperform and, as is especially the case with the younger, more immature companies that EWI focuses on, quite a few will fail. It is important that investors in EWI understand this.
Tools and technology have levelled the playing field. Advances such as the internet, cloud computing and online payments are enabling even relatively small businesses to scale fast and address a global market. If the market is global, differences in country and regional macroeconomic and political environments are much less relevant.
Figure 1: EWI the asymmetry of returns (calculated from 1 February 2014 to 31 January 2025)1
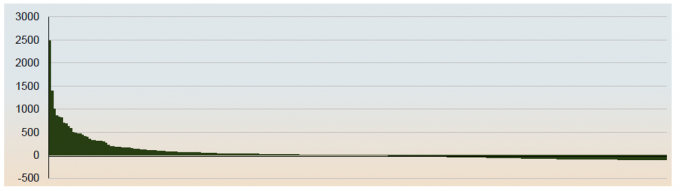
Source: Baillie Gifford & Co, Revolution, Morningstar, S&P. Note: 1) Absolute return of EWIT stocks since Douglas Brodie took over responsibility of EWIT (1 February 2014) to 31 January 2025. Sterling. EWIT and S&P Global Small Cap, total return in sterling.
A true stock-picking portfolio
EWI, therefore, represents a true stock-picking portfolio, constructed without reference to index weights or to reflect the views of an asset allocation committee. The portfolio has a bias to technology, but as the managers point out, technology is everywhere.
The managers are not compelled to sell good companies on market cap grounds
EWI can act as an incubator of companies that grow to become large enough to be included in Baillie Gifford’s larger-cap strategies and identify up and coming disrupters. However, they can retain exposure to these; the managers are not compelled to sell good companies on market cap grounds.
This is not a venture portfolio – the managers tend not to consider companies less than $300m–$400m in size – but these are relatively immature companies on the frontiers of change. The uncertain outlook for these businesses makes it hard for the market to value them properly. This is especially true for those companies that are expected to become significantly profitable some years in the future. The managers believe that most of these stocks are poorly understood and that this creates the space for bottom-up research to add value. The universe is vast – perhaps 30,000 companies – but most of these will not have the characteristic traits that they are looking for and some entire sectors are not a fit.
The sector is full of companies that are small and will stay that way
The managers seek to assess the potential of the business model and the risk that it does not succeed. Companies need to have a scalable business model and a clear competitive advantage. Credibility of management is very important as is an alignment between the interest of management and investors. Only a very small number of stocks fit their criteria. The sector is full of companies that are small and will stay that way.
EWI’s evergreen structure is an advantage
To deliver transformational growth, a business needs to have a culture of innovation which allows it to identify and solve problems for their customers. It often helps if they are starting with a clean sheet of paper rather than simultaneously managing the decline of an incumbent business. EWI is often a provider of growth capital, and in some instances, this could be before a company is revenue generating. For the companies, EWI’s evergreen structure is an advantage. It means that they can think long-term without having to be bound to the normal 10-year cycle of private equity LP funds.
Generally, the managers are not keen on situations where a number of companies are competing in the same niche, unless they can demonstrate differentiated propositions, each with their own edge.
Enhanced portfolio construction
Analysis by EWI’s manager has shown that its holdings’ financial maturity is a key risk factor for the trust. To manage this risk, a new framework has been introduced to help the managers monitor and better balance the trust’s exposure to this risk factor. Companies are assigned to one of the five following categories:
- Fledgling – companies not yet delivering gross profit.
- Initial commercialisation – companies delivering gross profit.
- De-risking – companies with a Free Cash Flow (FCF) margin between -20% and 0%.
- Execution – companies that are FCF positive.
- Proven returns – companies that are FCF positive (or generative) with positive earnings per share (EPS).
The following “portfolio construction guardrails” are now in place:
- a target allocation of 15% across the fledgling and initial commercialisation categories;
- at least 50% of assets across the execution and proven returns categories; and
- a 1.5% limit on deployed capital per position.
EWI’s board and managers take their stewardship role seriously. However, the company will not seek to influence the strategic direction of the companies that it invests in.
EWI may end up holding a significant stake in a business (Baillie Gifford has informal caps on the size of the stakes held across all funds), especially early in a business’s life. However, the managers are mindful of the daily liquidity in listed stocks and factors that into position sizes. A typical new position will start life in the portfolio as a 0.5%–1.5% position. Where the risks associated with the business model are binary, the position size will be smaller.
Flawed investment cases trigger a sale
Sales are triggered once it is clear that the investment case is flawed. M&A activity is also a source of involuntary sales – often companies end up being taken over for less than the managers think they could be worth. In addition, positions will be re-evaluated and may be sold if the managers feel that the upside is limited.
ESG and stewardship principles
Baillie Gifford & Co is a signatory to the United Nations Principles for Responsible Investment and the Carbon Disclosure Project and is also a member of the Asian Corporate Governance Association and International Corporate Governance Network.
EWI’s natural bias towards capital-light businesses contributes towards the portfolio’s lower-than-market-average carbon intensity (97.8% lower than the S&P Global Small Cap Index, based on the 68.4% by value of the company’s portfolio that reports on carbon emissions and other carbon-related characteristics). We have reproduced the company’s stewardship principles below.
Baillie Gifford’s overarching ethos is that we are ‘Actual’ investors. That means we seek to invest for the long term. Our role as an engaged owner is core to our mission to be effective stewards for our clients. As an active manager, we invest in companies at different stages of their evolution across many industries and geographies, and focus on their unique circumstances and opportunities. Our approach favours a small number of simple principles rather than overly prescriptive policies. This helps shape our interactions with holdings and ensures our investment teams have the freedom and retain the responsibility to act in clients’ best interests.
Long-term value creation
We believe that companies that are run for the long term are more likely to be better investments over our clients’ time horizons. We encourage our holdings to be ambitious, focusing on long-term value creation and capital deployment for growth. We know events will not always run according to plan. In these instances we expect management to act deliberately and to provide appropriate transparency. We think helping management to resist short-term demands from shareholders often protects returns. We regard it as our responsibility to encourage holdings away from destructive financial engineering towards activities that create genuine value over the long run. Our value will often be in supporting management when others don’t.
Governance fit for purpose
Corporate governance is a combination of structures and behaviours; a careful balance between systems, processes and people. Good governance is the essential foundation for long-term company success. We firmly believe that there is no single governance model that delivers the best long-term outcomes. We therefore strive to push back against one-dimensional global governance principles in favour of a deep understanding of each company we invest in. We look, very simply, for structures, people and processes which we think can maximise the likelihood of long-term success. We expect to trust the boards and management teams of the companies we select, but demand accountability if that trust is broken.
Alignment in vision and practice
Alignment is at the heart of our stewardship approach. We seek the fair and equitable treatment of all shareholders alongside the interests of management. While assessing alignment with management often comes down to intangible factors and an understanding built over time, we look for clear evidence of alignment in everything from capital allocation decisions in moments of stress to the details of executive remuneration plans and committed share ownership. We expect companies to deepen alignment with us, rather than weaken it, where the opportunity presents itself.
Sustainable business practices
A company’s ability to grow and generate value for our clients relies on a network of interdependencies between the company and the economy, society and environment in which it operates. We expect holdings to consider how their actions impact and rely on these relationships. We believe long-term success depends on maintaining a social licence to operate and look for holdings to work within the spirit and not just the letter of the laws and regulations that govern them. Material factors should be addressed at the board level as appropriate.
Asset allocation
Global small-cap portfolio with high active share (99%) with biases to the US and UK.
As we have discussed previously, EWI’s asset allocation is driven by the managers’ stock selection decisions, and reflecting this, it has a high active share. As is illustrated in Figure 2, the portfolio is global, but has a heavy bias towards North America, which tends to account for about two-thirds of the fund’s assets.
Following the adoption of the “reset for growth” plan at the end of 2024, EWI’s portfolio has been reshaped to include more profitable, cash-generating companies and greater sectoral diversification. While this has resulted in a more focused portfolio, EWI’s managers say that it is better-balanced with stronger sales and earnings growth prospects.
Figure 2: EWI geographic asset allocation as at 30 June 2025
Figure 3: EWI geographic asset allocation as at 30 June 2024
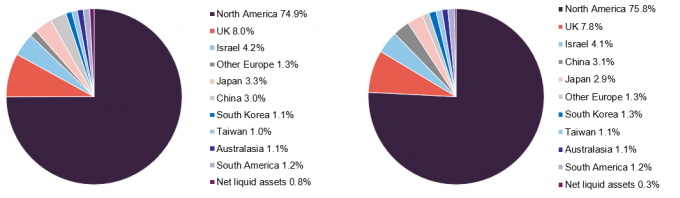
Source: Edinburgh Worldwide
Source: Edinburgh Worldwide
Relative to its comparative index, EWI’s portfolio is overweight both North America and the UK and tends to be underweight other geographical regions. Comparing Figures 2 and 3, it can be seen that all of the changes are less than a 1.0 percentage point difference.
Software and biotechnology account for around 45% of the portfolio.
On an industry basis, the portfolio has a significant exposure to sectors such as software and biotechnology and an underweight exposure to sectors such as financials, materials and consumer goods and services. Aerospace and defence has also been a significant exposure for some time, but this has been on an increasing trend during the last couple of years.
To try and mitigate risk, the portfolio holds between 60 and 100 companies and is required to have exposure to a minimum of six countries and at least 15 industries. As at 30 June 2025, 29.3% of EWI’s total assets were invested in private companies (see further discussion below), up from 27.7% as at 31 May 2024. The managers have been tidying up the tail of the portfolio recently, selling small positions where the investment case has not played out and shifting out of holdings less suited to the current environment. This has seen the number of holdings fall. At the end of April 2025, EWI held 64 listed and 14 unlisted companies, making 78 in total, down from 98 when we last published.
In terms of industry allocation (once again driven by stock selection decisions), the allocation to software has continued to increase (up by around four percentage points since we last published), with aerospace and defence also moving up the last (also up around four percentage points), while biotechnology has continued to edge down (around five percentage points), consistent with the ambition to reduce EWI’s exposure to cash consumptive companies. Otherwise, the allocations are reasonably comparable.
Figure 4: Industry allocation as at 30 June 2025
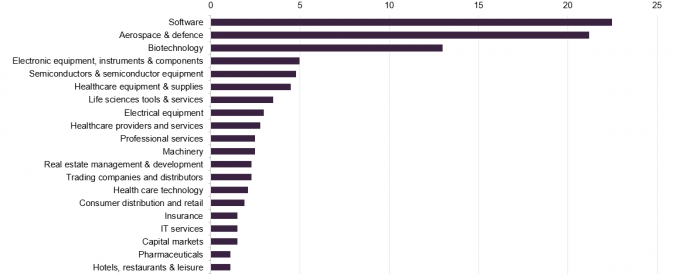
Source: Edinburgh Worldwide
Top 10 holdings
Figure 8 shows EWI’s top 10 holdings as at 30 June 2025, and how these have changed over the previous 12 months. Reflecting its long-term low turnover approach, eight of these were also constituents of its top 10 at the end of December 2023, although some of the relative positions have changed. The three holdings that have moved into the top 10 are Xometry, American Superconductor, and CyberArk, while Staar Surgical, Ocado and Schrödinger have moved out.
We discuss some of the more interesting developments in the next few pages. However, readers interested in more detail on these top 10 holdings, or other names in EWI’s portfolio, should see our previous notes (see page 30 of this note).
Figure 5: Top 10 holdings as at 30 June 2025
| Holding | Sector | Business | Allocation 30 June 2025 (%)1 | Allocation 30 June 2024 (%)1 | Percentage point change |
|---|---|---|---|---|---|
| Space Exploration Technologies2 | Technology | Spacecraft manufacture and satellite comms. | 13.8 | 12.4 | 1.4 |
| PsiQuantum2 | Technology | Developer of commercial quantum computing | 7.4 | 3.2 | 4.2 |
| Alnylam Pharmaceuticals | Healthcare | Drug developer focused on gene silencing technology | 6.1 | 5.8 | 0.3 |
| AeroVironment | Industrials | Small, unmanned aircraft and tactical missile systems | 4.4 | 2.9 | 1.5 |
| Axon Enterprise | Industrials | Law enforcement equipment and software provider | 4.2 | 3.6 | 0.6 |
| Oxford Nanopore Technologies | Biotechnology | Novel DNA sequencing technology | 3.1 | 2.9 | 0.2 |
| American Superconductor | Energy | Designs and manufactures power systems and superconducting wire | 2.3 | 2.4 | (0.1) |
| Xometry | Industrials | On-demand industrial parts marketplace | 2.1 | – | 2.1 |
| Zillow | Communications | US real estate portal | 2.1 | 2.1 | – |
| CyberArk | Technology | Cyber security solutions | 1.7 | 0.9 | 0.8 |
| Total of top 5 | 35.9 | ||||
| Total of top 10 | 47.1 |
Xometry (2.1%) – benefiting from trend towards near sourcing
Figure 6: Xometry share price (US$)
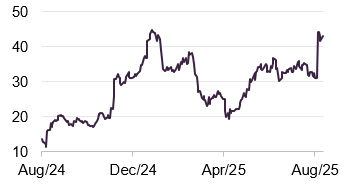
Source: Bloomberg
Xometry (xometry.com) is a US company, based in Maryland, that operates a digital marketplace for on-demand manufacturing. The company connects businesses that need custom-manufactured industrial parts with a distributed network of manufacturers that can produce them. Xometry specialises in small-batch orders, with rapid turnaround, and has been scaling quickly as US manufacturers look to reshore production and build more resilient supply networks.
EWI’s managers say that one of the company’s key innovations is its AI-powered quoting algorithm, which provides instant pricing and lead-time estimates. This system helps streamline procurement and allows customers to make decisions faster.
Although based in the US, Xometry has been expanding internationally, and a key driver of its growth has been the localising supply chains and the growing demand for supply chain resilience – a trend that is being accelerated by recent geopolitical tensions and reshoring efforts in the post-COVID era. Xometry is often seen as a picks-and-shovels play on the digital transformation of manufacturing. Its business model is asset-light, and EWI’s managers believe it has a long growth runway from the structural growth trends of companies looking to shorten lead times, reduce dependency on offshore suppliers, and build more flexible supply networks. They say that these trends have been accelerating during the last two years and that recent trade frictions are likely to reinforce them. As is illustrated in Figure 6, Xometry’s share price jumped on 5 August when it released its second quarter results. Revenue and gross profits both rose by 23% year-on-year, helped by growing numbers of buyers and suppliers using its marketplace, and a higher proportion of international revenue.
The company has raised its guidance for Q3 2025, targeting full-year revenue growth of at least 20%, driven primarily by marketplace growth.
American Superconductor (2.3%) – exposed to grid modernisation, defence electrification, and secure infrastructure
Figure 7: American Superconductor share price (US$)
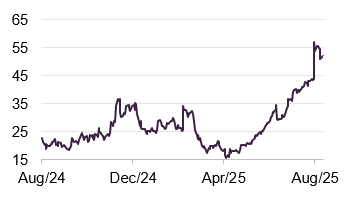
Source: Bloomberg
American Superconductor (amsc.com) is an American energy technologies company that develops advanced power systems for electricity grids, renewable energy providers and defence sectors. Its core products include high-temperature superconducting (HTS) materials, grid interconnection equipment, and shipboard power systems. These technologies help modernise ageing infrastructure, support clean energy integration, and enable electrification of naval vessels. EWI’s managers like AMSC because it is exposed to three high-priority durable themes: grid modernisation, defence electrification, and secure infrastructure.
Electricity grids require substantial upgrades to meet the demands of accelerating electrification and the transition to net zero. EWI’s managers believe AMSC is well placed to benefit, with its superconducting cables and power electronics supporting both the integration of renewables and improved grid resilience. As investment in infrastructure hardening gathers pace, AMSC’s technology is increasingly relevant. Its systems enable microgrids that can operate independently from the main grid – a key capability for military installations and other critical infrastructure. These self-sufficient networks offer protection against cyber threats, extreme weather events, and geopolitical risks.
AMSC reported a particularly strong set of results for the fourth quarter of its financial year ending 31 March 2025, which were underpinned by rising demand in both its grid and wind segments. Revenues rose sharply by 58.6% year-on-year to US$66.7m, comfortably ahead of consensus forecasts, marking the fifth consecutive quarter of accelerating top-line growth. Management highlighted a record backlog, driven in part by continued investment in grid modernisation and defence electrification – themes that EWI’s manager has identified as benefitting from long-term structural tailwinds.
This was followed by another set of strong results for the first quarter of the current financial year, which led to a jump in the company’s share price (see Figure 7). Revenue was up by 80% year-on-year to US$72.4m, well ahead of expectations of around US$65m. Net income came in at US$6.7m (GAAP), a marked turnaround from the US$2.5m loss posted in the same period last year, while non-GAAP EPS of US$0.29 was more than double consensus estimates. Gross margin expanded to 34% (from 30% a year earlier), benefitting from a more favourable product mix and improved factory utilisation. The company guided towards revenue of US$65m–70m for the current quarter, and net income of at least US$2m.
Unlisted positions
At the end of April 2025 (the last available data for the full portfolio), EWI held 14 unlisted investments, which was unchanged in terms of number of unlisted investments held at 31 October 2023 (the most recently available information when we last published). However, Graphcore has exited the portfolio following a sale to Softbank, while C4X Discovery Holdings was a listed investment until April 2024 when it registered as a private company.
As the table shows, 31.1% of total assets was exposed to unlisted investments at the end of April.
Figure 8: EWI’s unlisted holdings as at 30 April 2025
| Stock | Allocation 30 April 2025 (%)1 | Business focus |
|---|---|---|
| Space Exploration Technologies | 14.2 | Designs manufactures and launches advanced rockets and spacecraft |
| PsiQuantum | 8.2 | Developer of commercial quantum computing |
| Astranis Space Technologies | 2.1 | Communication satellite manufacturing and operation |
| SHINE Technologies | 1.62 | Medical radioisotope production |
| Epic Games | 1.2 | Gaming platform |
| BillionToOne | 1.1 | Pre-natal diagnostics |
| Snyk | 1.0 | Security software |
| Echodyne | 0.9 | Metamaterial radar sensors and software |
| Lightning Labs | 0.8 | Lightning software that enables money transmission |
| KSQ Therapeutics | 0.5 | Biotechnology target identification company |
| C4X Discovery | 0.2 | Software to aid drug design |
| DNA Script | 0.1 | Synthetic DNA fabricator |
| Relativity Space | – | 3D printing and aerospace launch company |
| Reaction Engines | – | Advanced heat exchange company |
| Total unlisted holdings | 31.1 |
Space Exploration Technologies
Space Exploration Technologies (www.spacex.com) has been EWI’s largest position for some time and is a position that we have spoken about in previous notes (see page 30 of this note). Echoing their previous updates on the company, EWI’s managers say that SpaceX keeps going from strength to strength, highlighting further significant progress with a third successful test launch of its next-generation Starship rocket (this is a really large rocket, much larger than the Falcon heavy, which is effectively three Falcon 9 rockets strapped together) alongside further growth in the constellation of Starlink satellites (Starlink – www.starlink.com – is a satellite internet constellation that providing coverage to over 70 countries).
The managers also highlight that the Falcon 9 rocket is now the mainstay in global launch with some 140 launches last year alone. SpaceX has continued to improve its launch capability, which has enabled it to accelerate the pace of its Starlink roll out and Starlink is now cashflow-positive too. EWI’s managers say that they are still really excited about these companies – they continue to believe that Starlink will be the first global utility as it rolls out its mobile internet network. The managers add that both SpaceX and Starlink have very exciting growth trajectories, commenting that they are moving into more and more markets and the subscriber base is huge. The managers acknowledge that Starship has a chequered history thus far, but say that, despite all the noise, SpaceX is learning lessons and making progress. This rocket will expand the opportunities for manufacturing in space; as we have discussed previously, removing the barriers of gravity and a wet, heavy atmosphere opens up the possibilities to manufacture new things.
BG says that the valuation has moved a bit to reflect the scale of the potential opportunity. Commentators suggest that the latest sale of insider stock in SpaceX will value the company at $400bn, up from $350bn in December. One concern must be the breakdown in relations between Elon Musk and Donald Trump. It may be that the US government increasingly favours rival firms.
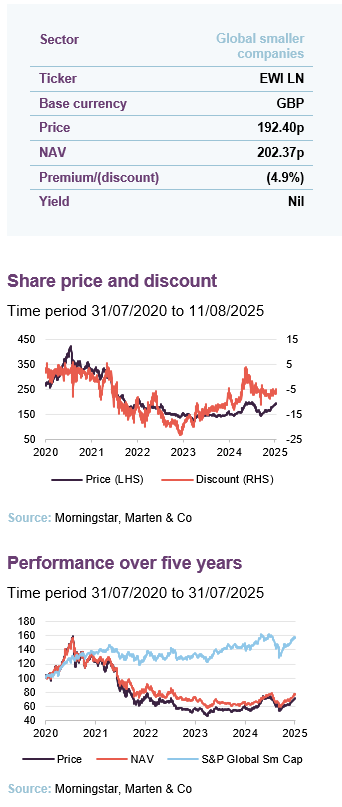
Performance
As we have discussed in our previous notes, EWI benefitted heavily from the rotation into growth following the onset of the pandemic (see Figure 9 below), and the marked trend of outperformance continued until early 2021 when signs of a steepening yield curve started to emerge (associated with higher inflation and an expectation of higher interest rates). This was particularly tough for growth equities that have a larger proportion of the value discounted from the future (see our previous notes for more discussion). These trends of outperformance and underperformance have been very marked, and illustrate the extent to which macro considerations have outweighed the micro.
Figure 9: EWI NAV total return performance relative to comparative index to 31 July 2025
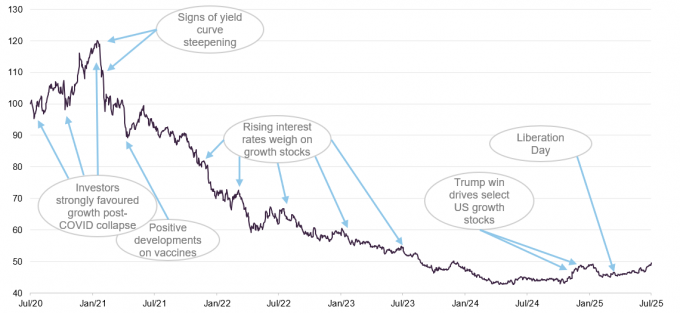
Source: Morningstar, Marten & Co
As we have discussed in previous notes, an environment of higher interest rates was particularly negative for some of the loss-making companies in EWI’s portfolio as investors became concerned about whether they may need to raise finance. In particular, EWI suffered from having a sizeable allocation to unprofitable, cash consumptive healthcare stocks. However, following the implementation of its enhanced portfolio construction framework, which includes the portfolio construction guardrails detailed on page 9, EWI has decreased its allocation to loss-making companies to the benefit of companies that are generating free cash flows, with the allocation to healthcare similarly reducing. This above should reduce the portfolio’s sensitivity to more challenging economic environments, particularly those where interest rates are rising, in the future.
As can be seen in Figure 9 above, the impact of Trump’s “Liberation Day” tariffs has been relatively muted and there still appears to be significant recovery potential should the outlook towards growth stocks continue to improve.
Figure 10: Cumulative total return performance over periods ending 31 July 2025
| 1 month (%) | 3 months(%) | 6 months (%) | 1 year (%) | 3 years(%) | 5 years(%) | 10 years(%) | Strategy launch (%)1 | |
|---|---|---|---|---|---|---|---|---|
| Edinburgh Worldwide NAV | 8.2 | 22.7 | 0.2 | 18.4 | (3.9) | (22.1) | 103.6 | 133.6 |
| Edinburgh Worldwide share price | 10.9 | 24.2 | (3.6) | 17.7 | (0.9) | (27.6) | 96.2 | 138.0 |
| S&P Global Small Cap Index | 5.0 | 13.2 | (1.5) | 5.4 | 19.7 | 57.2 | 135.9 | 171.3 |
| MSCI AC World Index | 5.0 | 13.0 | 1.3 | 12.5 | 40.8 | 81.0 | 207.2 | 263.5 |
| Peer group NAV2 | 3.7 | 15.1 | 3.2 | 7.5 | 13.3 | 31.4 | 140.0 | 179.3 |
| Peer group share price2 | 5.2 | 17.1 | 2.6 | 4.4 | 17.4 | 28.8 | 132.3 | 168.7 |
Interim results for the six months ended 30 April 2025
Over the six months to 30 April 2025, EWI delivered a NAV total return of -2.9%, outperforming the S&P Global Small Cap Index, which fell 7.2% in sterling terms. Although the trust could not avoid the market turbulence triggered by Trump’s “Liberation Day” tariffs and China’s retaliatory measures, EWI’s managers say that its resilience reflects the benefit of early action taken to reset the trust’s strategy, including a more concentrated portfolio and growing exposure to privately held, high-growth businesses. The share price total return was -1.9%, cushioned by buybacks (6.3m shares repurchased).
Private technology holdings shine through
The top contributors during the period came from EWIT’s private holdings and established disruptors in tech-enabled sectors. Specifically, SpaceX and PsiQuantum benefitted from new funding rounds at higher valuations, providing a material uplift to NAV. The managers say that these revaluations reflect not only progress in their respective fields (aerospace and quantum computing), but also investor appetite for game-changing technologies despite wider market caution.
Axon Enterprise, a long-term EWI holding, delivered its 12th straight quarter of revenue growth in excess of 25%. Axon continues to benefit from strong momentum in AI-driven policing tools and expanding customer base.
Notable detractors
AeroVironment shares came under pressure after US policy ambiguity around Ukraine impacted investor sentiment. Despite this, the company boasts a strong order backlog and remains well-positioned in defence tech.
Sweetgreen saw same-store sales weaken as US consumers became more price-sensitive. However, management is focused on automation rollouts to improve operational leverage, which EWI’s managers view as a medium-term catalyst.
Exact Sciences reported steady but below-consensus growth, prompting a sell-off. That said, post-period results have shown a rebound in sales and management remains confident in the next-gen colorectal screening product pipeline.
Private company valuations
78% of EWI’s private portfolio was revalued three or more times during the period and the average uplift in valuation was 28.6%, compared to a 17.2% average movement in share prices of listed holdings. Notably, this contributed to a rise in the private company weighting to 31.1% of the total portfolio. Reflecting this, private company assets rose from £183m to £205m over the period, helped by valuation uplifts and selective new investments. The team continues to see this as a source of long-term alpha, and a point of differentiation from EWI’s peers.
SWOT analysis
| Strengths | Weaknesses |
|---|---|
| EWI only needs a few stocks to excel as the rewards that accrue to those that can become global leaders in their fields, and sustain that position, are considerable.
The real long-term opportunity lies in the companies that EWI’s managers have selected for its portfolio, with the additional discount narrowing opportunities noted below offering a kicker. |
If there is a sustained period where progress in the portfolio is slow, investor interest may wane, leading to discount widening.
With the board focused on maintaining the discount in a relatively tight band, this could lead to disposals at cyclically depressed valuations to finance repurchases. |
| Reset for growth plan and process improvements that have greater emphasis on cash generation appear to be bearing fruit. | The portfolio’s particularly strong growth focus makes EWI’s NAV sensitive to interest rate movements, with rising interest rate and increasing inflation expectations weighing on its NAV. |
| Opportunities | Threats |
| Growth stocks have benefitted from a resurgence recently but are still deeply out of favour and have significant recovery potential from here.
Global small-cap stocks are similarly out of favour, offering potential upside if sentiment towards these improves. |
Potential for discount widening, in response to poor performance and/or poorer sentiment towards global small stocks and/or growth stocks more generally. |
| Shares currently trading at a low-to-mid-single-digit discount to NAV, supported by recent improving performance and a ramp-up in share buybacks. However, EWI has previously traded at a premium rating for a sustained period and could do so again if sentiment improves and/or interest rates reduce, allowing for further upside. In the meantime, share repurchases are NAV accretive for remaining shareholders. | If repurchasing activity increases, this could impact long-term liquidity in EWI’s shares and put upward pressure on its ongoing charges ratio as its fixed costs are spread over a smaller asset base. |
Peer group
Please click here for an up-to-date peer group comparison of EWI versus its global smaller companies peers.
EWI is a constituent of the AIC’s global smaller companies sector, which comprises five members, all of which are illustrated in Figures 12 and 13. All of these were members of the peer group when we last wrote about EWI. Members of the global smaller companies sector will typically have:
- over 80% invested in quoted global smaller company shares;
- less than 80% in any single geographic area;
- an investment objective/policy to invest in medium-to- smaller-cap stocks;
- a majority of investments in medium-to-micro-cap companies; and
- a global smaller companies benchmark.
It should be noted that the peer group as a whole does not provide an ideal comparison for EWI. Herald is arguably its closest comparator, as it, too, has a strong bias to growth and technology and operates with a long-term time horizon. However, Herald is predominantly focused on the TMT space and, whilst EWI is predominantly focused on the US, with a smaller amount in the UK, Herald’s portfolio is the reverse. Herald also invests in much smaller and earlier-stage companies. Reflecting this, it has a much longer tail of investments (about 3x as many as EWI).
As its name suggests, The Global Smaller Companies Trust invests more broadly in global smaller companies. It does not have the specific growth/technology bias of either EWI or Herald and so its sectoral exposure is much broader. GSCT operates with close to 40% in the US and around 25% in the UK. GSCT’s portfolio is the least growth-orientated of its global smaller companies peers.
North Atlantic Smaller Companies targets companies that the manager believes are trading at a discount to their intrinsic value and may then engage with management with the aim of unlocking that value. Consequently, its portfolio is an eclectic mix of investments, which can be hard to categorise. It has a bias to smaller UK companies, but invests in the US periodically. It also makes investments in some unquoted companies, including investments in limited partnership funds advised by the management company, and has stakes in two investment companies: Oryx International Growth and Odyssean Investment Trust.
Smithson operates with a bias towards quality growth stocks (typically companies with high returns on capital, defensible business models, attractive free cash flow yields and low levels of debt funding), which tends to help it in periods where investors are nervous about economic growth.
As a consequence, whilst all of EWI’s peers invest globally in smaller companies, all the portfolios are markedly different to EWI’s.
Figure 12: Peer group cumulative NAV total return performance to 31 July 2025
| 1 month (%) | 3 months(%) | 6 months (%) | 1 year (%) | 3 years(%) | 5 years(%) | 10 years(%) | |
|---|---|---|---|---|---|---|---|
| Edinburgh Worldwide | 8.2 | 22.7 | 0.2 | 18.4 | (3.9) | (22.1) | 103.6 |
| Global Smaller Companies Trust | 3.0 | 11.7 | 0.1 | (0.1) | 15.8 | 54.2 | 113.6 |
| Herald | 3.3 | 18.8 | 3.5 | 5.8 | 21.0 | 41.7 | 202.0 |
| North Atlantic Smaller Companies | 0.1 | 7.4 | 9.1 | 6.1 | 20.3 | 51.9 | 140.6 |
| Smithson | 1.9 | 6.1 | (3.2) | 4.6 | 15.2 | 17.4 | N/A |
| EWI rank | 1/5 | 1/5 | 3/5 | 1/5 | 5/5 | 5/5 | 4/4 |
| Sector arithmetic avg. | 3.7 | 15.1 | 3.2 | 7.5 | 13.3 | 31.4 | 140.0 |
| Sector arithmetic avg. exc. EWI | 2.1 | 11.0 | 2.4 | 4.1 | 18.1 | 41.3 | 152.1 |
Growth sell-off has eaten into EWI’s longer-term performance record.
Looking at Figure 12, it is clear that EWI found itself at the sharper end of the sell-off in growth stocks as inflation and interest rates started to increase from early 2022 (following the invasion of Ukraine, which pushed up inflation particularly through higher energy costs and commodities prices, along with the delayed effects of significant stimulus as the global economy emerged from COVID – subjects discussed in detail in our previous notes, which is highly visible in the three- and five-year numbers, and has eaten into EWI’s 10-year returns (something which has also affected its peers, but to a much lesser extent). However, EWI has benefitted in periods where growth has moved back into favour as inflation expectations have reduced.
Recent inflation numbers have come in ahead of expectations and while Trump has reversed much of his recent “Liberation Day” tariffs, this could still represent a significant inflationary risk, which continues to weigh on the sorts of stocks in which EWI and its peers invest. However, there could be significant reversionary potential, particularly for EWI with its strong growth bias, should a lasting resolution to the trade dispute be found and inflation continues to track downwards.
Looking at Figure 13, it can be seen that, whilst all of the funds are a very respectable size, there are significant differences between them and, to a certain extent, the peer group continues to be distorted by the colossus that is Smithson. The distortion is such that the next-largest fund, Herald, is comparable in size to the peer group average. If Smithson is excluded, the average market cap is £773m and whilst EWI is still around £99m below this, it is reasonably close to the average.
EWI is still the most efficient with the lowest ongoing charges ratio in the peer group.
As we have previously observed, Smithson does not have a similarly distorting effect on the average ongoing charges ratio for the peer group as, despite its colossal size, its ongoing charges ratio is close to the sector average. In this regard, EWI is still the most efficient, with the lowest ongoing charges ratio in the peer group, despite only being the fourth-largest fund. The Global Smaller Companies comes in a reasonably close second, although its ongoing charges ratio is still 8bp higher than EWI’s, despite having total net assets that are c. 14% higher than EWI’s.
It is perhaps unsurprising that Herald has an ongoing charges ratio a bit over the sector average, as its more specialist approach – combined with a very high number of portfolio companies – is likely to be more expensive to manage. It is worth noting that North Atlantic Smaller Companies is the only fund with a performance fee and, whilst it did not incur a performance fee in relation to its last reported financial year (for the year ended 31 January 2025), its ongoing charges ratio inclusive of performance fees could, in a good year, cost up to an additional 50bp in round figures.
The volatility of EWI’s NAV returns remains the highest in the peer group by a significant margin.
Reflecting their focus on smaller companies, which are more likely to be in a growth phase and reinvesting their earnings in their businesses, EWI and its peers are all managed with a focus on capital growth and not income. It is not surprising that three of the peer group, including EWI, have not paid a dividend during the last 12 months.
EWI’s discount is markedly below the sector average, although this is distorted by the very high discount of North Atlantic Smaller Companies (its manager, Christopher Mills, who is also a director, owns around 28% of the trust, making it difficult for an external shareholder to put pressure on the trust to close its abnormally wide discount). If North Atlantic Smaller Companies is excluded, the average discount is 14.2%, which is reasonably close to EWI’s 11.3% discount.
Figure 13: Peer group comparison – size, fees, discount, yield and gearing as at 11 August 2025
| Market cap (£m) | St. dev. of daily NAV over 5 years | Ongoing charges (%)1 | Perf. fee | Premium/ (discount) (%) | Dividend yield (%) |
Gross gearing (%)4 |
Net gearing (%)4 |
|
|---|---|---|---|---|---|---|---|---|
| Edinburgh Worldwide | 674.3 | 23.43 | 0.76 | No | (4.9) | Nil | 10.9 | 8.7 |
| Global Smaller Companies Trust | 729.4 | 12.03 | 0.78 | No | (10.8) | 1.7 | 4.9 | 3.8 |
| Herald | 1,192.3 | 12.69 | 1.08 | No | (7.4) | Nil | Nil | (6.5) |
| North Atlantic Smaller Companies | 495.6 | 10.40 | 1.10/1.102 | Yes2 | (35.0) | 2.3 | Nil | (2.4) |
| Smithson | 1,679.2 | 16.40 | 0.90 | No | (8.2) | 0.0 | Nil | (0.5) |
| EWI rank | 4/5 | 5/5 | 1/5 | 5/5 | 4/5 | 5/5 | 5/5 | |
| Sector arithmetic average | 954.2 | 14.99 | 0.92/0.923 | (13.3) | 0.8 | 3.2 | 0.6 | |
| Sector arithmetic avg. exc EWI | 1,024.1 | 12.88 | 0.97/0.973 | (15.4) | 1.0 | 1.2 | (1.4) |
Dividend
Figure 14: EWI revenue return per share (pence)1
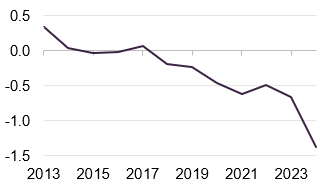
Source: Edinburgh Worldwide Note: 1) For financial years ended 31 October.
EWI’s focus on capital growth tends to mean that there is insufficient net revenue to fund dividends. Reflecting this, the company has not declared a dividend since 2014, the year that the new strategy was adopted.
For the accounting year ended 31 October 2024, EWI’s net revenue per share was -0.70p, down from -0.65p for the prior year. The revenue reserve is negative (a net revenue loss of £11.2m) and this would have to be eliminated before EWI declared a dividend. If circumstances change, board policy is that the trust would pay the minimum permissible dividend to allow it to retain its investment trust status.
Premium/(discount)
As is illustrated in Figure 15, in an environment of higher (albeit falling) inflation and interest rates, where growth continues to be out of favour, EWI found itself trading at discounts that were significantly wider than its long-term averages. However, from the middle of 2023 a broad trend of discount narrowing can be seen, albeit with marked periods of volatility, which coincided with strong signs that inflation – particularly in more developed markets – had been receding. This naturally led to improved sentiment towards growth stocks, which helped to narrow EWI’s discount significantly.
Saba Capital’s aggressive buying narrowed EWI’s discount in advance of its requisition meetings
The chart in Figure 15 highlights a number of recent events that have impacted on the EWI’s discount including Saba Capital’s requisition of seven London-listed investment trusts simultaneously, of which EWI was one. Saba bought shares aggressively in the run-up to announcing its requisitions, pushing a number of these trusts, including EWI, to premiums. This buying occurred at a time where inflation readouts were coming in above expectations and where additional concerns around the inflationary aspects of President Trump’s policies were coming to the fore and might have otherwise been expected to lead to gradual discount widening.
EWI’s discount narrowed following the announcement of its “Reset for growth” plan.
Shortly before Saba announced that it was requisitioning the seven trusts, EWI announced its “reset for growth” plan that we detailed on pages 4 and 5. Figure 15 shows that, following the announcement, EWI’s discount narrowed significantly, although buying by Saba was also likely a factor.
In the first of these votes, Saba’s proposals to take control of Herald Investment Trust were defeated by an incredible margin – on a massive turnout of over 80%, only 0.15% of shareholders other than Saba voted for its proposals. Saba went on to lose the remaining seven votes by similarly convincing margins. The subsequent widening of EWI’s discount likely reflects a slowdown in Saba’s buying activity following the loss of the Herald vote, along with a shift in view that Saba was less likely to win these votes as Saba’s losses continued to mount (Saba lost all seven and EWI’s vote was the last).
‘Liberation day’ caused a sharp widening of EWI’s discount, but the effects were short-lived.
More recently, Trump’s Liberation Day tariffs hit global markets hard initially, which was reflected in a sharp widening of EWI’s discount. However, for now at least, the US seems to have pulled back from the brink and markets have bounced. EWI’s discount is now sitting around its five-year average, and as is discussed further below, the trust has been actively repurchasing shares, particularly in June 2025, which saw some 11.7m shares repurchased. We think that this, along with a recent improvement in performance, is putting an effective brake on discount widening.
The real opportunity lies in the performance of EWI’s portfolio, which is very attractively valued.
Longer-term, we think the real opportunity lies in the prospects for EWI’s portfolio, which the managers feel is very attractively valued. We strongly believe that now is not the time to be liquidating the portfolio (as Saba was suggesting) as this would likely lead to EWI shareholders missing out on significant upside.
Over the last 12 months, EWI has traded between a 4.0% premium and a 13.1% discount, with an average discount of 6.0%. As at 11 August 2025, EWI was trading at a discount of 4.9%, which is noticeably tighter than its longer-term three- and five-year discount averages of 11.9% and 8.2% respectively.
Figure 15: EWI discount over five years
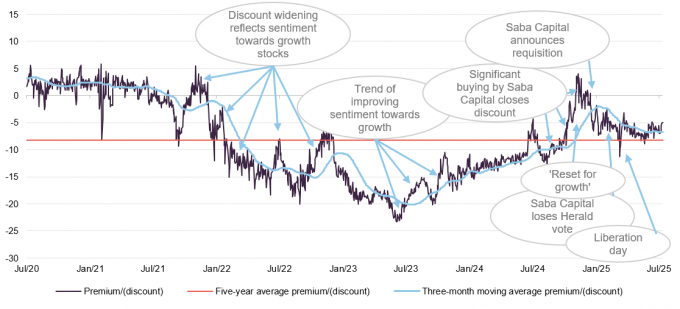
Source: Morningstar, Marten & Co
Board continues to take action on the discount with NAV accretive purchases
Each year, the board asks shareholders for permission to buy back up to 14.99% and issue up to 10% of EWI’s issued capital. Repurchased shares may be held in treasury and reissued when demand returns. Shares will only be issued or reissued at a premium to asset value, thereby enhancing the NAV for existing shareholders.
Figure 15 shows the pattern of net share repurchases since the beginning of 2024. This is a period in which EWI has traded at a discount, and illustrates that the board has provided liquidity, repurchasing shares as sentiment towards growth stocks deteriorated.
Figure 16: EWI net recent share issuance/(repurchases) since January 2024
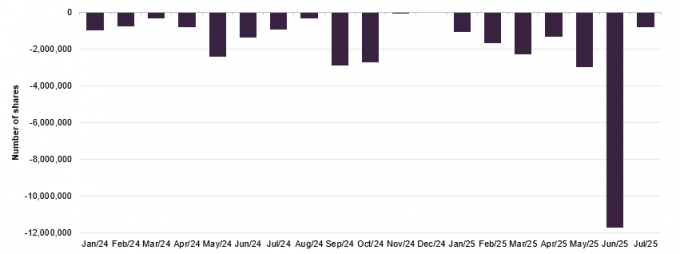
Source: Edinburgh Worldwide, Marten & Co
Fees and costs
Figure 17: EWI ongoing charges ratio (%)1
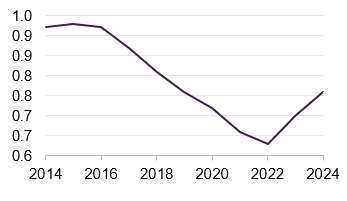
Source: Edinburgh Worldwide Note: 1) For financial years ended 31 October.
The annual management fee is 0.75% on the first £50m of net assets, 0.65% on the next £200m and 0.55% on any remaining net assets. The management fee is calculated and payable quarterly. The management agreement can be terminated on three months’ notice.
The ongoing charges ratio for the accounting year ended 31 October 2024 was 0.76%, up from 0.70% for the prior year and 0.63% for the year ended 31 October 2022. As is illustrated in Figure 17, there has been a marked reduction in EWI’s ongoing charges during the last decade reflecting asset growth, both as a result of strong performance and the share issuance that has taken place in response to the demand that has followed. However, the last two financial years have seen a reversal of this trend, reflecting the reduction in EWI’s net assets over the period, but – assuming EWI sees a return to form that allows for further asset growth – we would expect the ongoing charges ratio to resume its trend of contraction.
Capital structure
Simple capital structure.
EWI has a simple capital structure with one class of ordinary share in issue. EWI’s ordinary shares have a premium main market listing on the LSE and, as at 11 August 2025, there were 405,753,695 of these in issue, with 55,260,502 held in treasury and 350,493,193 in general circulation.
Major shareholders
EWI has a significant retail presence on its share register.
Figure 18 illustrates that EWI has a significant retail presence within its share register, reflected by the prominence of the major platforms, which account for around 40% of the share register. Wealth managers are also a significant element, accounting for around 40%.
When we last published, we commented that we were aware that Saba Capital had been buying through accounts with both JPMorgan Chase and Société Générale, and we think it is likely that most, if not all, of the shareholdings attributed to these two were in fact Saba Capital. Saba subsequently declared its stake at 25.1% as at 29 January 2025, prior to the vote, at which point a significant chunk of its stake was still held through other nominees, but this is no longer the case.
Saba had 24.5% of EWI’s voting rights as at 27 June 2025.
Declarations by Saba show that, as of 20 June 2025, Saba’s stake in EWI represented 26.0% of its voting rights (23.7% directly and 2.4% through financial instruments) but on 27 June this had dropped to 24.5% (24.3% held directly and 0.2% through financial instruments). All other things being equal, Saba’s proportionate ownership in EWI will have risen from the 25.1% it held at 29 January 2025 until its recent sale at the margin as EWI has been active in the market for its own shares.
Figure 18: Major shareholders as at 5 August 2025
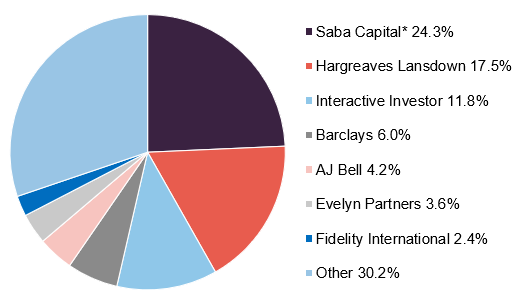
Source: Bloomberg, Marten & Co *Note: this is the proportion Bloomberg data says is held directly by Saba. Saba has declared its stake at 24.5% as at 27 June 2025, some of which is held through other financial instruments.
Gearing and derivatives
EWI tends to use single digit levels of gearing.
The company recognises the advantages of long-term gearing, and the investment policy allows gearing up to 30% of net assets. In practice, however, gearing has tended to be in single digits in recent years. Gearing levels are discussed at each board meeting.
EWI has a £100m five-year multicurrency revolving credit facility which is provided by The Royal Bank of Scotland International Limited and expires on 9 June 2026. EWI also has a £36m multicurrency revolving facility provided by National Australia Bank Limited with expiry on 30 October 2026.
The main covenants relating to both existing loan facilities are that total borrowings shall not exceed 35% of EWI’s adjusted gross assets and the minimum adjusted gross assets shall be £260m.
At the end of October 2024, EWI’s gearing was in the form of drawings in euros, dollars, and sterling. As at 31 July 2025, EWI had gross and net gearing of 10.9% and 8.7% respectively.
Derivatives can be used either as a hedge or to exploit an investment opportunity. In practice, they are not normally used.
Financial calendar
EWI’s year-end is 31 October. The annual results are now usually released in January (interims in June) and its AGMs are now usually held in February/March each year.
EWI does not have a fixed life and does not hold regular continuation votes.
Management team
Douglas Brodie (co-manager)
Douglas joined Baillie Gifford in 2001 and is head of the Global Discovery Team. He became a partner in 2015 and is a CFA Charterholder. Douglas graduated with a BSc in Molecular Biology & Biochemistry from the University of Durham in 1997 and attained a DPhil in Molecular Immunology from the University of Oxford in 2001.
Svetlana Viteva (co-manager)
Svetlana joined Baillie Gifford in 2012 and is an investment manager in the Global Discovery Team. She is a CFA Charterholder. Svetlana graduated with a BA in Economics and a BA in Business Administration from the American University in Bulgaria in 2008, an MSc in Investment Analysis in 2009 and a PhD in Accounting and Finance in 2012, both from the University of Stirling.
Luke Ward (co-manager)
Luke joined Baillie Gifford in 2012 and is an investment manager in the Global Discovery Team. He graduated with an MEng (Hons) in Mechanical Engineering from the University of Edinburgh in 2012.
Board
EWI’s board is composed of six directors, all of whom are non-executive and considered to be independent of the investment manager. It is board policy that all directors will retire and offer themselves for re-election each year. Other than EWI’s board, its directors do not have any other shared directorships.
The board has recently had a mild refresh, with Helen James stepping down at the conclusion of the AGM on 14 February 2025 and Gregory Eckersley joining the next day, maintaining the number of directors at six. As is illustrated in Figure 19 below, the average length of service is 4.2 years and Mungo Wilson is now the longest-serving director, with 8.7 years of service under his belt. We expect that EWI’s board will give consideration to succession planning in the next 18 months as Mungo’s tenure approaches 10 years.
Directors’ fees
Total directors’ fees are capped at £250,000 per year (shareholders approved an increase in the cap from £200,000 at the 2022 AGM) and any further change to the cap will require shareholder approval. Following a 5.7% increase in the average Directors’ fee for the 2024 financial year, no fee increase is anticipated for the 2025 financial year.
Recent share purchase and disposal activity by directors
One director has purchased EWI shares during the last 12 months: Jonathan Simpson-Dent purchased 14,500 shares at 187.7p per share on 20 January 2025. None of the directors has disposed of any shares during the last year.
Figure 19: Board member – length of service and shareholdings
| Director | Position | Date of appointment | Length of service (years) | Annual fee (£)1 | Share-holding2 | Years of fee invested3 |
|---|---|---|---|---|---|---|
| Jonathan Simpson-Dent | Chairman | 1 February 2020 | 5.5 | 44,250 | 106,466 | 4.6 |
| Caroline Roxburgh | Chairman of the audit committee | 1 February 2020 | 5.5 | 36,000 | 28,812 | 1.5 |
| Jane McCracken | Senior independent director | 1 November 2022 | 2.8 | 31,000 | 13,365 | 0.8 |
| Gregory Eckersley | Director | 15 February 2025 | 0.5 | 29,500 | 30,000 | 2.0 |
| Mary Gunn | Director | 1 March 2023 | 2.5 | 29,500 | 5,610 | 0.4 |
| Mungo Wilson | Director | 8 December 2016 | 8.7 | 29,500 | 99,949 | 6.5 |
| Average (service length, annual fee, shareholding, years of fee invested) | 4.2 | 33,292 | 47,367 | 2.6 |
Board well-aligned with external shareholders
All of EWI’s directors have personal investments in the trust, which we consider to be favourable as it helps align directors’ interests with those of shareholders. The average level of fees invested is a respectable 2.6 years.
Jonathan Simpson-Dent (chairman)
Jonathan has spent the majority of his career running entrepreneurial private equity and listed mid-cap international growth businesses across multiple sectors, being a former CEO of Evander Group, Cardpoint and WLT (EMEA), CCO of Cardtronics Inc and CFO of HomeServe Plc and General Healthcare Group. He has also previously worked at PricewaterhouseCoopers LLP, McKinsey & Company and PepsiCo. Jonathan is the chair of three private equity companies: Danx Carousel Group, Andwis Group and Easby Group. He has also previously worked at PricewaterhouseCoopers LLP, McKinsey & Company and PepsiCo. He is a Fellow of the Institute of Chartered Accountants.
Caroline Roxburgh (chairman of the audit committee)
Caroline is a qualified Chartered Accountant and was a partner at PricewaterhouseCoopers LLP until 2016. She is the senior independent director and chair of the audit committee of Montanaro European Smaller Companies Trust Plc, a non-executive director and chair of the audit and risk committee of Edinburgh International Festival Society, a non-executive director of the Royal Conservatoire of Scotland and a non-executive director and chair of the audit and risk committee of VisitScotland. Caroline was appointed as chairman of EWI’s audit and management engagement committee at the AGM on 2 February 2022.
Jane McCracken (senior independent director)
Jane has spent her career working with high-growth technology businesses based in the USA and UK as an entrepreneur, equity investor, board member and advisor. Her experience covers a variety of areas including enterprise software, e-commerce, fintech, digital health and clinical research. Most recently, she served as a research faculty member and entrepreneur-in-residence at the Georgia Institute of Technology in Atlanta, Georgia, USA, and is currently the chief growth officer for Corps Team LLC. Jane is also a non-executive director of Radyus Research LLC.
Gregory Eckersley (director)
Gregory is an experienced equity investor with a professional executive career in a mix of leadership and asset management roles. Having begun his investment career at Cigna International Investment Limited, he gained international experience at Draycott Partners, Alliance Capital and AllianceBernstein, managing and overseeing teams investing in emerging market and global portfolios and was until 2019 the global head of internal equities at the Abu Dhabi Investment Authority. Gregory is also a non-executive director of Murray International Trust Plc.
Dr Mary Gunn (director)
Mary is a scientist, lawyer and C-level executive in life science companies, including previously at Pfizer, Crucell, ICON Plc, and Health Decisions. She also served on the boards and advisories of Brown University, Modelis, Lumiio, and SpotArt Foundation. Mary is currently an Independent Director of Burst Diagnostics and the President of RemRem LLC, a value creation advisory for investors, banks, and entrepreneurs in clinical research and life science.
Mungo Wilson (director)
Mungo is a former solicitor and is associate professor of finance at Saïd Business School, University of Oxford. He is also an associate member of the Oxford Man Institute of Quantitative Finance. He is a non-executive director of Neo Risk Reap Asia Equity Fund Limited, Embedded Insurance Inc., and Carbon Insurance Inc.
Bull vs bear case
Figure 20: Bull vs bear case for EWI
| Aspect | Bull case | Bear case |
|---|---|---|
| Performance | Reset for growth is showing signs of bearing fruit, reflecting increased emphasis on financial maturity and cash generation.
There is room for potential outperformance if the outlook improves as detailed below. |
A deteriorating inflation and interest outlook depresses the valuation of growth stocks, even if they continue to operate well. |
| Outlook | EWI’s focus on digitally-led and IP-based businesses offers some protection from the effects of tariffs – should these come back to the fore – as well as from and the sorts of frictions that can arise from geopolitical tensions or shifts in global supply chains.
There is also a further upside potential from improving valuations, particularly if interest rates continue to recede and the inflation outlook improves. However, the long-term opportunity lies in the high-growth opportunities the managers have selected for the portfolio. |
Hardware businesses are inherently more exposed to tariff concerns and shifting supply chains, but these make up a relatively small proportion of the portfolio.
The recent recovery could be rolled back if the inflation and interest outlook deteriorates. |
| Discount | EWI has committed to returning £130m to shareholders during 2025, primarily through buybacks while the discount is excessive. This should help to keep the discount narrow. | An environment less favourable to growth stocks or a period of poor performance could weigh on EWI’s discount, requiring increased repurchase activity that runs down the £130m allocated for returning to shareholders this year more quickly than originally envisaged. |
Previous publications
Readers interested in further information about EWI may wish to read our previous notes (details are provided in Figure 21 below). You can read the notes by clicking on them in Figure 21 or by visiting our website.
Figure 21: QuotedData’s previously published notes on EWI
IMPORTANT INFORMATION
This marketing communication has been prepared for Edinburgh Worldwide Investment Trust Plc by Marten & Co (which is authorised and regulated by the Financial Conduct Authority) and is non-independent research as defined under Article 36 of the Commission Delegated Regulation (EU) 2017/565 of 25 April 2016 supplementing the Markets in Financial Instruments Directive (MIFID). It is intended for use by investment professionals as defined in article 19 (5) of the Financial Services Act 2000 (Financial Promotion) Order 2005. Marten & Co is not authorised to give advice to retail clients and, if you are not a professional investor, or in any other way are prohibited or restricted from receiving this information, you should disregard it. The note does not have regard to the specific investment objectives, financial situation and needs of any specific person who may receive it.
The note has not been prepared in accordance with legal requirements designed to promote the independence of investment research and as such is considered to be a marketing communication. The analysts who prepared this note are not constrained from dealing ahead of it, but in practice, and in accordance with our internal code of good conduct, will refrain from doing so for the period from which they first obtained the information necessary to prepare the note until one month after the note’s publication. Nevertheless, they may have an interest in any of the securities mentioned within this note.
This note has been compiled from publicly available information. This note is not directed at any person in any jurisdiction where (by reason of that person’s nationality, residence or otherwise) the publication or availability of this note is prohibited.
Accuracy of Content: Whilst Marten & Co uses reasonable efforts to obtain information from sources which we believe to be reliable and to ensure that the information in this note is up to date and accurate, we make no representation or warranty that the information contained in this note is accurate, reliable or complete. The information contained in this note is provided by Marten & Co for personal use and information purposes generally. You are solely liable for any use you may make of this information. The information is inherently subject to change without notice and may become outdated. You, therefore, should verify any information obtained from this note before you use it.
No Advice: Nothing contained in this note constitutes or should be construed to constitute investment, legal, tax or other advice.
No Representation or Warranty: No representation, warranty or guarantee of any kind, express or implied is given by Marten & Co in respect of any information contained on this note.
Exclusion of Liability: To the fullest extent allowed by law, Marten & Co shall not be liable for any direct or indirect losses, damages, costs or expenses incurred or suffered by you arising out or in connection with the access to, use of or reliance on any information contained on this note. In no circumstance shall Marten & Co and its employees have any liability for consequential or special damages.
Governing Law and Jurisdiction: These terms and conditions and all matters connected with them, are governed by the laws of England and Wales and shall be subject to the exclusive jurisdiction of the English courts. If you access this note from outside the UK, you are responsible for ensuring compliance with any local laws relating to access.
No information contained in this note shall form the basis of, or be relied upon in connection with, any offer or commitment whatsoever in any jurisdiction.
Investment Performance Information: Please remember that past performance is not necessarily a guide to the future and that the value of shares and the income from them can go down as well as up. Exchange rates may also cause the value of underlying overseas investments to go down as well as up. Marten & Co may write on companies that use gearing in a number of forms that can increase volatility and, in some cases, to a complete loss of an investment.