
A new home for a proven approach
City Natural Resources Growth and Income’s (CYN’s) management contract transferred to Tufton Investment Management in September 2026. This reestablished management by longstanding portfolio managers Keith Watson and Robert Crayfourd while gaining access to Tufton’s complementary energy and shipping expertise.
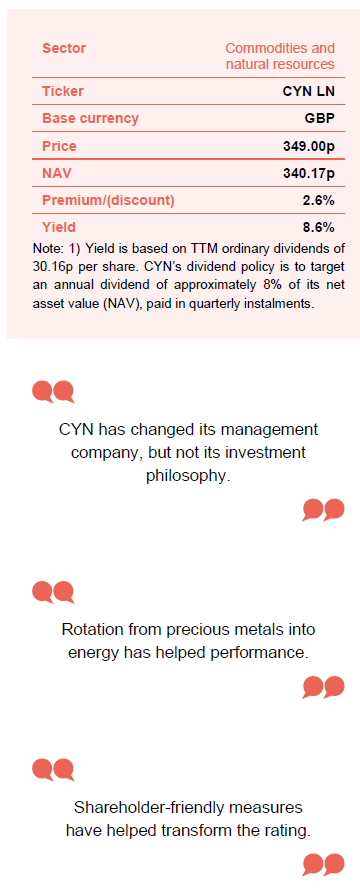
CYN’s NAV rose 28.8% and its share price 37.2%, both including income, over the year to 31 October 2026. The managers benefited from substantial exposure to precious metals miners before successfully shifting towards energy as relative valuations became more attractive.
Shareholder-friendly measures introduced in 2025 have attracted investors who understand CYN’s proposition and helped narrow its discount to NAV. The shares have recently traded close to NAV, occasionally at a premium, allowing CYN to issue equity. CYN continues to offer a distinctive combination of specialist natural resources exposure, capital growth potential and substantial income.
Capital growth and income from mining & resources
CYN aims to provide investors with capital growth and income by investing in a portfolio that predominantly comprises mining and resource equities, as well as mining, resource and industrial fixed-interest securities.
At a glance
Share price and discount
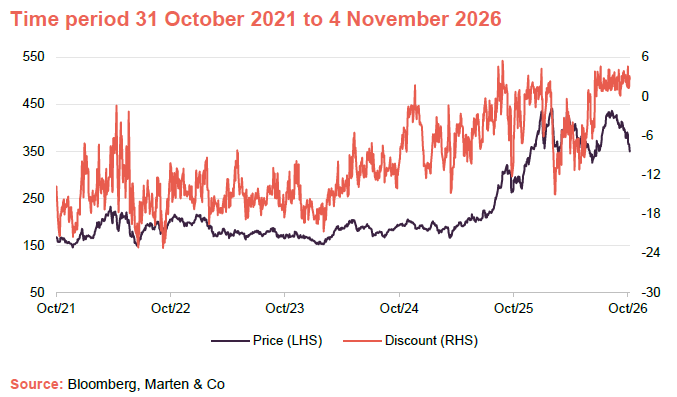
CYN’s share price has risen strongly since early 2025, although it has retreated from its 2026 high. The discount narrowed sharply following the 2025 tender offer and accompanying shareholder-friendly measures. Having previously traded on persistent double-digit discounts, the shares have recently traded close to NAV and occasionally at a premium, allowing CYN to begin expanding again.
Performance over five years
CYN has delivered strong five-year returns. Both the NAV and share price outperformed the MSCI World Metals & Mining Index, while the share price also marginally exceeded the MSCI World Energy Index. Performance has been particularly strong since early 2025, helped by the managers’ positioning in precious metals and energy.
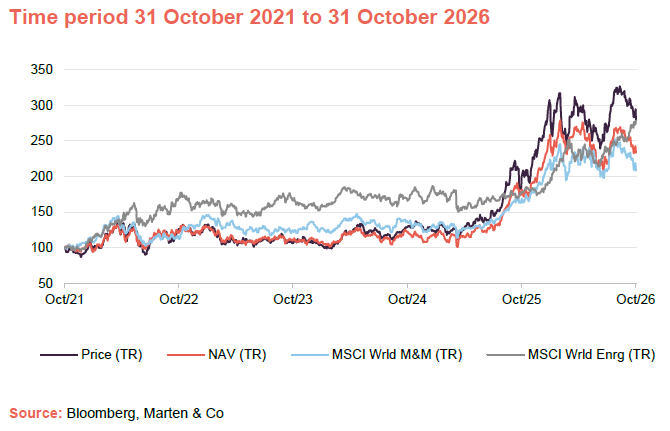
| Year ended | Share price TR (%) | NAV total return (%) | MSCI World Metals & Mining TR (%) | MSCI World Energy TR (%) | MSCI World TR (%) |
|---|---|---|---|---|---|
| 31/10/22 | 26.1 | 21.8 | 12.3 | 71.0 | (2.3) |
| 31/10/23 | (14.8) | (9.4) | 8.3 | (2.9) | 4.9 |
| 31/10/24 | 20.7 | 10.4 | 10.9 | 1.3 | 26.9 |
| 31/10/25 | 57.0 | 48.7 | 24.2 | 6.1 | 20.0 |
| 31/10/26 | 37.2 | 28.8 | 24.2 | 56.0 | 10.4 |
Preserving the managers’ expertise
Watson and Crayfourd resumed responsibility for the portfolio in September
City Natural Resources Growth and Income (CYN) transferred its investment management mandate from Manulife | CQS to Tufton Investment Management on 14 September 2026, following the departure of its longstanding portfolio managers, Keith Watson and Robert Crayfourd, from CQS. The board’s decision preserves the expertise and investment approach behind the trust’s strong long-term performance. The managers, who have run CYN since 2013, resumed responsibility in September, ending a period of uncertainty. The trust was subsequently renamed City Natural Resources Growth and Income, with its ticker unchanged.
Tufton provides a complementary source of specialist research
Tufton’s energy and shipping expertise adds specialist research, industry contacts and market knowledge that should help the managers identify natural resources opportunities. This is particularly relevant given CYN’s substantial oil and gas exposure and growing interest in shipping companies, where Tufton’s sector knowledge could offer a competitive advantage.
Manager’s view
Outlook for natural resources dominated by geopolitical tensions
CYN’s managers see geopolitical tensions, particularly the Middle East conflict and its effect on global energy supplies, dominating the outlook for natural resources. Some oil shipments through the Strait of Hormuz have resumed, but attacks on shipping and energy infrastructure still disrupt supplies.
Diesel shortages are a particular concern, with refining margins rising sharply. The managers believe disruption could last longer than markets expect, supporting their sizeable holdings in oil and gas producers. They also favour shipping companies, including Frontline and BW LPG, which benefit from longer routes, fewer available vessels and much higher freight rates.
Longer-term investment case for gold remains compelling
Precious metals remain a strong conviction. Higher energy prices have increased inflationary pressures and interest rate expectations, challenging gold in the short term. However, high government debt, concerns about weakening currencies and geopolitical uncertainty support longer-term demand. Gold producers still enjoy historically high margins. The managers favour gold mining shares, seeing attractive valuations despite strong performance and volatility. They also believe these companies can absorb rising energy costs better than many industrial miners.
The managers remain cautious on copper and other base metals, whose demand is more exposed to a slowing global economy, particularly China. Although expanding AI data centres provide additional copper demand, they see its contribution as small compared with construction and manufacturing. The portfolio therefore focuses on precious metals, energy and shipping, with limited exposure to more economically sensitive commodities.
Asset allocation
Diversified portfolio that is biased to mid-caps and producers
Figures 1 and 2 show CYN’s broad exposure to natural resources. Its managers favour companies that generate cash and can sustain themselves through the cycle.
The portfolio favours mid-sized companies, with very little exposure to exploration businesses
CYN’s top 10 holdings (see Figure 3) will likely be familiar to regular followers, reflecting the managers’ long-term approach and low portfolio turnover, typically around 50% a year. Much of this involves reducing holdings nearing target prices and adding to those offering a better balance of risk and potential reward.
Figure 1: Sectoral allocation as at 30 September 20261
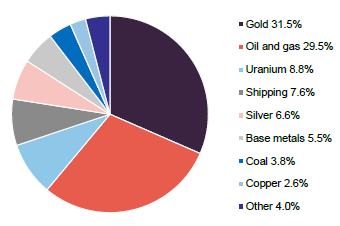
Figure 2: Geographic allocation as at 30 September 20261,2
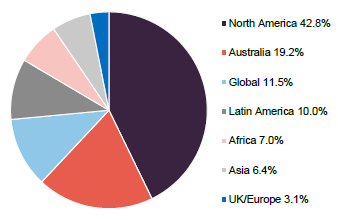
Over six months, sector allocations changed modestly: shipping +2.5%; oil and gas -2.0%; uranium -2.4%. The main geographical changes, based on companies’ principal operations, were: global +4.0%; Asia +0.8%; Australia +1.8%; Africa -4.9%; UK/Europe -1.1%; Latin America -0.7%.
Top 10 holdings
Figure 3 shows CYN’s top 10 holdings at 30 September 2026 and changes over the previous six months. Five holdings entered the top 10: PDI Gold, Talon Metals, Ora Banda, West African Resources and Frontline, while Core Natural Resources, Robex Resources, Transocean, Greatland Resources and Equinox Gold have left.
Figure 3: Top 10 holdings as at 30 September 2026
| Holding | Sector | Country | Allocation 30 September 2026 (%) | Allocation 31 March 2026 (%) | Percentage point change |
|---|---|---|---|---|---|
| Tamboran Resources | Oil & gas | Australia | 4.7 | 6.0 | (1.3) |
| NexGen Energy | Uranium | Canada | 4.6 | 5.8 | (1.2) |
| BW LPG | Gas shipping | Global | 4.0 | 3.1 | 0.9 |
| Emerald Resources | Precious metals | Australia | 4.0 | 3.1 | 0.9 |
| Spartan Delta | Oil & gas | Canada | 3.9 | 4.1 | (0.2) |
| PDI Gold1 | Precious metals | West Africa | 3.7 | 3.0 | 0.7 |
| Talon Metals | Base metals | United States | 3.2 | 2.3 | 0.9 |
| Ora Banda | Precious metals | Australia | 2.9 | 2.2 | 0.7 |
| West African Resources | Precious metals | Burkina Faso | 2.8 | 2.5 | 0.3 |
| Frontline | Crude oil shipping | Global | 2.6 | 1.3 | 1.3 |
| Total of top 103 | 36.4 | 36.6 | (0.2) | ||
| Total of top 203 | 59.0 | 58.0 | 1.0 |
Tamboran Resources (4.7%) delivered its first gas from Australia’s Beetaloo Basin to the Northern Territory market in September 2026. Its Shenandoah South pilot project is being commissioned, with further drilling and testing expected to clarify commercial potential. The May acquisition of Falcon Oil & Gas expanded its basin position.
NexGen Energy (4.6%) received a site preparation and construction licence for its high-grade Rook I uranium project in Saskatchewan, Canada, from the Canadian Nuclear Safety Commission in March 2026. This substantially reduces regulatory uncertainty, allowing progress towards construction. Rook I offers exposure to long-term nuclear fuel demand, though development and financing risks remain.
BW LPG (4.0%), a leading liquefied petroleum gas shipping company, has benefited from exceptionally strong freight markets as Middle Eastern shipping disruption reduced vessel availability. Second-quarter 2026 shipping earnings averaged $74,000 per available day. Around 92% of third-quarter capacity was fixed at an average $88,000 per day. It declared a $0.95 quarterly dividend.
Emerald Resources (4.0%) continues to generate substantial cash flow from Cambodia’s Okvau gold mine, producing 20,280 ounces in the September quarter. FY2027 production guidance remains 100,000–115,000 ounces and is developing Dingo Range in Australia and Memot in Cambodia, supporting its ambition to produce over 300,000 ounces annually across multiple mines.
Spartan Delta Corp (3.9%), the Canadian oil and gas producer, is expanding production, particularly at Duvernay in Alberta. Second-quarter 2026 output rose 37% year-on-year to 52,818 barrels of oil equivalent daily, prompting higher full-year guidance. Growing liquids production is attractive in the current market, though natural gas prices remain important to earnings.
PDI Gold (3.7%), formerly Predictive Discovery, merged with Robex Resources in April 2026, combining the producing Kiniéro and Nampala gold mines with PDI’s substantial Bankan project in Guinea. The group reported gold ore reserves of 4.8 million ounces in September. Bankan still needs development approvals.
Talon Metals Corp (3.2%) is advancing its Tamarack nickel-copper-cobalt project in Minnesota, a potential major US source of critical minerals. High-grade drilling results are encouraging, and Humboldt Mill in Michigan is the proposed processing site. Environmental assessments continue, but the project remains pre-production, with permitting and financing risks.
Ora Banda Mining (2.9%) is expanding its Davyhurst gold operations in Western Australia. September-quarter output was 33,305 ounces, though weather disruption and mill downtime raised costs. Development of the high-grade Waihi underground mine and construction of a processing plant with annual capacity of three million tonnes are central to longer-term growth.
West African Resources (2.8%) is increasing production at Sanbrado and Kiaka in Burkina Faso. Record September-quarter gold output of 127,950 ounces brought production for the first nine months of 2026 to 360,857 ounces. It remains on course for full-year guidance of 430,000–490,000 ounces, though explosives availability at Kiaka constrains operations.
Frontline (2.6%), the crude oil tanker operator, has benefited significantly from shipping disruption caused by the Middle Eastern conflict. Record second-quarter 2026 net profit reached $659.2m, with its largest tankers earning average spot rates of $152,700 daily. A $2.61 quarterly dividend reflected exceptionally strong cash generation, though tanker earnings remain highly cyclical.
Performance
As discussed in previous notes, CYN’s managers adjust allocations across resource areas based on expected performance, choosing their preferred individual investments within these areas. This approach has been successful over the long term, with CYN’s net asset value and share price outperforming commodities indices and global equities over most periods of three years or more, often by comfortable margins.
Figure 4: CYN NAV/MSCI World Metals and Mining and CYN NAV/MSCI World Energy Sector – rebased to 100 over 10 years to 31 October 2026
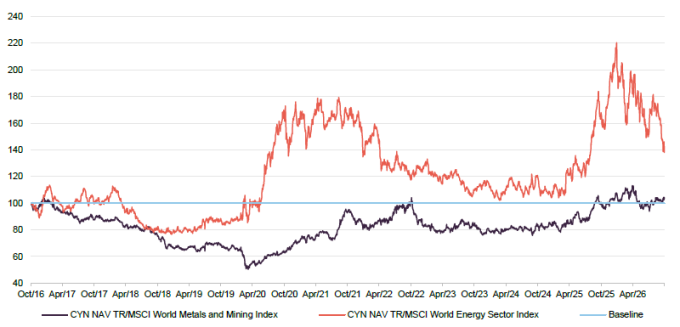
CYN performed strongly between March 2025 and March 2026, mainly due to its substantial holdings in precious metals miners. These benefited from geopolitical uncertainty, concerns over government debt, persistent inflation and growing demand for gold as a safe haven. The managers favoured gold mining shares over physical gold, allowing the trust to benefit from the amplified effect of rising gold prices on producers’ earnings and cash flows.
Click here for a live comparison of the commodities and natural resources peer group.
Industrial commodities and conventional energy faced tougher conditions, but CYN benefited from its more modest exposure. Weakness in China’s property market and global growth concerns weighed on base metal demand expectations, while rising OPEC production dampened the oil outlook. The managers initially took profits in gold miners whose valuations had risen strongly, reinvesting in smaller, less-researched businesses with greater potential. From December 2025 to March 2026, however, they reduced gold and silver mining exposure following strong performance and increased energy holdings, where valuations looked more attractive. This timing proved favourable as energy prices were affected by the outbreak of war in Iran, while gold prices subsequently fell as markets factored in higher interest rates.
Figure 5: Cumulative total return performance over periods ending 31 October 20261
| 1 month (%) | 3 months (%) | 6 months (%) | 1 year (%) | 3 years (%) | 5 years (%) | 10 years (%) | |
|---|---|---|---|---|---|---|---|
| CYN NAV | (6.6) | 6.1 | (11.3) | 28.8 | 111.3 | 133.2 | 288.4 |
| CYN share price | (9.2) | 6.1 | (3.9) | 37.2 | 159.9 | 179.1 | 402.4 |
| MSCI World Metals & Mining2 | (8.7) | (0.7) | (4.3) | 24.2 | 71.1 | 108.1 | 272.4 |
| MSCI World Energy Sector2 | 11.8 | 16.2 | 17.0 | 56.0 | 67.6 | 178.4 | 181.4 |
| MSCI World | (1.7) | 1.3 | 6.6 | 10.4 | 68.2 | 72.3 | 225.5 |
Premium/(discount)
Figure 6: CYN Premium/(discount) over five years
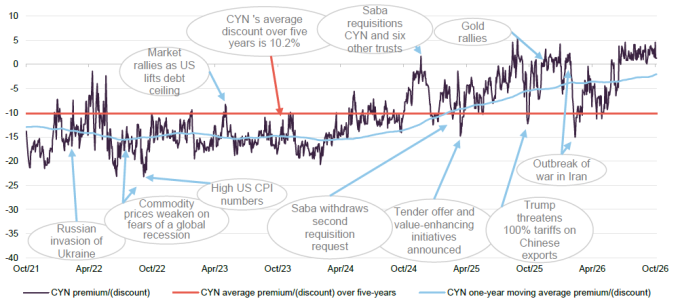
Figure 6 shows a positive market response to CYN’s 100% tender offer and value-enhancing measures announced in May 2025, including the lower management fee and enhanced annual dividend noted above. Wider economic events have caused notable volatility for CYN and markets, reflecting many commodities’ sensitivity to these events. Despite this, we believe CYN’s discount has seen a lasting shift. Following the tender, its shareholders understand its proposition and enhanced dividend policy. Recent trading at a premium has allowed the trust to reissue shares and grow again.
Over the past 12 months, CYN has traded between a 15.0% discount and a 4.6% premium, averaging a 2.1% discount. At 4 November 2026, it traded at a 2.6% discount.
Fund profile
Diversified natural resources exposure
Further information can be found at: https://citynats.com/.
CYN aims to provide capital growth and income, mainly through mining and resource shares, alongside selected mining, resource and industrial fixed-income investments. The managers seek undervalued companies offering attractive income for the risks taken and potential capital growth. Its strong focus on medium-sized companies provides more company-specific exposure than peers focused on larger businesses, distinguishing it from major resource indices and sector exchange-traded funds.
Previous publications
Figure 7: QuotedData’s previously published notes on CYN
SWOT analysis
Figure 8: SWOT analysis for CYN
| Strengths | Weaknesses |
|---|---|
| CYN’s peers tend to be large-cap focused, particularly the more diversified funds that offer a broader commodities and natural resources exposure.
CYN, with its distinct mid-cap bias, offers something different. Its managers are able to look further down the market cap scale in search of opportunities in a less-well-researched segment of the market. We view a holding in CYN as complementary to one of the large-cap funds. With a c.8% yield on NAV annually, CYN’s offering is well suited to shareholders who want some capital growth but would also want a significant level of income from their investment. |
CYN could suffer periods when absolute and/or relative performance is difficult, particularly when the growth outlook deteriorates, as commodities tend to be cyclical in nature.
However, the managers tactically adjust the portfolio’s exposure to different areas reflecting their outlook – for example, increasing the allocation to gold and precious metals in times of higher expected inflation and/or greater uncertainty, which can offset this effect. |
| Opportunities | Threats |
| CYN’s managers believe the inflation story has further to run and, if so, its portfolio is positioned to benefit from this. However, the managers have shown themselves to be adept at shifting the trust’s underlying commodity exposures to suit the prevailing macroeconomic conditions and so there will be further opportunities – for example, by moving into more cyclical positions as the growth outlook improves.
Many commodities have exposure to long-term structural growth trends; for example, the need to replace ageing infrastructure (i.e. steel) as well as the electrification of transport, heating and manufacturing (i.e. lithium and copper). |
Individual commodities can experience extended bear markets – often a function of over-investment in capacity when markets are buoyant. However, miners have exhibited much greater capital discipline during the last 15 years and an extended commodity bear market means that there is limited excess capacity in the system such that price risk is primarily to the upside, to the benefit of producers.
There is a risk of allocating to the wrong natural resource sectors when determining a strategic allocation. However, the managers have access to the wider resources of Tufton to help them make these decisions, and upswings in commodity market pricing can persevere, so the managers can be patient and do not always need to catch the first wave to outperform. |
Bull vs bear case
Figure 9: Bull vs bear case for CYN
| Aspect | Bull case | Bear case |
|---|---|---|
| Performance | CYN’s more defensive commodities exposures, particularly precious metals, have performed strongly this year, against a backdrop of higher uncertainty. | Small and mid-cap mining companies, where CYN is focused, tend to be more sensitive to the commodities cycle. This tends to benefit CYN in rising markets, but can hurt disproportionately when they are not. |
| Dividends | CYN targets a dividend of around 8% of NAV annually, paying out of capital as necessary. This is an attractive level for investors who need income from their investments. | Dividend can fluctuate with the NAV. |
| Discount | CYN has recently been trading close to par and has issued stock when it has been trading at a premium to NAV. | If performance starts to lag, this could weigh on CYN’s discount, although the single discount policy, clean register and other shareholder-friendly measures should help keep this in check. |
| Outlook | CYN’s managers believe its defensive allocations, including precious metals, have further to run and are positioning the portfolio accordingly. | CYN’s defensive allocation could lag in a broad commodities bull market, but its managers have shown themselves adept at adjusting to changing circumstances. |
IMPORTANT INFORMATION
Marten & Co (which is authorised and regulated by the Financial Conduct Authority) was paid to produce this note on City Natural Resources Growth and Income Plc.
This note is for information purposes only and is not intended to encourage the reader to deal in the security or securities mentioned within it.
Marten & Co is not authorised to give advice to retail clients. The research does not have regard to the specific investment objectives financial situation and needs of any specific person who may receive it.
The analysts who prepared this note are not constrained from dealing ahead of it but, in practice, and in accordance with our internal code of good conduct, will refrain from doing so for the period from which they first obtained the information necessary to prepare the note until one month after the note’s publication.
Nevertheless, they may have an interest in any of the securities mentioned within this note.
This note has been compiled from publicly available information. This note is not directed at any person in any jurisdiction where (by reason of that person’s nationality, residence or otherwise) the publication or availability of this note is prohibited.
Accuracy of Content: Whilst Marten & Co uses reasonable efforts to obtain information from sources which we believe to be reliable and to ensure that the information in this note is up to date and accurate, we make no representation or warranty that the information contained in this note is accurate, reliable or complete. The information contained in this note is provided by Marten & Co for personal use and information purposes generally. You are solely liable for any use you may make of this information. The information is inherently subject to change without notice and may become outdated. You, therefore, should verify any information obtained from this note before you use it.
No Advice: Nothing contained in this note constitutes or should be construed to constitute investment, legal, tax or other advice.
No Representation or Warranty: No representation, warranty or guarantee of any kind, express or implied is given by Marten & Co in respect of any information contained on this note.
Exclusion of Liability: To the fullest extent allowed by law, Marten & Co shall not be liable for any direct or indirect losses, damages, costs or expenses incurred or suffered by you arising out or in connection with the access to, use of or reliance on any information contained on this note. In no circumstance shall Marten & Co and its employees have any liability for consequential or special damages.
Governing Law and Jurisdiction: These terms and conditions and all matters connected with them, are governed by the laws of England and Wales and shall be subject to the exclusive jurisdiction of the English courts. If you access this note from outside the UK, you are responsible for ensuring compliance with any local laws relating to access.
No information contained in this note shall form the basis of, or be relied upon in connection with, any offer or commitment whatsoever in any jurisdiction.
Investment Performance Information: Please remember that past performance is not necessarily a guide to the future and that the value of shares and the income from them can go down as well as up. Exchange rates may also cause the value of underlying overseas investments to go down as well as up. Marten & Co may write on companies that use gearing in a number of forms that can increase volatility and, in some cases, to a complete loss of an investment.