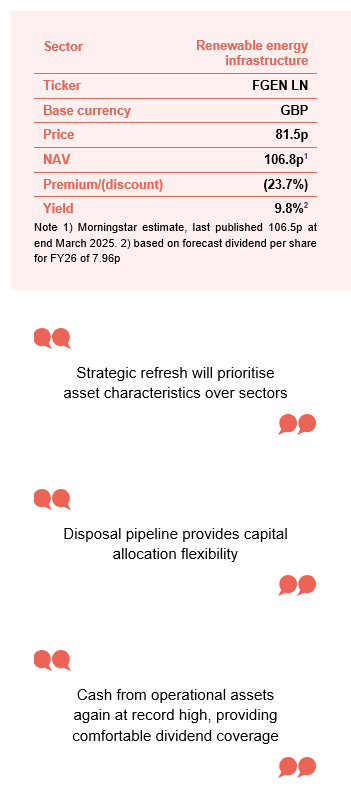
Strategic refresh
Foresight Environmental Infrastructure (FGEN) has set out its strategic focus over the medium term that will centre on core renewable energy generation assets. This will see it sell its growth assets once operations have ramped up and valuation maximised. This will provide the company with capital allocation flexibility and allow it to invest the sales proceeds into assets that display attractive income characteristics such as visible, stable and secure long-term revenue with inflation linkage (revenues that increase in line with inflation, helping to preserve real returns). This will help the company build on its enviable dividend track record, which has grown every year since inception in 2014 and has been comfortably covered by income. FGEN’s manager stresses that it is not abandoning growth-style assets, but that these will be targeted in mature technologies with a proven market.
The capital growth potential of its readymade disposal pipeline, along with record cash flows from its core portfolio, makes FGEN’s discount to NAV highly attractive.
Progressive dividend from investment in environmental infrastructure assets
FGEN aims to provide its shareholders with a sustainable, progressive dividend, and to preserve capital values. It invests in a diversified portfolio of environmental infrastructure technologies, targeting projects characterised by long-term stable cash flows, secured revenues, and inflation linkage. Investment in these assets is driven by the need to address climate change and societal demand for sustainability.
At a glance
Share price and discount
FGEN’s discount to NAV widened substantially from October 2024 as a higher-for-longer interest rate narrative grew in the UK following the budget and the announcement that HH2E had fallen into administration. FGEN’s discount has been narrowing since February, however.
Time period 30 June 2020 to 18 July 2025
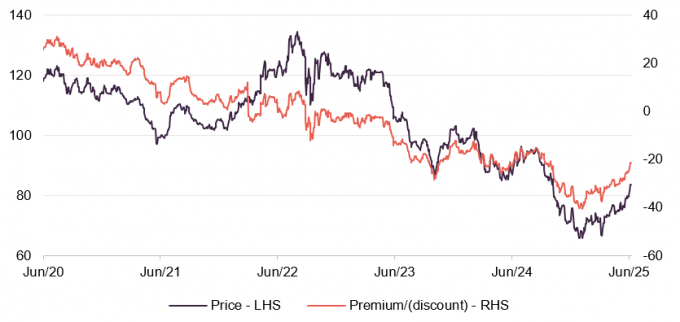
Source: Morningstar, Marten & Co
Performance over five years
FGEN’s NAV returns over the past three years have been flat despite substantial headwinds that it and the renewable energy infrastructure sector have faced over the period, including higher discount rates used to value FGEN’s assets.
Time period 30 June 2020 to 30 June 2025
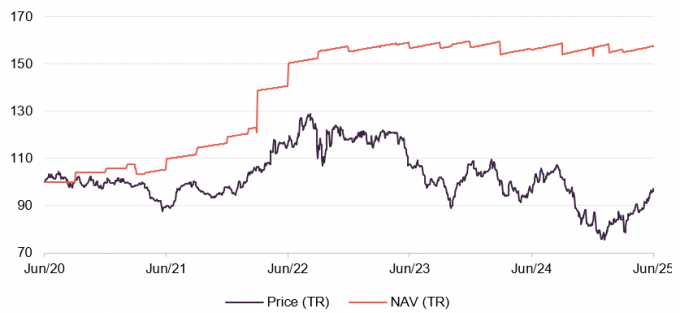
Source: Morningstar, Marten & Co
| 12 months ending | Share price TR (%) | NAV total return (%) | Earnings per share (pence) | Adjusted EPS (pence) | Dividend per share (pence) |
|---|---|---|---|---|---|
| 31/03/2021 | 6.9 | 1.5 | 1.5 | 6.7 | 6.76 |
| 31/03/2022 | 7.3 | 34.1 | 30.6 | 7.0 | 6.80 |
| 31/03/2023 | 12.2 | 13.1 | 14.9 | 6.7 | 7.14 |
| 31/03/2024 | (15.8) | (1.8) | (2.1) | 7.5 | 7.57 |
| 31/03/2025 | (15.9) | 0.6 | (0.4) | 8.6 | 7.80 |
Fund profile
Further information can be found at FGEN.com
FGEN invests in a diversified portfolio of private infrastructure assets that deliver stable returns, long-term predictable income and opportunities for growth whilst supporting the drive towards decarbonisation and sustainable resource management.
FGEN invests in three core areas of environmental infrastructure: renewable energy generation, other energy infrastructure, and sustainable resource management. Renewable energy generation investments include wind, solar, AD (anaerobic digestion – the breakdown of organic matter by microbes in the absence of oxygen, producing biogas and fertiliser), biomass, waste management, and hydropower. Energy infrastructure assets include battery energy storage and low carbon transport. Sustainable resource management include wastewater, waste processing, and sustainable solutions for food production such as agri- and aquaculture-controlled environment projects.
FGEN’s portfolio is diversified across complementary sectors, technologies and geographies which substantially de-risks it from exposure to fluctuations in weather patterns and helps differentiate the company from its peers.
FGEN aims to deliver robust and attractive risk-adjusted returns, with 61% of its revenues received through government-backed subsidies and long-term contracts, benefiting from contractual inflation linkage.
FGEN’s mandate allows it to invest in emerging areas of environmental infrastructure, provided they are sufficiently mature and display strong infrastructure characteristics.
FGEN’s AIFM is Foresight Group LLP (Foresight). Foresight is one of the best-resourced investors in renewable infrastructure assets, with £13.2bn of AUM (assets under management) as at 31 March 2025. This includes Foresight Solar Fund, which sits in FGEN’s listed peer group. Foresight has a highly experienced and well-resourced global infrastructure team with 190 infrastructure professionals managing around 4.7GW (gigawatts) of energy infrastructure. It is a global business, with offices in 10 countries. The co-lead managers for FGEN are Chris Tanner, Edward Mountney and Charlie Wright.
Market backdrop – fresh strategic focus
Allocation to growth assets to be recycled over the medium term
A fresh strategic focus, which was set out by FGEN’s board in June, will see the company concentrate on its core renewable energy generation assets that display characteristics of long-term stable cash flows, secure revenues, and inflation linkage. This amounts to the majority of FGEN’s current portfolio (see page 13 for a detailed look at the portfolio). Assets with the most growth potential, namely its early stage projects in controlled environment and low carbon transportation – which have both been identified as attractive medium-term disposal opportunities once they’ve been fully ramped up.
This seems like a sensible strategic approach to us at this point in time. The core portfolio is generating record revenue (of £90.4m in its 2025 financial year), which is comfortably covering a dividend that has steadily grown every year since its inception in 2014. It would not make sense to sell any more of these core assets (having disposed of around 10% of its portfolio in the last financial year), especially given that the company’s floating rate debt is now at a more manageable level and that it has not been rewarded – in terms of its discount to NAV narrowing – despite selling these assets at or above the value they are held on FGEN’s balance sheet.
Disposal pipeline provides capital allocation flexibility
It is also rational to hold on to the growth assets whilst operations are ramped up before looking to sell them once the assets are in a steady state of operations. This could be in two or three years’ time, the manager says, but greater value would most likely be achieved at this point. All the while, shareholders will benefit from valuation uplifts as the projects reach certain milestones and increased revenues. This ready-made disposal pipeline provides the company with future capital allocation flexibility – whether that be further debt reduction, share buybacks, reinvestment into its portfolio, or new investment opportunities.
Future investments will prioritise asset characteristics over sectors
Whilst future investments will continue to focus on core renewable generation assets, other energy infrastructure (which includes storage, cleaner heat or cleaner transport) and sustainable resource management (especially around assets in water and waste management), the manager says that it will prioritise asset income characteristics over sectors. The focus will be on investments with infrastructure-like characteristics – being long-term, secure revenue, stable cash flows, and inflation linkage.
The manager adds that an allocation to construction and development stage assets of around 10% will be maintained, to provide capital growth opportunities, although the exact percentage will vary as assets move through development/construction and into operations or exit. However, the manager insists that investments in earlier-stage assets or platforms will be in mature technologies with a proven market, with an established regulatory framework underpinning it – avoiding the pitfalls of HH2E (an FGEN investment that went into administration last year – which we covered in detail in our previous note).
In doing so, FGEN will maintain its point-of-difference among its peer group, where it has one of the broadest remits (most of its peers are focused on solar or wind or a combination of the two) and diversified portfolios.
FGEN’s manager has shared some examples of investments that it is tracking that marry with its new focus. These include funding the development of onshore wind repowering assets across Europe, investing in an AD platform also in Europe, and backing a provider of last-mile water services (infrastructure that delivers water to end-users, typically in decentralised or hard-to-reach areas). All three examples offer strong revenue potential and are underpinned by an established regulatory framework. In the case of the development examples, FGEN would be partnering with experienced developers in mature markets.
Renewable energy infrastructure investment case as strong as ever with a required annual investment uplift of 204%
The investment case for the renewable energy infrastructure sector is as positive as ever. As well as the obvious societal push for decarbonisation, demand for electrification (shifting from fossil fuels to electric alternatives in sectors like transport and heating) is increasing and with it demand for renewable infrastructure. Meanwhile, regulatory tailwinds remain strong in both the UK and Europe – evidenced by the UK Energy Act and the EU Net Zero Industry Act (policies promoting low-carbon energy investment and innovation). Forecasted investment in energy transition is vast, as shown in Figure 1, with a 204% annualised uplift required over the next five years versus actual investment in 2023, with a further 58% increase over the following decade.
Figure 1: Energy transition investment versus required annualised levels ($bn)
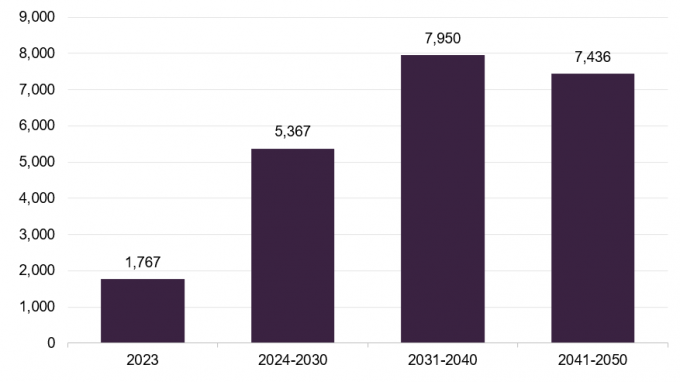
Source: BloombergNEF 2024, Marten & Co
Annual results – record cash receipts
FGEN reported a NAV of £678.7m or 106.5p per share in annual results to 31 March 2025 – a 6.3% fall over the 12-month period. Factoring in dividends of 7.8p, this equated to a flat 0.6% NAV total return in the period.
The fall in NAV was largely attributable to the full write-down (£19.3m) of its investment in HH2E, a developer of green hydrogen production projects in Germany that went into administration in November 2024 (which we discussed at length in our previous note – links to which can be found on page 29).
Cash from operational assets again at record high
Distributions received from projects were again at a record high at £90.4m (the 10th successive year of increased cash received from investments since IPO, and beating last financial year’s total of £87.0m). This underpinned the dividend with a coverage of 1.32x (meaning net income was 1.32 times the dividend paid), and helped fund both the repayment of floating rate debt and share buybacks. The value of the portfolio fell £126.2m over the period, as shown in Figure 2, due mainly to portfolio sales and the write-down of the HH2E asset.
Figure 2: FGEN portfolio valuation in £m, as at 31 March 2025
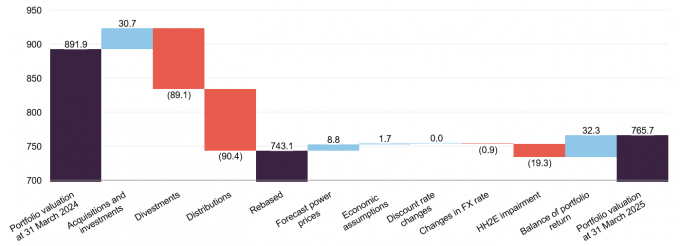
Source: FGEN, Marten & Co
Drivers of portfolio returns
Several factors (outside disposals and the HH2E write-down) impacted FGEN’s NAV. We detail these factors and their sensitivities below, beginning with power prices.
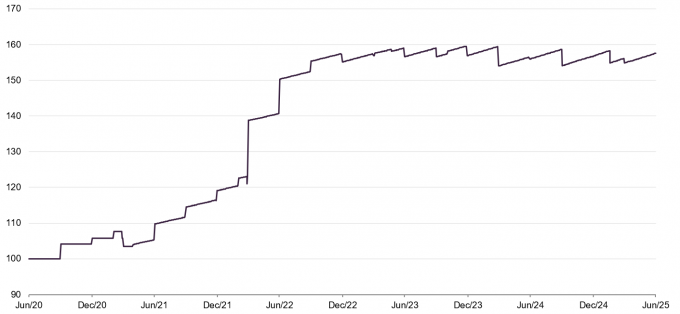
Power prices
Power prices have been relatively stable over the last year, as shown in Figure 3. With geopolitical risks heightened, FGEN’s manager says that it is alert to energy price uplifts and would look to fix these in on long-term agreements (also known as power purchase agreements, which are contracts to buy electricity at a set price from a generator over a fixed period). The marginal change in forecasts for future electricity and gas prices compared to forecasts at 31 March 2024 increased FGEN’s NAV by £8.8m over the year.
Figure 3: UK power prices
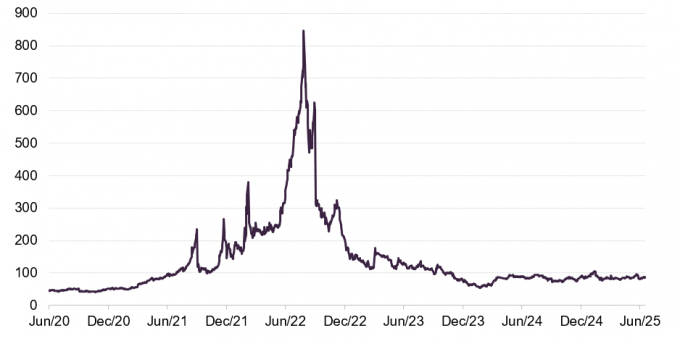
Source: Bloomberg – UK baseload
Fixed prices secured on the majority of portfolio
FGEN looks to de-risk its exposure to volatile market prices and has fixed prices for the majority of its output. At 31 March 2025, the portfolio had price fixes secured at 59% for the Summer of 2025 season and 51% for Winter 2025/26 season.
The rapidly escalating Middle East crisis could create heightened volatility for oil and gas prices with risks to the valuation related to power price assumptions both to the upside and the downside.
An increase in electricity and gas prices of 10% would add £35.9m (or 5.6p) to NAV and a 10% fall in power prices would take off £35.3m (or 5.5p).
FGEN’s manager states that in the extreme event that electricity prices fall to £40/MWh (they are currently at around £93/MWh) and gas prices fall by a corresponding amount, the company would maintain a resilient dividend cover for the next three financial years, albeit with reduced headroom by year three.
Discount rates
UK gilt yields have remained at elevated levels for a sustained period and have moved higher in recent months following heightened global macro concerns including the impact of US trade tariffs, as shown in Figure 4.
Figure 4: Long-term (10-year and 30-year) UK gilt yields
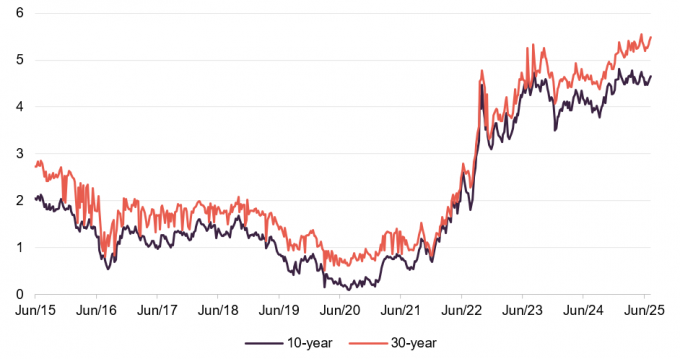
Source: Bloomberg, Marten & Co
The weighted average discount rate now sits at 9.7%
No macro drivers or project-specific factors prompted changes to the discount rates used to value FGEN’s portfolio. However, FGEN’s weighted average discount rate moved out slightly to 9.7% (from 9.4%). This was primarily due to an increase in the value of assets in construction (which are valued using higher discount rates to reflect the increased risk versus operational assets).
There was no change to NAV resulting from changes to the discount rate.
A reduction in the discount rate of 0.5% would result in an uplift in value of £18.0m (or 2.8p per share), while a downward movement in the portfolio valuation of £17.2m (2.7p per share) would occur if discount rates were increased by the same amount.
Inflation
Inflation assumptions remained static
61% of FGEN’s forecasted revenues are contractually linked to inflation (as measured by the RPI) through government-backed subsidies and long-term contracts. Inflation assumptions used to value FGEN’s portfolio (based on actual data and independent forecasts) remained the same at 3.5% RPI inflation for 2025, reverting to 3% until 2030, and then falling to 2.25% thereafter. This resulted in no movement in FGEN’s NAV over the six-month period to the end of September.
Figure 5: UK RPI year-on-year (%)
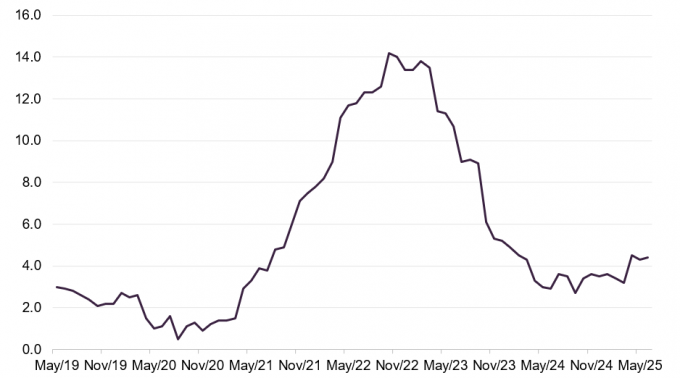
Source: ONS, Marten & Co
Figure 5 shows that RPI inflation has risen over recent months and was 4.4% in June 2025. FGEN’s sensitivity to changes in the inflation rate is about +£22.1m or 3.5p on the NAV for every 0.5% increase in the forecast inflation rate and a decrease of £21.2m or 3.3p on the NAV if rates were reduced by the same amount.
Taxation
Tax impact of EGL lower than in 2024
As we discussed in more detail in previous notes (links to which can be found on page 26), the UK government introduced a temporary windfall tax (a one-off levy on companies that have made unexpectedly high profits) on electricity generators – the Electricity Generator Levy (EGL) – in response to higher energy prices. FGEN’s wind, solar and biomass assets are affected by the levy, which saw the government take 45% of revenues above a price of £75/MWh from 2023 to April 2024, and thereafter adjusted each year in line with inflation (as measured by CPI) on a calendar-year basis until the levy comes to an end on 31 March 2028.
The company paid a sum of £3.3m for the EGL tax in FGEN’s 2025 financial year. This compared to £5.5m in 2024. The lower amount reflects the drop in power price forecasts year-on-year.
Investment process
Foresight selects projects for the portfolio based on its assessment of each project’s risk and reward profile that fit within its defined investment policy. The group operates within a limited set of investment restrictions. New assets predominantly come from investments in the secondary market acquired from third parties.
The AIFM aims to maintain the balanced and diverse nature of the portfolio. Its approach is a cautious one. Although FGEN can invest across all OECD countries, to date investments have predominantly focused on the UK, with a small but growing exposure to European renewables. The managers say that they prefer to concentrate on countries and regulatory/subsidy regimes that they know well or where they have relationships with established partners.
Investment restrictions
- No more than 25% of the portfolio is to be invested in assets under construction or that are not yet operational, and within that, up to 5% of the portfolio may be invested in development stage assets.
- At least 50% invested in the UK and the balance invested in other OECD countries (member nations of the Organisation for Economic Co-operation and Development, a group of mostly high-income, developed economies that collaborate on policy to promote economic growth and stability).
- No new investment to exceed 30% of NAV (or 25% of NAV based on the acquisition price, taking the value of existing assets into consideration).
Purchases from third parties
Deals can be introduced by the wider Foresight team
The managers have built up good working relationships with project developers. Some opportunities are brought to the managers for appraisal by specialist consultancy firms operating in the area. Deals may also be introduced by the wider Foresight team.
Prices are negotiated at arm’s length and reflect the managers’ assessment of the potential risks and rewards from each project. This includes a review of the project’s capital structure.
ESG assessment
Environmental criteria are embedded in the structure of FGEN’s investment and portfolio management activities.
The group’s infrastructure division is closely aligned with the widely accepted investor, regulatory and sustainability frameworks. Early-stage screening questions include whether the investment is eligible under the EU Taxonomy and aligns with the sustainability strategy. Meanwhile, the division’s proprietary Sustainability Evaluation Tool (SET), which had historically supported the evaluation of ESG and climate-related factors as part of pre-investment due diligence, has been re-designed to act primarily as a tool for ongoing monitoring of these considerations within portfolio management.
Where appropriate, alignment with these frameworks may require the engagement of third-party service providers. As an example, climate-related due diligence and monitoring is conducted using a third party that applies advanced climate models and datasets to assess both acute and chronic physical risks (short-term extreme weather vs. long-term environmental shifts) in alignment with the EU Taxonomy’s Climate Risk and Vulnerability Assessment (CRVA).
These assessments are intended to form the basis for long-term climate risk monitoring and serve as a reference point for ongoing risk management. Portfolio managers work closely with site operators and counterparties to monitor climate-related impacts on asset performance and develop mitigation plans.
To strengthen internal capabilities, the division is also piloting a new geospatial risk platform developed with Frontierra, designed to generate location-based insights into climate and nature-related risks. Following development, the platform is now undergoing initial testing and implementation across the infrastructure, investment, and portfolio management teams in financial year 2026.
This year, FGEN has obtained third-party assurance to verify a suite of key sustainability metrics in accordance with ISAE 3000 (International Standard on Assurance Engagements – a standard for verifying non-financial data), and intends to undertake this third‑party assurance each year to align with best practice in sustainability disclosure.
Ongoing management
The day-to-day facilities management, operations and maintenance of the projects is contracted to third parties
The day-to-day facilities management, operations and maintenance of FGEN’s projects are typically contracted to third parties, and part of the managers’ role is overseeing these arrangements, including approving payments.
The managers seek to identify opportunities for efficiency enhancements and capacity increases. The managers also aim to optimise the financial structures of the project SPVs.
Disposals
FGEN will usually hold its assets for the long term, but the company will sell assets when the managers feel the sale price justifies it or when there are other valid reasons for doing so.
Hedging
When they invest in assets in currencies other than sterling, the managers may choose to hedge the currency exposure back to sterling. The managers may also hedge interest rate risk, inflation risk, power, and commodity prices. All hedging is entirely at the board’s discretion.
Sustainability
There are obvious environmental benefits that derive from FGEN’s investment strategy, and the company discloses under Article 9 of the Sustainable Finance Disclosure Regulation (SFDR) and has sustainable investment as its objective. Although FGEN, as a Guernsey company, does not fall within the scope of the UK Sustainability Disclosure Requirements (SDR) and the associated investment labels, the company aligns with the SDR’s Sustainability Focus investment label as a matter of best practice and publishes associated disclosure documents.
In terms of measurable outcomes, over the year to the end of March 2025, the portfolio generated 1,272GWh of renewable energy (2024: 1,358GWh). It treated more than 34.7bn litres of wastewater (2024: 40.2bn litres) and its actions resulted in more than 703,470 tonnes of waste being diverted from landfill (2024: 680,825 tonnes).
GHG emissions avoided in the financial year 2025 was 193,663 tCO2e, while total emissions from the portfolio (scope 1, 2, and 3) was 166,748 tCO2e.
Foresight Group is a signatory of the United Nations’ Principles for Responsible Investment (UNPRI) and as we noted above, ESG analysis is built into FGEN’s investment process. It is also incorporated into the ongoing monitoring programme for FGEN’s portfolio.
Asset allocation
FGEN has one of the most diversified portfolios among its renewable energy infrastructure peers – with it currently invested in 10 sectors across 40 projects. The portfolio can be split into three key environmental infrastructure pillars:
- renewable energy generation – which is the fund’s core focus, making up 73% of the portfolio by value. This includes wind, solar, AD, biomass, energy from waste, and hydropower. The assets in this bucket are typically mature technologies with low operational risk and stable production and cash flows with inflation linkage;
- other energy infrastructure – which makes up 10% of the portfolio by value and includes battery energy storage and low carbon transport assets. These assets provide diversification of revenue sources away from power generation, with merchant revenues from battery storage coming with a degree of inverse correlation to renewable prices (i.e. storage can benefit when renewable supply is low and prices are high); and
- sustainable resource management – which makes up 17% of the portfolio by value. This includes projects that apply sustainable practices and includes waste and water management assets and controlled environment assets. It provides further diversification away from power generation, with the controlled environment assets (the Glasshouse and Rjukan) coming with the potential for substantial capital growth (as detailed below).
Figure 6: Portfolio value split by sector, as at 31 March 2025
Figure 7: Portfolio split by remaining asset life as at 31 March 2025
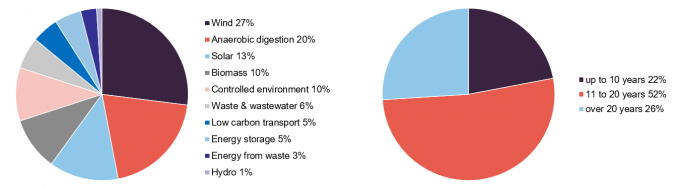
Source: FGEN, Marten & Co
Source: FGEN, Marten & Co
Potential Life extensions for AD assets could result in a substantial valuation uplift
Figure 6 displays FGEN’s portfolio by project type, as at 31 March 2025. The weighted average remaining asset life of the portfolio was 16.3 years, although the manager feels it is being conservative in this area, especially in its AD portfolio. These are currently valued over the life of the renewable heat incentive subsidy (RHI – a UK government scheme providing payments to producers of renewable heat) that they receive. The manager says that there is growing evidence of the ability of the AD facilities to run beyond the end of the tariffs and possibly into perpetuity, and is considering extension scenarios for its AD portfolio, which could result in a substantial valuation uplift.
The majority of its portfolio (89%) is located in the UK, with the 11% outside the UK accounted for by FGEN’s Italian and Norwegian investments.
Figure 8: Portfolio split by operational status as at 31 March 2025
Figure 9: Net present value of future revenues by type as at 31 March 2025
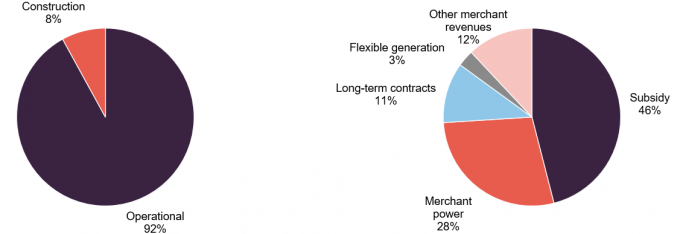
Source: FGEN, Marten & Co
Source: FGEN, Marten & Co
At 8%, FGEN’s construction exposure is not excessive. These projects offer the potential for NAV uplifts as they mature towards a fully ramped up level of operations, with the discount rate applied reducing as they become de-risked.
The top 10 largest assets make up 53% of the total portfolio value, up from 46% at 31 March 2024. Figure 10 details the assets in FGEN’s portfolio, at 31 March 2025.
Figure 10: FGEN portfolio of projects by type, as at 31 March 2025
| Asset | Location | Type | Ownership | Capacity(MW) | Commercial operations date |
|---|---|---|---|---|---|
| Renewable energy generation | |||||
| Bilsthorpe | UK (Eng) | Wind | 100% | 10.2 | Mar 2013 |
| Burton Wold Extension | UK (Eng) | Wind | 100% | 14.4 | Sep 2014 |
| Carscreugh | UK (Scot) | Wind | 100% | 15.3 | Jun 2014 |
| Castle Pill | UK (Wal) | Wind | 100% | 3.2 | Oct 2009 |
| Dungavel | UK (Scot) | Wind | 100% | 26.0 | Oct 2015 |
| Ferndale | UK (Wal) | Wind | 100% | 6.4 | Sep 2011 |
| Hall Farm | UK (Eng) | Wind | 100% | 24.6 | Apr 2013 |
| Llynfi Afan | UK (Wal) | Wind | 100% | 24.0 | Mar 2017 |
| Moel Moelogan | UK (Wal) | Wind | 100% | 14.3 | Jan 2003 & Sep 2008 |
| New Albion | UK (Eng) | Wind | 100% | 14.4 | Jan 2016 |
| Wear Point | UK (Wal) | Wind | 100% | 8.2 | Jun 2014 |
| Biogas Meden | UK (Eng) | Anaerobic digestion | 49% | 5.0 | Mar 2016 |
| Egmere Energy | UK (Eng) | Anaerobic digestion | 49% | 5.0 | Nov 2014 |
| Grange Farm | UK (Eng) | Anaerobic digestion | 49% | 5.0 | Sep 2014 |
| Icknield Farm | UK (Eng) | Anaerobic digestion | 53% | 5.0 | Dec 2014 |
| Merlin Renewables | UK (Eng) | Anaerobic digestion | 49% | 5.0 | Dec 2013 |
| Peacehill Farm | UK (Scot) | Anaerobic digestion | 49% | 5.0 | Dec 2015 |
| Rainworth Energy | UK (Eng) | Anaerobic digestion | 100% | 5.0 | Sep 2016 |
| Vulcan Renewables | UK (Eng) | Anaerobic digestion | 49% | 5.0 | Oct 2013 |
| Warren Energy | UK (Eng) | Anaerobic digestion | 49% | 5.0 | Dec 2015 |
| Amber | UK (Eng) | Solar | 100% | 9.8 | Jul 2012 |
| Branden | UK (Eng) | Solar | 100% | 14.7 | Jul 2013 |
| CSGH | UK (Eng) | Solar | 100% | 33.5 | Mar 2014 & Mar 2015 |
| Monksham | UK (Eng) | Solar | 100% | 10.7 | Mar 2014 |
| Pylle Southern | UK (Eng) | Solar | 100% | 5.0 | Dec 2015 |
| Codford Biogas | UK (Eng) | Waste anaerobic digestion | 100% | 3.8 | 2014 |
| Cramlington Renewable Energy Developments | UK (Eng) | Biomass combined heat and power | 100% | 32.0 | 2018 |
| Bio Collectors | UK (Eng) | Waste anaerobic digestion | 100% | 11.7 | Dec 2013 |
| Energie Tecnologie Ambiente (ETA) | Italy | Energy-from-waste | 45% | 16.8 | 2012 |
| Northern Hydropower | UK (Eng) | Hydropower | 100% | 2.0 | Oct 2011 & Oct 2017 |
| Yorkshire Hydropower | UK (Eng) | Hydropower | 100% | 1.8 | Oct 2015 & Nov 2016 |
| Other energy infrastructure | |||||
| West Gourdie | UK (Scot) | Battery storage | 100% | n/a | May 2023 |
| Clayfords | UK (Scot) | Battery storage | 50% | n/a | Pre-construction |
| Lunanhead | UK (Scot) | Battery storage | 50% | n/a | Pre-construction |
| Asset | Location | Type | Ownership | Capacity(MW) | Commercial operations date |
| Sandridge | UK (Eng) | Battery storage | 50% | n/a | Under construction |
| CNG Fuels | UK (Eng) | Low carbon transport | 25% | n/a | Various |
| Sustainable resource management | |||||
| Glasshouse | UK (Eng) | Controlled environment | 10% | n/a | Mar 2025 |
| Rjukan | Norway | Controlled environment | 25% | n/a | Under construction |
| ELWA | UK (Eng) | Waste management | 80% | n/a | 2006 |
| Tay | UK (Scot) | Wastewater treatment | 33% | n/a | Nov 2001 |
The company retains low exposure to individual assets, with no asset accounting for more than 10% of the portfolio. As mentioned earlier, FGEN’s re-focus on core environmental assets will see the disposal of its growth assets over the medium term. That includes FGEN’s two controlled environment projects – the Glasshouse and Rjukan – and the CNG portfolio. All three assets have already met significant milestones in their operational ramping-up. We explore in further detail below each asset, its future growth potential and FGEN’s plan to extract maximum value.
CNG Fuels
The CNG Fuels portfolio consists of 16 operational biomethane refuelling stations for compressed natural gas (CNG) vehicles in the UK. Revenues are earned from sales of biomethane fuel to customers under contract – which include several of the largest fleet operators in the UK – with the price of gas passed through to the customer, meaning that FGEN has little exposure to underlying merchant gas prices (gas prices not set by fixed contracts or subsidies).
Potential ramp-up in revenues as CNG vehicle usage grows
The prospect for a ramp-up in revenues is tied to the growth of transport fleets using CNG vehicles. The CNG refuelling stations achieved a 21% increase in fuel dispensed year-on-year as transport operators brought new vehicles into service and new stations became established.
The current network of stations in operation has the capacity to serve 10,000 HGVs (heavy goods vehicles) per day and has an annual dispensing capacity of more than 310 million kg of Bio-CNG (purified biogas upgraded to natural gas quality and compressed for use as a renewable fuel in vehicles or for heating) to customers including Amazon, DHL and Marks & Spencer.
A key development in the CNG sector could come to fruition in the next 12 months, and with it, a significant opportunity to reach new customers. Vehicles that use CNG fuel have historically been limited to smaller trucks, but larger-capacity CNG vehicles are being developed that opens up a far larger market. These larger vehicles require up to 50% more gas per vehicle, compared to the smaller trucks.
In March 2025, FGEN announced the restructuring of its CNG platform that resulted in CNG Foresight (which owns the refuelling stations and in which FGEN holds a 25% stake) combining with CNG Fuels Ltd (the operator of the stations). More detail on the deal can be found below. The manager says that the restructuring better positions the overall venture for growth as the rollout of stations continues and volumes of gas dispensed increase. The transaction provides a path to further growth via a rollout of a further nine public access Bio-CNG refuelling stations by the end of 2028.
The Glasshouse
The Glasshouse controlled-environment facility, which lawfully cultivates tetrahydrocannabinol (THC) cannabis flowers under a UK government-issued licence, is currently in the operational ramp up phase with full sales to established UK-based pharmaceutical manufacturers anticipated in 2027.
Offtake contracts signed for medicinal cannabis supply
Phase one of construction of the Glasshouse, which is co-located with an existing FGEN AD facility that supplies low-carbon heat and power via a private wire (a direct energy connection between generator and user that avoids the public grid), completed in September 2023, allowing for around 12,000kg of plant to be grown per annum. A major offtake contract (when a buyer commits to purchasing a producer’s goods at predetermined terms once production begins) is already in place with Releaf, the UK’s fastest-growing medical cannabis provider, in a multi-million-pound deal to supply cannabis-based products for medicinal use.
Further offtake agreements have been signed as operations continue to ramp up, while new offtake partners are being sought. The manager says that onboarding customers has been slower than expected primarily due to compliance considerations, but prices and margins have been better than projected and the manager remains confident that the sector will continue its rapid rate of growth year on year.
Rjukan
The construction of Rjukan, a land-based trout farm in Norway that uses recirculating aquaculture system (RAS) technology to recirculate pure, clean mountain water, is substantially complete, with partial operations commencing in January 2024 and the first harvest targeted for July 2025.
Set to complete in 2025, with double-digit return expected
When complete, the facility will be capable of producing 8,000 tonnes of trout (or 22 million dinners) per year which is to be sold to European and international salmonid markets. There are currently more than 2 million trout in the facility, with the largest fish now over 2.5kg in size. Marketing has begun and the manager says that interested offtakers have been identified.
Portfolio activity
Low yielding rooftop solar portfolio sold at small premium to NAV
Since our last note in December 2024, FGEN has sold a portfolio of operational rooftop solar assets for £21.2m. A total of £20.5m was payable upon completion, resulting in a small premium to NAV, with a further £0.7m deferred and linked to the satisfaction of certain post-completion obligations. FGEN received £0.3m of this deferred amount in May this year.
The portfolio of more than 1,000 fully operational domestic rooftop, commercial rooftop and ground-mounted solar installations distributed across England, Scotland and Wales, and was acquired by FGEN in 2015. The sale crystallises an IRR of 4.2% and a multiple on invested capital of 1.3x. The proceeds were used to reduce debt (see page 24 for details on FGEN’s gearing).
The restructuring of the CNG platform (mentioned earlier) saw the CNG Foresight entity (in which Foresight funds, including FGEN, own a majority stake) become a subsidiary of CNG Fuels Ltd, which is owned by ReFuels N.V., a leading European supplier of Bio-CNG.
The Foresight funds own 60% of the ordinary share capital of CNG Fuels Ltd (with FGEN’s look-through interest being 15%) and £150.15m in 10% preferred return instruments issued by CNG Fuels (of which FGEN’s interest is £37.5m). ReFuels owns the remaining 40% of ordinary share capital and £15.95m in the same preferred return instruments. ReFuels will also have a return mechanism that may increase its share of value based on the exit valuation of the business.
In August 2024, FGEN sold a 51% stake in a portfolio of six AD assets to the operator Future Biogas for £68.1m (in line with their book value). FGEN retained a 49% holding in the assets, which have a combined generating capacity of 38MW, allowing it to benefit from the future growth and income generated by the portfolio.
The proceeds of the sale were used to repay some of the company’s RCF and to fund its initial £20m share buyback programme (which has since been expanded to £30m – see page 24 for details).
As mentioned earlier, the company will look to dispose of its construction-stage projects over the medium term and hold onto the core renewable energy generating assets.
Performance
FGEN’s NAV returns over the past three years have been flat despite substantial headwinds that it and the renewable energy infrastructure sector have faced over the period, including higher discount rates used to value FGEN’s assets.
Figure 11: FGEN NAV TR over five years to 30 June 2025
Source: Morningstar, Marten & Co. NB with effect from 1 May 2021, Morningstar’s NAV estimate includes an estimate of accrued income
Figure 12: FGEN cumulative performance to 30 June 2025
| 3 months (%) | 6 months (%) | 1 year (%) | 3 years (%) | 5 years (%) | 10 years (%) | |
|---|---|---|---|---|---|---|
| FGEN NAV total return | 1.8 | 2.8 | 1.0 | 4.8 | 57.6 | 105.0 |
| FGEN share price total return | 14.7 | 16.4 | 1.3 | (17.0) | (3.0) | 46.3 |
Peer group
You can access up-to-date information on FGEN and its peers on the QuotedData website.
FGEN has one of the broadest remits of the 18 companies that comprise the members of the AIC’s renewable energy sector. Most of these funds are focused on solar or wind or some combination of the two. Two of these funds are focused solely on energy storage. There is variation of geographic exposure within the peer group too, with a number of funds that are heavily exposed to the North American market (which has a different risk/reward structure).
The sector has been shrinking over the past six months through a combination of private acquisitions (taking advantage of the wide discounts in the sector) or through managed wind-downs (orderly liquidations of portfolios and returns to shareholders). We have lost three trusts since our last note, with Atrato Onsite Energy and Harmony Energy Income taken private (the latter by funds of Foresight), and Triple Point Energy Transition completing its managed wind-down earlier this year. Meanwhile, two further trusts are likely shortly to exit the sector, with Downing Renewables & Infrastructure recommending an offer for the company and Aquila Energy Efficiency in a managed wind-down.
Figure 13: AIC renewable energy infrastructure sector comparison table, as at 18 July 2025
| Market cap (£m) | Premium/(discount) (%) | Yield(%) | Ongoing charge (%) | |
|---|---|---|---|---|
| FGEN | 512 | (23.7) | 9.6 | 1.24 |
| Aquila Energy Efficiency | 27 | (30.8) | 0.0 | 3.80 |
| Aquila European Renewables Income | 201 | (27.4) | 8.4 | 1.10 |
| Bluefield Solar Income | 569 | (22.1) | 9.3 | 1.02 |
| Downing Renewables & Infrastructure | 173 | (13.0) | 5.9 | 1.50 |
| Ecofin US Renewables Infrastructure | 26 | (44.1) | 2.3 | 2.30 |
| Foresight Solar | 508 | (17.9) | 8.9 | 1.17 |
| Gore Street Energy Storage Fund | 305 | (41.4) | 11.6 | 1.42 |
| Greencoat Renewables | 756 | (25.4) | 8.6 | 1.18 |
| Greencoat UK Wind | 2,793 | (16.3) | 8.2 | 0.95 |
| Gresham House Energy Storage | 454 | (28.2) | 6.9 | 1.29 |
| HydrogenOne Capital Growth | 36 | (69.0) | 0.0 | 2.53 |
| NextEnergy Solar | 430 | (21.6) | 11.3 | 1.11 |
| Octopus Renewables Infrastructure | 398 | (27.9) | 8.4 | 1.21 |
| Renewables Infrastructure Group | 619 | (37.3) | 11.1 | 1.02 |
| SDCL Energy Efficiency Income | 2163 | (20.6) | 8.3 | 1.04 |
| US Solar Fund | 91 | (37.9) | 8.8 | 1.54 |
| VH Global Sustainable Energy Opportunities | 284 | (30.7) | 8.1 | 1.50 |
| Peer group median | 414 | (27.6) | 8.4 | 1.23 |
| FGEN rank | 6/18 | 7/18 | 4/18 | 10/18 |
FGEN is one of the larger funds within this peer group, while its discount to NAV is middle of the pack. Wide discounts have distorted yields across the sector. Nevertheless, FGEN’s dividend yield is highly attractive, with coverage of 1.32x. Its ongoing charges ratio ranks middle of the pack, but is expected to fall when the impact of a reduction in the management fee is felt going forward (details of which can be found on page 24).
Figure 14: AIC renewable energy infrastructure sector NAV total return performance comparison table, periods ending 30 June 2025
| 3 months(%) | 6 months(%) | 1 year(%) | 3 years(%) | 5 years(%) | 10 years(%) | |
|---|---|---|---|---|---|---|
| FGEN | 1.8 | 2.8 | 1.0 | 4.8 | 57.6 | 105.0 |
| Aquila Energy Efficiency | 0.0 | 0.0 | (4.2) | (3.6) | n/a | n/a |
| Aquila European Renewables Income | 3.9 | 5.2 | 1.2 | (7.0) | 3.7 | n/a |
| Bluefield Solar Income | 1.8 | 1.1 | 1.6 | 6.3 | 46.2 | 132.3 |
| Downing Renewables & Infrastructure | 1.3 | 2.6 | 4.0 | 15.7 | n/a | n/a |
| Ecofin US Renewables Infrastructure | (5.8) | (8.6) | (35.9) | (55.4) | n/a | n/a |
| Foresight Solar | 1.8 | 2.4 | 3.7 | 8.6 | 61.0 | 109.7 |
| Gore Street Energy Storage Fund | 1.7 | 4.9 | 3.6 | 13.3 | 47.2 | n/a |
| Greencoat Renewables | 4.0 | 1.6 | 0.7 | 14.8 | 32.2 | n/a |
| Greencoat UK Wind | 1.7 | 2.6 | 0.5 | 16.7 | 67.1 | 158.6 |
| Gresham House Energy Storage | 1.2 | 1.3 | 1.5 | (18.0) | 37.9 | n/a |
| HydrogenOne Capital Growth | 0.0 | (1.2) | (13.8) | (7.8) | n/a | n/a |
| NextEnergy Solar | 2.1 | 1.9 | 2.2 | (2.1) | 39.2 | 84.7 |
| Octopus Renewables Infrastructure | 1.5 | 2.0 | 2.5 | 7.6 | 34.9 | n/a |
| Renewables Infrastructure Group | 1.6 | 0.3 | (2.9) | (0.5) | 32.9 | 103.3 |
| SDCL Energy Efficiency Income | 1.7 | 3.5 | 7.3 | 1.4 | 24.3 | n/a |
| US Solar Fund | (4.5) | (5.9) | (18.4) | (31.1) | (23.9) | n/a |
| VH Glob Sustainable Energy Opps | 1.4 | 2.9 | (1.7) | 6.2 | n/a | n/a |
| Peer group median | 1.6 | 1.9 | 1.1 | 3.1 | 37.9 | 107.4 |
| FGEN rank | 4/18 | 5/18 | 10/18 | 9/18 | 3/13 | 4/6 |
Dividend
FGEN has a progressive dividend policy (a policy of increasing dividends each year). For the accounting year ended 31 March 2025, the company declared a dividend of 7.80p (up 3.0% from 7.57p in 2024), which was 1.32x covered by net cash flows from the portfolio. The board said that it was targeting a total dividend of 7.96p for the 2026 financial year, representing a 2.1% increase, and expects this will be comfortably covered by cash flows.
Figure 15: FGEN five-year dividend history, pence per share
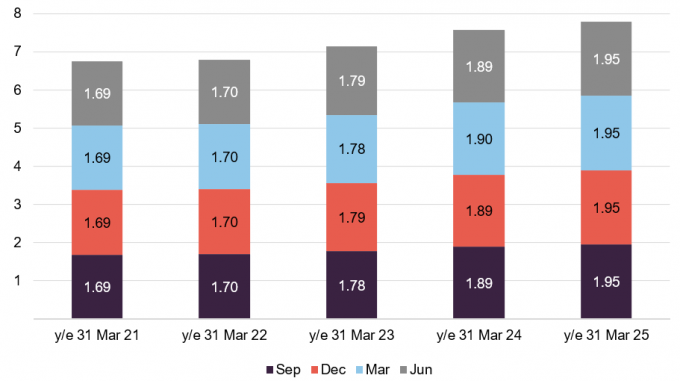
Source: FGEN, Marten & Co. Note: financial years to 31 March.
Premium/(discount)
Figure 16: FGEN premium/(discount) (%) over five years to 30 June 2025
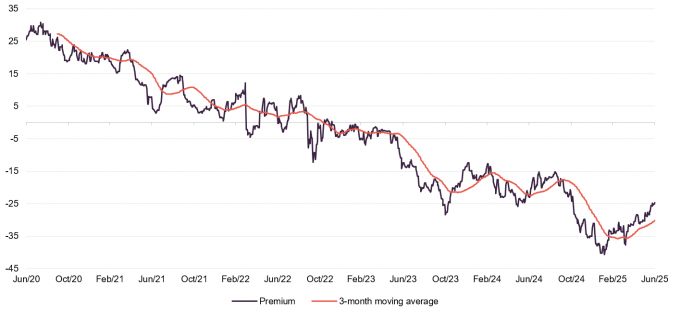
Source: Morningstar, Marten & Co
FGEN’s discount to NAV widened substantially from October 2024 as a higher-for-longer interest rate narrative grew in the UK following the budget and the announcement that HH2E had fallen into administration. FGEN’s discount has been narrowing since February, however. Over the year to 30 June 2025, FGEN’s shares traded in range of a 15.1% and a 40.6% discount to NAV, and averaged a discount of 27.7%. FGEN’s discount at 17 July 2025 was narrower than its 12-month average at 23.7%. Despite a challenging two years, we believe the current discount represents great value, especially given FGEN’s proven income profile and the capital growth opportunities that exist from its medium-term disposal pipeline.
As per FGEN’s discount management policies, which states that a discontinuation vote is put to shareholders if the shares trade at an average discount in excess of 10% for any financial year, a discontinuation vote will be held at the AGM in September 2025. This was the case last year too and was overwhelmingly voted down by shareholders. The board has said that it is confident of the same outcome this time, due to macroeconomic factors effecting the entire renewables sector, the tighter rating of FGEN relative to peers, and interactions held with shareholders.
The company announced a £20m buyback programme in August 2024 and extended this in March 2025 to £30m. As at 17 July 2025, the company has repurchased almost 33m shares for almost £25.8m at an average price of 78.5p.
Fees and costs
FGEN’s ongoing charges ratio for the year ended 31 March 2025 was 1.24%, the same as the prior year.
The investment manager is currently entitled to a base fee of 0.95% on the first £500m of NAV; 0.8% on NAV between £500m to £1bn; and 0.75% on NAV over £1bn. There is no performance fee and the manager’s contract can be terminated on one year’s notice.
The company has proposed that from 1 October 2025, the investment management fee will be calculated 50% based on NAV and 50% on market capitalisation (capped at NAV).
For the year ended 31 March 2025, directors’ fees and expenses totalled £327,000 and the administration fee was about £124,000.
Capital structure
FGEN has 628,659,783 ordinary shares in issue and 32,871,446 shares held in treasury, as at 17 July 2025.
FGEN has an indefinite life, but a discontinuation vote may be triggered if its shares trade at a discount in excess of 10% for a prolonged period (which was the case in the financial years 2024 and 2025). The company’s financial year end is 31 March and AGMs are typically held in August or September.
Gearing
In April 2025, FGEN reduced the size of its multi-currency RCF from £200m to £150m. The company estimates that the downsizing will result in an annual cost saving of £367,500. At 31 March 2025, £99.3m was drawn, providing capital to cover outstanding portfolio commitments, including the remaining payments for construction stage investments.
The RCF – which is provided by National Australia Bank, Royal Bank of Scotland International, ING, HSBC, and Clydesdale Bank – matures in June 2027, with an uncommitted option to extend for a further year.
The loan bears interest of SONIA (for sterling drawdowns) and EURIBOR (for euro drawdowns) +210bps (basis points – equivalent to 2.1%). The RCF qualifies as a Sustainability Linked Loan, with interest rates linked to meeting certain agreed sustainability goals. FGEN’s interest rate will rise or fall 5bps (0.05%) based on performance against these ESG targets:
- Environmental: increase coverage of independent biodiversity assessments and implement initiatives to enhance biodiversity net gain across the portfolio;
- Social: increased volume of contributions to local communities; and
- Governance: maintaining a low number of work-related accidents, as defined under the Reporting of Injuries, Diseases and Dangerous Occurrences (RIDDORS) by the Health and Safety Executive.
At the project level, FGEN is constrained to a maximum of 65% gearing on gross project value for renewable energy generation projects and a maximum of 85% gearing on gross project value for PFI/PPP (Private Finance Initiative/ Public-Private Partnership) type projects. In practice, actual project gearing is much lower than this.
FGEN is permitted to borrow up to 30% of its NAV for short-term debt financing, such as the RCF. The gearing ratio was 28.7% at 31 March 2025.
Major shareholders
FGEN’s largest shareholders at 31 March 2025 were Gravis Capital Management (6.98%), Hargreaves Lansdown (6.74%), and Evelyn Partners (4.99%).
Lead managers
Chris Tanner
Chris has been an investment manager to FGEN since IPO in 2014. He joined Foresight in 2019 as a partner and has over 25 years of industry experience. Chris is a member of the Institute of Chartered Accountants in England and Wales and has an MA in Politics, Philosophy and Economics from Oxford University. Chris also serves as chair of the Finance Forum for The Association of Renewable Energy and Clean Technology (REA).
Edward Mountney
Edward has been a part of FGEN since 2016 and joined the senior management team in 2022. Before this, he served as head of valuations at Foresight Group and John Laing Capital Management. With over 15 years of experience in infrastructure and renewables, Edward is a member of the Institute of Chartered Accountants in England and Wales. He holds a BA (Hons) in Business and Management from Oxford Brookes University.
Charlie Wright
Charlie joined Foresight Group in 2017 and recently joining FGEN’s senior management team. He has over 18 years of experience in infrastructure and renewables as an adviser, equity investor and project director, and has overseen a wide range of investments across Europe. He was previously at John Laing Group and KPMG. Charlie holds a BA in History from Exeter University and an ICAEW & CISI Diploma in Corporate Finance.
Board
FGEN’s board is currently composed of five directors, all of whom are non-executive and considered to be independent of the investment manager.
Figure 17: Board member – length of service and shareholdings
| Director | Position | Date of appointment | Length of service (years) | Annual fee (GBP) | Shareholding |
|---|---|---|---|---|---|
| Ed Warner | Chair | 2 August 2022 | 2.9 | 81,500 | 75,000 |
| Stephanie Coxon | Audit committee chair | 11 June 2020 | 5.0 | 62,500 | 45,000 |
| Alan Bates | Risk committee chair | 10 June 2021 | 4.0 | 53,000 | 25,000 |
| Jo Harrison | ESG committee chair | 10 June 2021 | 4.0 | 53,000 | 8,066 |
| Nadia Sood | Director | 10 February 2023 | 2.4 | 50,500 | – |
Ed Warner
Ed gained extensive financial services experience from senior positions held at several investment banks and financial institutions, including IFX Group, Old Mutual, NatWest Markets and Dresdner Kleinwort Benson. He also has considerable investment trust experience, having been chair of both Standard Life Private Equity Trust Plc and BlackRock Energy and Resources Income Trust Plc. He is currently chair of HarbourVest Global Private Equity. Ed has also previously served as chair of Air Partner Plc and non-executive director and interim chair of Clarkson Plc.
Stephanie Coxon
Stephanie is a fellow of the Institute of Chartered Accountants in England and Wales and is currently a non-executive director of several London listed companies. Prior to her non-executive director career, she led the investment trust capital markets team at PwC for the UK and Channel Islands. During her time at PwC, Stephanie specialised in advising FTSE 250 and premium London listed companies on accounting, corporate governance, risk management and strategic matters.
Alan Bates
Alan has over 33 years’ experience in the energy and infrastructure sectors, including electricity, gas and water utilities. He has developed a broad understanding of the dynamics behind the energy transition and has assisted the government of Guernsey in developing its energy policy. Alan started his career with P&O and Princess Cruises as a Marine Egineering Officer, followed by 19 years in the oil and gas industry working for Mobil Oil/BP Oil and then International Energy Group before becoming the managing director of Manx Gas in the Isle of Man. Alan is the CEO of Guernsey Electricity and is a director of the Channel Islands Electricity Grid and Alderney Electricity Limited. Alan is a Chartered Engineer, Fellow of the Institute of Mechanical Engineers and a Member of the Institute of Engineering Technology.
Jo Harrison
Jo has over 25 years’ experience working in the water industry and is the director of strategic planning & sustainability at United Utilities, where she is accountable for leading the approach to environmental and long‑term planning, including developing and strengthening the approach to all aspects of the environment, climate change and carbon, asset strategy, risk and resilience. Jo is a chartered member of the Institute of Water and Environmental Managers and is a Chartered Environmentalist. She is also a trustee of the Rivers Trust.
Nadia Sood
Nadia has extensive experience of executing, managing and overseeing complex infrastructure investments. She has run large renewable energy infrastructure investment portfolios worth billions of dollars in multiple countries and served as a director on the board of more than 20 prominent privately owned companies. Nadia is currently CEO of CreditEnable, a global credit insights and technology solutions company, and a member of the IFC/World Bank SME Finance Forum. Nadia holds a Bachelor of Science in Foreign Service from the Edmund A. Walsh School of Foreign Service at Georgetown University in Washington D.C., and a Masters in International Affairs from Columbia University, New York. She is fluent in English, French and Norwegian.
SWOT analysis and bull vs bear case
Figure 18: SWOT analysis for FGEN
| Strengths | Weaknesses |
|---|---|
| Core portfolio producing record cash distributions. | FGEN sensitive to market sentiment and interest rate volatility. |
| Increased dividends every year since inception in 2014, with comfortable coverage by income. | |
| Opportunities | Threats |
| Further structural increase in renewable energy demand to meet net zero ambitions. | Potential discount widening, in response to poor performance and/or poorer sentiment towards renewable energy infrastructure sector. |
| Shares trade at 25%+ discount to NAV which could narrow if sentiment improves and/or interest rates reduce. |
Figure 19: Bull vs bear case for FGEN
| Aspect | Bull case | Bear case |
|---|---|---|
| Performance | Capital appreciation of growth assets as operations ramp up. Sales at substantial premiums to current values. Core portfolio continues to produce record cash flows. | Growth assets take longer than anticipated to become fully operational. Energy prices dive, impacting income streams. |
| Dividends | Strong track record of increases, which the board are committed to continuing. | Increases potentially not sustainable if conditions change. |
| Outlook | Structural increase in renewable energy demand looks set to continue. | Any global slowdown puts pressure on politicians to scale back climate commitments, to the detriment of the renewables sector. |
| Discount | FGEN trades at a wide discount which could narrow as inflation and interest rates subside and sentiment towards the sector turns positive. | The discount could widen further due to higher interest rates or any newsflow perceived as negative for the underlying assets. |
Previous publications
You can read our previous notes on FGEN by clicking on them in Figure 20 below or by visiting our website.
| Title | Note type | Date |
|---|---|---|
| Diverse renewables exposure | Initiation | 6 September 2017 |
| Anaerobic diversification | Update | 6 March 2018 |
| Diversification benefits shine through | Annual overview | 12 September 2018 |
| Life extensions to boost NAV? | Update | 15 March 2019 |
| Battery storage potential | Annual overview | 9 September 2019 |
| Reliable source of income | Update | 14 May 2020 |
| Increasingly diversified as green-led recovery looms | Annual overview | 16 February 2021 |
| On the front foot | Update | 4 August 2021 |
| It’s all about renewables | Annual overview | 29 March 2022 |
| Further portfolio diversification | Update | 29 September 2022 |
| Laying the foundations for NAV growth | Annual overview | 31 March 2023 |
| Backing the green hydrogen revolution | Update | 28 November 2023 |
| Vote against discontinuation | Annual overview | 17 July 2024 |
| Looking to bounce back | Update | 3 December 2024 |
IMPORTANT INFORMATION
Marten & Co (which is authorised and regulated by the Financial Conduct Authority) was paid to produce this note on Foresight Environmental Infrastructure Plc.
This note is for information purposes only and is not intended to encourage the reader to deal in the security or securities mentioned within it. Marten & Co is not authorised to give advice to retail clients. The research does not have regard to the specific investment objectives financial situation and needs of any specific person who may receive it.
The analysts who prepared this note are not constrained from dealing ahead of it but, in practice, and in accordance with our internal code of good conduct, will refrain from doing so for the period from which they first obtained the information necessary to prepare the note until one month after the note’s publication. Nevertheless, they may have an interest in any of the securities mentioned within this note.
This note has been compiled from publicly available information. This note is not directed at any person in any jurisdiction where (by reason of that person’s nationality, residence or otherwise) the publication or availability of this note is prohibited.
Accuracy of Content: Whilst Marten & Co uses reasonable efforts to obtain information from sources which we believe to be reliable and to ensure that the information in this note is up to date and accurate, we make no representation or warranty that the information contained in this note is accurate, reliable or complete. The information contained in this note is provided by Marten & Co for personal use and information purposes generally. You are solely liable for any use you may make of this information. The information is inherently subject to change without notice and may become outdated. You, therefore, should verify any information obtained from this note before you use it.
No Advice: Nothing contained in this note constitutes or should be construed to constitute investment, legal, tax or other advice.
No Representation or Warranty: No representation, warranty or guarantee of any kind, express or implied is given by Marten & Co in respect of any information contained on this note.
Exclusion of Liability: To the fullest extent allowed by law, Marten & Co shall not be liable for any direct or indirect losses, damages, costs or expenses incurred or suffered by you arising out or in connection with the access to, use of or reliance on any information contained on this note. In no circumstance shall Marten & Co and its employees have any liability for consequential or special damages.
Governing Law and Jurisdiction: These terms and conditions and all matters connected with them, are governed by the laws of England and Wales and shall be subject to the exclusive jurisdiction of the English courts. If you access this note from outside the UK, you are responsible for ensuring compliance with any local laws relating to access.
No information contained in this note shall form the basis of, or be relied upon in connection with, any offer or commitment whatsoever in any jurisdiction.
Investment Performance Information: Please remember that past performance is not necessarily a guide to the future and that the value of shares and the income from them can go down as well as up. Exchange rates may also cause the value of underlying overseas investments to go down as well as up. Marten & Co may write on companies that use gearing in a number of forms that can increase volatility and, in some cases, to a complete loss of an investment.