Consolidate and capitalise
For most of 2024, financial conditions had finally started to turn favourably for infrastructure investors. Inflation had dropped sharply from the previous year, allowing the Bank of England to begin its interest rate cutting cycle, while the new government’s ambitious plans for infrastructure development provided a renewed sense of optimism across the sector. These green shoots were evidenced by GCP’s annual results, which showed a total shareholder return of 28.4%, leading to a significant narrowing of its stubborn discount to net asset value (NAV). Unfortunately, a negative reaction to the UK budget, and concerns around the inflationary impact of US tariffs, saw the yield on UK gilts retrace their highs, erasing some of these gains.
Despite this, we remain increasingly optimistic about GCP’s prospects as it continues to execute on its capital recycling programme (see page 8). Coupled with improving market conditions, an impressive policy backdrop, and its long track record of capitalising on changing market dynamics, we believe there is a considerable opportunity for investors at current prices.
Public-sector-backed, long-term cashflows
GCP aims to provide shareholders with sustained, long-term distributions and to preserve capital by generating exposure primarily to UK infrastructure debt or similar assets with predictable long-term cashflows.
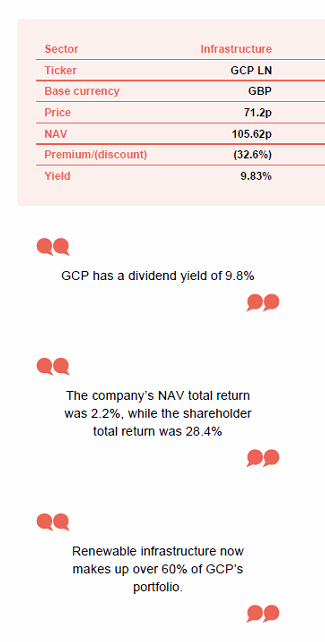
At a glance
Share price and discount
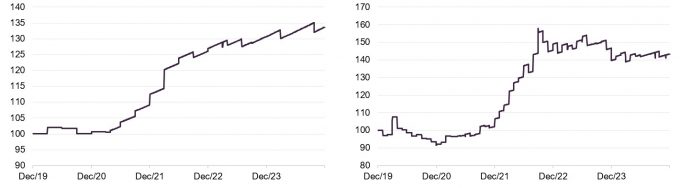
Over the past 12 months, GCP’s shares have traded on an average discount to NAV of 30.2%, a high of 22.2%, and a low of 37.2%. As of publishing, the discount stood at 32.6%. This narrowed considerably over the first half of 2024 as markets reacted to the expectation of lower interest rates. Unfortunately, conditions have steadily tightened in recent months, which has weighed on GCP’s shares.
Time period 31 December 2019 to 20 January 2025
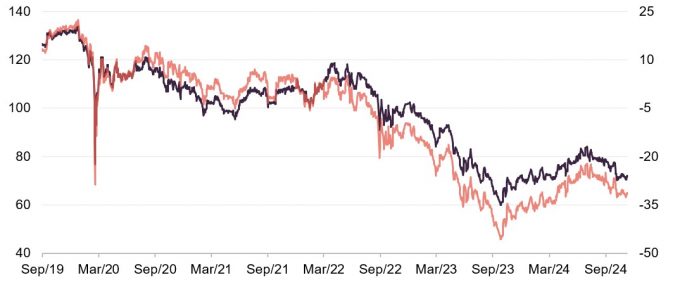
Source: Morningstar, Marten & Co
Performance over five years
Despite less-favourable market conditions over the last few years, GCP has still managed to deliver a NAV total return of 33.6% since 2019. This supports our view that the market reaction, which has seen shares fall by 22% over the same period, is in no way a fair reflection of the quality of the company’s underlying assets.
Time period 31 December 2019 to 31 December 2024
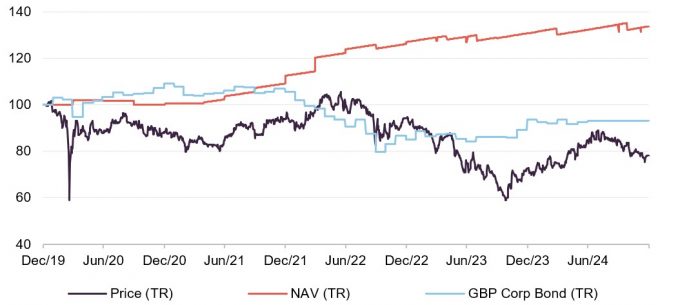
Source: Morningstar, Marten & Co
| Year ended | Share price total return (%) | NAV total return (%) | Earnings1per share (pence) | Adjusted2 EPS (pence) | Dividend per share (pence) |
|---|---|---|---|---|---|
| 30/09/2020 | (2.0) | (0.22) | (0.08) | 7.65 | 7.6 |
| 30/09//2021 | (7.9) | 7.2 | 7.08 | 7.90 | 7.0 |
| 30/09/2022 | 3.8 | 15.7 | 15.88 | 8.30 | 7.0 |
| 30/09/2023 | (25.2) | 3.6 | 3.50 | 8.58 | 7.0 |
| 30/09/2024 | 28.2 | 4.6 | 2.25 | 7.09 | 7.0 |
Company profile
Regular, sustainable, long-term income
GCP Infrastructure Investments Limited (GCP) is a Jersey-incorporated, closed-ended investment company whose shares are traded on the main market of the London Stock Exchange. GCP aims to generate a regular, sustainable, long-term income while preserving investors’ capital. The company’s income is derived from loaning money predominantly at fixed interest rates to entities which derive their revenue – or a substantial portion of it – from UK public-sector-backed cashflows. Wherever it can, it tries to secure an element of inflation protection.
In practice, GCP is diversified across a range of different infrastructure sectors, although its focus has shifted more towards renewable energy infrastructure over the last few years. It has exposure to renewable energy projects (where revenue is part subsidy and part linked to sales of power), PFI/PPP-type assets (whose revenue is predominantly based on the availability of the asset), and specialist supported social housing (where local authorities are renting specially-adapted residential accommodation for tenants with special needs).
Annual results
GCP is trading dividend yield of 9.8%
On 12 December 2024, GCP published its annual results for the period to 30 September 2024. The company’s NAV total return was 2.2%, while the shareholder total return was 28.4% with the discount to NAV narrowing significantly to 25%, although this has since widened to 32.6% at the time of publication. Whilst GCP does not compare its returns with those of a benchmark index, the sterling corporate bond index is a useful comparison, and this returned 10.7% over the same period.
Dividends continued to run at an annualised pace of 7.0p per share, so that GCP is trading on a dividend yield of 9.8%. On the company’s adjusted earnings basis, calculated on interest accruals, dividend cover was 1.01 times (down from 1.23x at the end of the 30 September 2023). On a cash cover basis, this ratio is much higher. Profit was £19.5m (down from £30.9m). As we have covered in our previous research, the company’s financial performance continues to be driven by electricity prices and inflation, both of which have normalised from elevated levels, leading to a negative impact on profitability.
The company’s NAV total return was 2.2%, while the shareholder total return was 28.4%
Despite this, the company was still able to deliver a positive NAV total return for the year, while the 28% total shareholder return reflected the steadily improving market conditions and the ongoing implementation of the company’s capital recycling programme (see page 8), which has remained the key focus for the manager over the past 12 months.
It should be noted that the shareholder return did benefit from timing factors, and some of these gains have been given back as economic uncertainty remains elevated. However, as we discuss in the market backdrop section, we remain increasingly positive on the outlook for the sector and the ability for GCP to capitalise on the growing investment opportunity, considering the significant structural changes occurring across the infrastructure sector.
Attribution and performance
Figure 1: Positive factors affecting FY2024 performance
| Impact (£m) | Impact (pence) | |
|---|---|---|
| Tax computations | 1.1 | 0.13 |
| Principal indexation | 0.8 | 0.09 |
| Other inflationary movements | 3.2 | 0.37 |
| Total | 5.1 | 0.59 |
As Figure 1 shows, positive contributions to NAV for the 2024 financial year were limited to tax computations and inflationary mechanics across the portfolio thanks to the company’s inflation linkages and protections. The otherwise-limited portfolio activity reflects the adviser’s focus on consolidation and its capital recycling policy as the company seeks to reposition itself for further growth.
Figure 2: Negative factors affecting FY2024 performance
| Impact (£m) | Impact (pence) | |
|---|---|---|
| Power price movements | (13.7) | (1.58) |
| Increase in discount rates | (10.6) | (1.22) |
| Energy yield assessment | (7.8) | (0.90) |
| Project long-term budget | (5.6) | (0.65) |
| Inflation forecast | (3.4) | (0.39) |
| Onshore wind asset outage | (2.0) | (0.23) |
| Actual performance | (3.0) | (0.35) |
| Other downward movements | (3.2) | (0.37) |
| Total | (49.3) | (5.69) |
Faling electricity prices had the largest impact on the downside
Falling electricity prices had the largest negative impact, although the vast majority of these occurred in the first half of the company’s financial year. As we have discussed in our previous research, it is important to note that the UK energy market is emerging from several years of unusually high volatility and prices remain well above historical averages. Over the last 24 months, this has provided strong cash flow generation for the GCP portfolio. More recently, prices in the UK have shown signs of stabilisation.
Notably, one of the main goals for the company’s current portfolio development is to reduce exposure to electricity price volatility, as evidenced by the recent sale of GCP’s interest in Blackcraig Wind Farm (discussed on page 7). In addition, where possible, the company continues to fix prices under power purchase agreements and hedge electricity prices.
Increases to discount rates have also weighed on the NAV, as have inflation adjustments, with inflation falling steadily over the course of 2024. Whilst inflation has not impacted operational performance, lower inflation projections have reduced the cash expected to be generated by the company’s loans and therefore the associated valuation has been reduced.
Market backdrop
Higher interest rates have weighed heavily on the infrastructure sector
We have written frequently about the challenges faced by the infrastructure sector in recent years, driven mostly by the rise in interest rates that has greatly increased the relative attractiveness of more traditional income sectors, particularly low-risk corporate and government debt.
As evidenced in the company’s 2024 performance, valuations have fallen due to rising discount rates, while the increase in financing costs has weighed on the sectors’ appeal, especially for those companies relying on leverage (borrowing) to help drive capital deployment programmes. Despite this, we believe the extent and duration of the current sell-off goes well past the mechanical impact of these events, highlighted by valuations which have fallen below levels seen during the worst of the global financial crisis. This is especially true for GCP, which has maintained conservative leverage and continues to generate strong earnings thanks to its focus on diverse, long-term, public-sector-backed investments; inflation linkages; and regulated and contracted cashflows. For comparison, back in 2010, when yields were at a similar level to where they are today, GCP traded on a premium to NAV of almost 10% despite having a less diversified portfolio, and greater exposure to construction stage projects (which are inherently riskier than assets that are already operational). As of publishing, its discount was 32.6%, a change of over 40 percentage points, which is clearly not a fair reflection of the quality of the company’s underlying assets.
The renewable infrastructure sector which now makes up over 60% of GCP’s portfolio.
We believe the entire sector has been tarred by the poor performance of a relatively small number of operators whose business models have proven to be untenable in the current market environment. There also appears to be a broader lack of understanding around these assets and the quality and reliability of the investments that have enabled dividend yields to head towards 10%. Positively, given the wealth of structural growth opportunities which exist across the sector, these depressed valuations do provide a compelling opportunity for companies such as GCP with the scale and flexibility to consolidate and capitalise.
Manager Philip Kent points to the company’s long-term track record of performance across various periods of contraction and expansion as a reason for optimism going forward. A focus on diversification across the infrastructure spectrum has allowed it to adapt to developments in any one sector (such as decreasing yields and more competition) and move into other areas if a sector no longer represents attractive risk-adjusted returns. This has been evidenced in recent years, with the company working through the divestment of its maturing supported living assets while shifting exposure into the renewable infrastructure sector, which now makes up over 60% of GCP’s portfolio. With multiple factors now driving infrastructure investment, including infrastructure deployment to address population change; decarbonisation; and energy security, there exists a wealth of opportunities to shift into higher-yielding and more-attractive sectors of the market.
Improving outlook
In our previous research we highlighted how the adviser believes that there is a significant disconnect between the government’s stated aims for infrastructure investment and what is actually being built. This has only become more compelling following the policy initiatives announced by the new Labour government.
These included a range of measures to speed up infrastructure development including changes to the National Planning Policy Framework and the formation of the National Infrastructure and Service Transformation Authority to better support the delivery of significant capital projects. In addition to housing and energy security, the renewable energy sector was a key area of focus as the government attempts to deliver its ambitious goal of fully decarbonising the electricity system by 2030.
We expect the steady normalisation of interest rates to provide a catalyst.
GCP appears to be increasingly well positioned to capitalise on these developments thanks to its flexible, debt-focused funding approach. The company’s track record of being an early mover appears especially well matched with regard to new subsidy regimes for emerging technologies. These include net zero (green) hydrogen, carbon capture, and the expansion of existing market support measures (such as the contract for difference scheme), which offer an attractive opportunity for GCP to play a key role in the scaling-up and deployment of new infrastructure.
Interest rates
The steady normalisation of interest rates ought to be providing another catalyst. With inflation falling back to target, the Bank of England (BOE) has now begun to ease monetary policy, announcing two 25-basis-point rate cuts in 2024, dropping the bank rate to 4.75%. These announcements helped drive a solid re-rating for many of the better-performing infrastructure companies, including GCP, over the first half of 2024.
Unfortunately, it has not all been one-way traffic, with concerns around the inflationary impact of the budget and the potential knock-on effects from US policy uncertainty (particularly around import taxes) leading to a repricing in the number of rate cuts expected for 2025 and rising government bond yields. As shown in Figure 3, we are now expecting between two and three cuts over the next 12 months, for an implied rate around 4%. Although this is still a significant shift down from the peak of 5.25%, only a few months ago markets were anticipating up to five rate cuts over this period. As we discuss in the discount section on page 19, this has led to a repricing of some rate-sensitive sectors of the market after a period of optimism earlier in the year.
Despite this, the BoE remains committed to easing monetary policy and as interest rates fall, we expect capital to flow back towards alternative investments, especially given the attractive yields on offer, highlighted by GCP’s current dividend yield of 9.8%.
Figure 3: Implied UK overnight rate & number of cuts

Source: Bloomberg
Cost disclosures
The entire investment trust sector should also benefit from long-overdue cost disclosure reforms (which you can read about here.). On 22 November 2024, a Statutory Instrument came into law to remove the requirement for investment companies to publish ongoing charges, a figure widely accepted to be an inaccurate representation of the actual cost of investing in the sector.
On 22 November 2024, a Statutory Instrument came into law to remove the requirement for investment companies to publish ongoing charges
Although this is a no doubt a positive development, since the announcement there has continued to be confusion, with some investment platforms still requiring ongoing charges to be disclosed. The reforms have not been helped by a recently published consultation paper by the FCA on its proposed consumer composite investments regulation. Some have interpreted this as an intention to reinstate a single aggregated cost figure for trusts, without acknowledging that costs are already reflected in share prices. Unfortunately, the consultation will not close until March 2025, and implementation of any new rules might not be until the end of the year, suggesting that the row will drag on for a while yet.
Capital recycling
In December 2023, GCP announced a plan to release £150m (roughly 15% of the portfolio) to facilitate a rebalance of sector exposures, apply funds towards a material reduction in the revolving credit facility (RCF), and return at least £50m in capital to shareholders. It was initially hoped that this would be completed by the end of 2024; however, consistent delays throughout the year have meant the target completion date has been shifted to the first half of 2025. This delay is tempered by the expectation that realisations will now comfortably exceed the initial target.
To date, the company’s disposals total £38.2m, the bulk of which was achieved via the sale of GCP’s interest in loan notes secured against Blackcraig Wind Farm. The disposal occurred at a 6.4% premium to the valuation of the project as at 31 March 2024, generating net cash proceeds of c.£31m while reducing GCP’s exposure to power prices and equity-like investments (which now sit at just 6% of the portfolio). Importantly, the sale also provided further validation of the company’s underlying NAV. A portfolio of rooftop solar assets has also been realised, generating proceeds of £6.8m. Subject to contract, further proceeds of c.£20m are expected from the disposal of a portfolio of onshore wind farms.
To date, the company’s disposal’s total £38.2m
With the proceeds of Blackcraig now available to it, GCP has been buying back shares steadily since 12 December 2024.
Debt reduction
Although the initial stages of this capital programme have taken longer than originally hoped, the company has made material progress in its stated aims of reducing the outstanding RCF, which was identified as a priority given the high-interest-rate environment. In March 2024, the RCF was refinanced from £190m to £150m with the drawn balance of this facility reduced significantly from £104m at 30 September 2023 to £57m. As further disposals are completed, the company expects this balance to be reduced to zero.
Over the 2024 financial year, the company also completed the repurchase of 3.4m shares under its existing buyback facility. The repurchase of shares continues to offer attractive returns, given the current discount to NAV, while helping to address any imbalance in supply and demand that may otherwise create volatility in the rating of the company’s shares. This remains a delicate balance, however, with the adviser remaining conscious that further buybacks may do little to move the discount and would reduce the size of the trust – decreasing liquidity and perhaps deterring some of its target investors.
Portfolio
As of 30 September 2024, there were 50 investments in GCP’s portfolio (including the rooftop solar portfolio discussed above, with the sale occurring after the financial year end). The average annualised portfolio yield over the financial year was 7.8%, and the portfolio had a weighted average life of 11 years.
Figure 4: Split of the portfolio at 30 September 2024

Source: GCP Infrastructure Investments
No new investments were made over the financial year, with the adviser focusing instead on its capital recycling programme (see page 8).
Figure 5: Sector allocation at 30 September 2024
Figure 6: Security allocation at 30 September 2024

Source: GCP Infrastructure Investments
Source: GCP Infrastructure Investments
As noted, the adviser views renewable energy infrastructure as a key area of focus and going forward. The rebalancing of the portfolio through the capital reallocation policy is targeting a reduction in social housing and equity-like exposures, which now sit at just 6%.
Figure 7: GCP sources of income as at 30 September 2024

Source: GCP Infrastructure Investments. Note 1) does not include the sale of the rooftop solar portfolio which occurred post period end.
Top 10 investments
Figure 8: GCP’s 10 largest investments as at 30 September 2024
| % of total assets 30/07/24 | Cashflow type | Project type | |
|---|---|---|---|
| Cardale PFI | 12.7 | Unitary charge | PFI/PPP |
| Gravis Solar 1 | 9.7 | ROC/FiT | Commercial solar |
| GCP Programme Funding S14 | 5.4 | ROC/RHI/Merchant | Biomass |
| GCP Programme Funding S3 | 4.4 | ROC/PPA | Anaerobic Digestion |
| GCP Programme Funding S10 | 4.5 | Lease | Supported Living |
| GCP Bridge Holdings | 5.0 | ROC/PPA | PPE – Energy-from-waste / Energy efficiency |
| Gravis Asset Holdings H | 4.4 | ROC/RHI | Onshore wind |
| GCP Biomass 2 | 4.1 | ROC/PPA | Biomass |
| GCP Social Housing 1 B | 3.8 | Lease | Supported living |
| GCP Green Energy 1 | 3.7 | ROC/PPA | Commercial solar/onshore wind |
Figure 9: Top 10 revenue counterparties
| Firm | % of total portfolio |
|---|---|
| Ecotricity Limited | 9.2 |
| Viridian Energy Supply | 7.8 |
| Office of Gas and Electricity Markets | 6.4 |
| Npower Limited | 6.3 |
| Statkraft Markets GmbH | 5.9 |
| Bespoke Supportive Tenancies Limited | 4.6 |
| Smartestenergy Limited | 4.5 |
| Total Gas & Energy Limited | 4.4 |
| Good Energy Limited | 4.4 |
| Gloucestershire County Council | 4.1 |
Figure 10: Top 10 project service providers
| Firm | % of total portfolio |
|---|---|
| WPO UK Services Limited | 21.0 |
| PSH Operations Limited | 13.0 |
| Vestas Celtic Wind Technology Limited | 11.3 |
| Solar Maintenance Services Limited | 9.7 |
| A Shade Greener Maintenance | 8.7 |
| 2G Energy Limited | 5.9 |
| Pentair | 4.6 |
| Atlantic Biogas Ltd | 4.6 |
| Thyson | 4.6 |
| Cobalt Energy Limited | 4.1 |
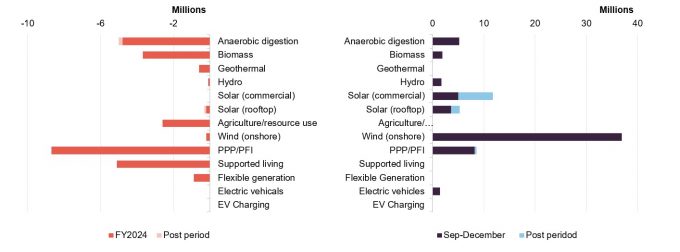
Recent investment activity
Although there were no new investments made over GCP’s 2024 financial year, the company did make one new loan to an existing borrower, totalling £2.6m. Follow-on investments of £24.7m were also made, with these focused on restructuring and management to preserve value and potential future profitability. This was offset by repayments of £39.2m, giving a net repayment from the existing portfolio of £11.9m.
Figure 11: Outflows (investments)
Figure 12: Inflows (repayments)
Source: Gravis Capital Partners
Source: Gravis Capital Partners
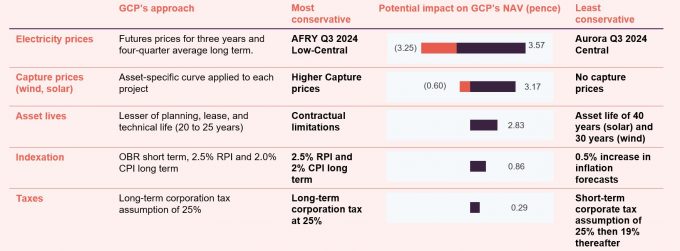
Conservative assumptions
Figure 13: Valuation assumptions as at 30 September 2024
Source: GCP Infrastructure Investments
Figure 13 summarises the key assumptions used in forecasting cash flows from renewable assets in which the company is invested, and the range of assumptions that the investment adviser observes in the market. GCP’s advisers traditionally take a conversative approach, with the chart highlighting alternative, more aggressive valuation assumptions that could be taken. The net effect of this is that, were GCP to assume the most conservative assumptions in every category, the end-September NAV of 105.22p would be reduced to 101.37p. By contrast, were GCP to assume the least conservative assumptions in each category, the NAV would have been 115.94p.
Were GCP to assume the least conservative assumptions in each category, the NAV would have been 115.94p.
Such an approach is admirable, as it reduces the likelihood and severity of any unexpected shocks to GCP’s NAV, e.g. a sharp reversal in wholesale gas prices. It also raises the possibility of further NAV uplifts from portfolio disposals, such as with the Blackcraig wind farm. Note that valuation metrics do not affect either the dividend pay-out or the share price yield.
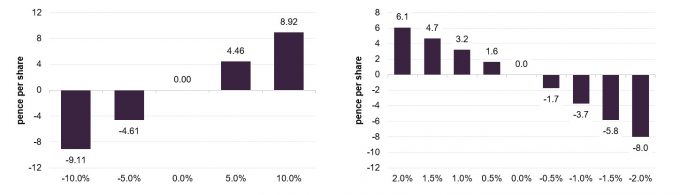
Sensitivities
The investment adviser also provides a sensitivity analysis for its cash flows. Figures 14 and 15 show the impact of changes in power prices and changes in its base case inflation forecast.
As noted, one of the main areas of focus for GCP’s capital recycling programme is reducing the impact of power price volatility on its cash flows and NAV. As such, we expect the figures highlighted in Figure 14 to reduce materially going forward.
Figure 14: Impact of change in forecast electricity prices
Figure 15: NAV impact associated with a movement in inflation
Source: GCP Infrastructure Investments
Source: GCP Infrastructure Investments
Performance
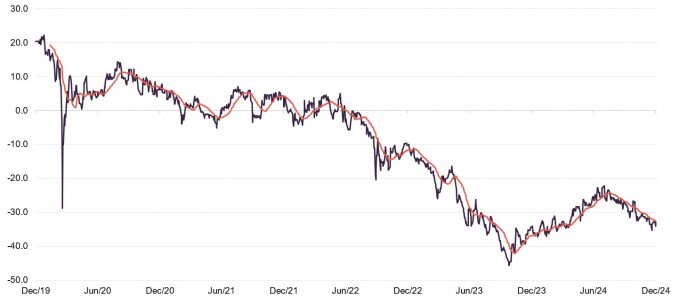
Despite less-favourable market conditions over the last few years, GCP has still managed to deliver a NAV total return of 33.6% since 2019. This supports our view that the market reaction, which has seen shares fall by 22% over the same period and a significant discount to NAV open up, is in no way a fair reflection of the quality of the company’s underlying assets.
Figure 17 illustrates the significant outperformance of GCP over the sterling corporate bond index. This figure provides another illustration of the tangible returns generated by the company above direct market comparables. We believe there exists a clear advantage for investors seeking sustained long-term distributions in GCP’s strategies, particularly in the face of increasing bond market volatility.
Figure 16: GCP NAV total return
Figure 17: GCP NAV total return performance relative to sterling corporate bond performance
Source: Morningstar, Marten & Co
Source: Morningstar, Marten & Co
Whilst the NAV total return has been modest over the past 12 months, the company is yet to fully realise the benefits of its capital recycling efforts due to transaction delays experienced throughout the year. As we have noted, these are now expected to flow through the portfolio over the first half of 2025, suggesting there is a significant amount of potential upside as these positions are realised, bearing in mind the 6.4% premium to NAV at which the Blackcraig windfarm investments were solid. Additional realisations at or above NAV can only work to highlight the irrationality of the current discount, which remains near historical extremes. Coupled with improving market conditions, an impressive policy backdrop, and a long track record of capitalising on changing market dynamics, we believe there is a considerable opportunity for investors at current prices.
Figure 18: Cumulative total return performance over periods ending 31 December 2024
| 3 months (%) | 6 months(%) | 1 year(%) | 3 years (%) | 5 years (%) | |
|---|---|---|---|---|---|
| GCP share price | (7.8) | (8.0) | 7.5 | (16.9) | (22.0) |
| GCP NAV | 0.6 | 1.0 | 2.2 | 18.8 | 33.6 |
| Sterling corporate bonds | (0.3) | 2.8 | 6.8 | (9.9) | (4.9) |
Peer group
Figure 19: Infrastructure peer group comparative data as at 31 December 2024
| Premium / (discount) (%) | Dividend yield (%) | Ongoing charge(%) | Market cap (GBPm) | |
|---|---|---|---|---|
| GCP Infrastructure Investments | (33.3) | 10.0 | 1.10 | 609 |
| 3i Infrastructure | (12.8) | 3.9 | 1.65 | 2,988 |
| BBGI Global Infrastructure | (15.1) | 6.8 | 0.93 | 896 |
| Cordiant Digital Infrastructure | (26.2) | 4.4 | 0.90 | 697 |
| Digital 9 Infrastructure | (58.5) | 0.5 | 1.33 | 164 |
| HICL Infrastructure | (23.9) | 6.9 | 1.14 | 2,386 |
| International Public Partnerships | (18.7) | 7.0 | 1.20 | 2,286 |
| Pantheon Infrastructure | (22.1) | 4.7 | – | 416 |
| Sequoia Economic Infrastructure | (17.3) | 8.7 | 0.95 | 1,238 |
| Peer group median | (22.1) | 6.8 | 1.1 | 896.0 |
| GCP rank | 8/9 | 1/9 | 4/8 | 7/9 |
Up-to-date information on GCP and its peers is available on the QuotedData website
GCP sits within the AIC’s infrastructure sector, which is made up of three companies that invest predominantly in public/private partnership project equity (BBGI, HICL and International Public Partnerships), two companies that have more revenue exposure towards demand driven assets (3i Infrastructure and Pantheon Infrastructure), two digital infrastructure companies (Cordiant Digital Infrastructure and Digital 9 Infrastructure) and one company (Sequoia Economic Infrastructure, which – like GCP – invests primarily in infrastructure debt, but using a much broader definition of what constitutes infrastructure).
Since our last note, median discounts to NAV in the infrastructure sector have widened from 15.9% to 22.1%. Unfortunately for GCP, its discount has slipped further, falling to 32.6%.
After a positive re-rating earlier in the year, GCP’s discount to NAV is now the second-widest in the sector, behind Digital 9 Infrastructure, a trust in managed wind-down following a number of operational issues. By contrast, as we have highlighted, GCP continues to execute well. We are confident that the discount remains a temporary phenomenon, given the quality of the company’s assets and the reliability of its earnings. Almost two-thirds of GCP’s investments are regulated or contracted, de-risking returns through highly visible and increasingly stable earnings. This structure has provided the foundation for the company’s current capital programs and leaves the adviser in a strong position to rebalance the portfolio when it does begin to make new investments.
GCP also boasts the highest dividend of its immediate peer group, adding additional appeal to the shares.
Figure 20: Infrastructure peer group cumulative NAV TR performance ending 31 December 2024
| 3 months (%) | 6 Months(%) | 1 year(%) | 3 years (%) | 5 years (%) | |
|---|---|---|---|---|---|
| GCP | (0.6) | 1.0 | 2.2 | 18.8 | 33.6 |
| 3i Infrastructure | 0.8 | 5.2 | 10.3 | 39.8 | 80.1 |
| BBGI | 1.4 | 2.5 | 5.4 | 23.0 | 40.7 |
| Cordiant Digital Infrastructure | 2.7 | 3.6 | 14.4 | 35.5 | n/a |
| Digital9 Infrastructure | 0.1 | (42.4) | (55.3) | (52.4) | n/a |
| HICL | 1.3 | 1.6 | 3.5 | 17.5 | 30.6 |
| International Public Partnerships | 1.4 | 0.8 | 1.8 | 17.9 | 28.3 |
| Pantheon Infrastructure | 0.9 | 5.6 | 12.0 | n/a | n/a |
| Sequoia Economic Infrastructure | 0.5 | 2.0 | 8.0 | 14.0 | 23.2 |
| Peer group median | 0.9 | 2.0 | 5.4 | 18.3 | 32.1 |
| GCP rank | 9/9 | 7/9 | 7/9 | 4/8 | 3/6 |
Alternative peer group – renewable energy companies
Figure 21: Renewable energy peer group comparative data as at 31 December 2024
| Premium / (discount) (%) | Dividend yield (%) | Ongoing charge(%) | Market cap (GBPm) | |
|---|---|---|---|---|
| GCP | (33.3) | 9.9 | 1.10 | 609 |
| Aquila Energy Efficiency Trust | (45.1) | 0 | – | 43 |
| Aquila European Renewables | (27.0) | 8.8 | 1.10 | 207 |
| Bluefield Solar Income | (24.9) | 9.4 | 1.02 | 562 |
| Downing Renewables & Infra. | (32.9) | 7.3 | 1.60 | 135 |
| Ecofin US Renewables | (52.6) | 2.3 | 1.78 | 34 |
| Foresight Environmental Infrastructure Group | (31.0) | 10.3 | 1.24 | 490 |
| Foresight Solar Fund | (32.8) | 10.6 | 1.15 | 428 |
| Gore Street Energy Storage | (51.4) | 14.4 | 1.42 | 245 |
| Greencoat Renewables | (24.6) | 8.1 | 1.18 | 769 |
| Greencoat UK Wind | (17.4) | 7.6 | 0.92 | 2,954 |
| Gresham House Energy Storage | (59.3) | 12.3 | 1.19 | 256 |
| Harmony Energy Income | (26.5) | 0.2 | – | 148 |
| HydrogenOne capital growth | (78.3) | 0 | 2.56 | 28 |
| NextEnergy Solar | (32.6) | 12.8 | 1.11 | 383 |
| Octopus Renewables Infrastructure | (34.5) | 8.9 | 1.16 | 378 |
| SDCL Energy Efficiency Income | (38.3) | 11.2 | 1.02 | 608 |
| The Renewables Infrastructure Group | (27.5) | 8.5 | 1.04 | 2,173 |
| Triple Point Energy Efficiency | (41.5) | 11.9 | 2.06 | 46 |
| US Solar Fund | (42.9) | 5.3 | 1.39 | 105 |
| VH Global Energy Infrastructure | (42.1) | 8.8 | 1.39 | 255 |
| Peer group median | (33.3) | 8.8 | 1.2 | 256.0 |
| GCP rank | 11/22 | 8/22 | 5/21 | 4/22 |
In light of the increasing importance of renewable energy within GCP’s portfolio, we feel it is also relevant to compare the company to the constituents of the renewable energy infrastructure sector, shown in Figure 21. However, it is worth noting that this encompasses a diverse range of companies which are not all directly comparable to GCP, such as Ecofin US Renewables and the US Solar Fund, which have much-longer-term PPAs and are therefore less exposed to energy price volatility. GCP’s asset base also differs widely from the energy storage companies – Gore Street, Gresham House and Harmony – and the energy efficiency companies – Aquila, SDCL and Triple Point.
We think the best comparators are Bluefield Solar, Foresight Solar, Greencoat UK Wind, Foresight Environmental Infrastructure, NextEnergy Solar, Octopus Renewables and The Renewables Infrastructure Group.
Notably, in contrast to the lower discounts in the infrastructure sector, GCP’s discount is in line with the median for the renewable energy peer group, highlighting the negative sentiment surrounding the sector.
Figure 22: Renewable energy peer group cumulative NAV TR performance ending 31 December 2024
| 3 months (%) | 6 Months(%) | 1 year(%) | 3 years (%) | 5 years (%) | |
|---|---|---|---|---|---|
| GCP | (0.6) | 1.0 | 2.2 | 18.8 | 33.6 |
| Aquila Energy Efficiency Trust | 7.9 | 7.9 | 5.9 | 8.8 | n/a |
| Aquila European Renewables | 0.8 | (2.6) | (10.7) | 1.9 | n/a |
| Bluefield Solar Income | 1.8 | (2.4) | (0.9) | 24.2 | 45.2 |
| Downing Renewables & Infra. | 1.0 | 1.3 | 4.1 | 30.5 | n/a |
| Ecofin US Renewables | 6.4 | (17.8) | (25.0) | (20.3) | n/a |
| Foresight Solar Fund | 1.8 | 1.7 | 2.1 | 25.6 | 50.9 |
| Gore Street Energy Storage | 1.9 | (3.3) | (4.9) | 15.5 | 46.9 |
| Greencoat Renewables | 0.7 | (0.9) | (1.0) | 24.9 | 42.1 |
| Greencoat UK Wind | 1.6 | 2.4 | 2.4 | 40.9 | 74.0 |
| Gresham House Energy Storage | 1.3 | (16.3) | (24.4) | 4.5 | 37.7 |
| Harmony Energy Income | (6.7) | (8.0) | (22.8) | n/a | n/a |
| HydrogenOne Capital Growth | 0.0 | (2.7) | (0.6) | 5.3 | n/a |
| Foresight Environmental Infrastructure Group | (1.2) | 0.1 | (1.8) | 31.6 | 49.7 |
| NextEnergy Solar | (1.5) | (2.6) | (1.8) | 16.2 | 31.5 |
| Octopus Renewables Infrastructure | 1.5 | 2.8 | 2.7 | 18.9 | n/a |
| SDCL Energy Efficiency Income | 1.7 | 3.7 | 7.2 | 4.2 | 25.7 |
| The Renewables Infrastructure Group | 1.6 | 0.4 | (1.5) | 20.5 | 40.8 |
| Triple Point Energy Efficiency | 1.8 | 32.6 | 22.6 | 38.3 | n/a |
| US Solar Fund | 6.9 | 1.1 | (6.0) | (2.8) | 2.7 |
| VH Global Energy Infrastructure | 1.3 | (1.6) | 10.6 | 22.4 | n/a |
| Peer group median | 1.5 | 0.1 | (0.9) | 18.8 | 41.4 |
| GCP rank | 18/21 | 9/21 | 8/21 | 11/20 | 9/12 |
Quarterly dividend
Dividends are declared and paid quarterly. Shareholders are able to elect to take their dividend as scrip (in shares rather than cash). In its 2024 financial year, GCP’s target dividend remained stable at 7.0p in line with its previous three financial years.
Discount
Over the past 12 months, GCP’s shares have traded on an average discount to NAV of 30.2%, a high of 22.2%, and a low of 37.2%. As of publishing, the discount stood at 32.6%. As Figure 23 shows, this narrowed considerably over the first half of 2024 as markets reacted to the expectation of lower interest rates. Unfortunately, as we have noted, financial conditions have steadily tightened in recent months, which has weighed on GCP’s share price. Despite this, on balance we remain confident that the overall policy backdrop remains supportive of the re-rating seen in the first half.
Figure 23: GCP discount over five years ending 31 December 2024
Source: Morningstar, Marten & Co
Fees and costs
The investment adviser receives an investment advisory fee of 0.9% a year of the NAV net of cash. This fee is calculated and payable quarterly in arrears. There is no performance fee. The investment adviser is also entitled to an arrangement fee of up to 1% (at its discretion) of the cost of each asset acquired by GCP. Gravis will generally seek to charge the arrangement fee to borrowers rather than to the company, where possible. To the extent that any arrangement fee negotiated by the investment adviser with a borrower exceeds 1%, the benefit of any such excess shall be paid to the company. The investment adviser also receives a fee of £70,000 (subject to RPI adjustments) a year for acting as AIFM, which was £89,000 for the 2024 financial year, after adjustments.
The investment advisory agreement may be terminated by either party on 24 months’ written notice.
Apex Financial Services (Alternative Funds) Limited is GCP’s administrator and company secretary. Depositary services are provided by Apex Financial Services (Corporate) Limited. The fee for the provision of these services during the 2024 financial year was £1.008m (2023: £1.034m).
The ongoing charges ratio for the year ended 30 September 2024 was 1.1%, unchanged from the prior year.
Capital structure and life
As of 31 December 2024, GCP has 884,797,669 ordinary shares outstanding, of which 18,915,019 are held in treasury. The company’s financial year end is 30 September and annual general meetings (AGMs) are held in February.
GCP is an evergreen company, continually accepting additional capital and making new investments with no fixed life and no regular continuation vote.
Gearing and derivatives
The use of structural gearing (borrowing) to finance investments is permitted up to a maximum of 20% of NAV immediately following drawdown of the relevant debt. At 30 September 2024, GCP’s net gearing was 4.5%, down significantly from 10.8% for the 2023 financial year.
As of 30 September 2024, the company has credit arrangements of £150m across four lenders: Lloyds, AIB, Mizuho and Clydesdale. At year end, £57m was drawn.
Major shareholders
Figure 24: Major shareholders
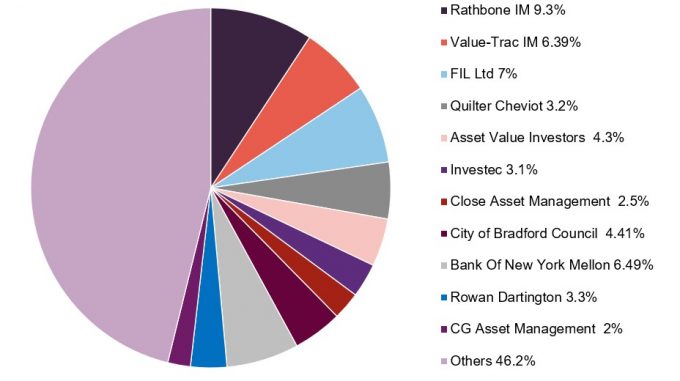
Source: Marten & Co
Board
Currently, the board has six directors, all of whom are non-executive and independent of the investment adviser. However, its composition will see several changes in the year ahead to align with corporate governance best practice. Michael Gray and Julia Chapman have both served on the board for nine years, and their retirement will be phased over the coming year. Mr Gray will retire from the board in February 2025, and Ms Chapman will stay on the board for a further transition period, assisting with the identification of an appropriate replacement.
Figure 25: Board members, fees and shareholdings
| Director | Role | Date appointed | Length of service (years) | Annual fee | Shareholding |
|---|---|---|---|---|---|
| Andrew Didham | Chairman and chair of nomination committee | 17/12/2021 | 3 | 96,000 | 146,345 |
| Julia Chapman | Senior independent director | 01/10/2015 | 9 | 61,000 | 60,446 |
| Dawn Crichard | Chair of the management engagement committee and chair of the ESG committee | 16/09/2019 | 5 | 73,000 | 75,261 |
| Michael Gray | Chair of the investment committee | 01/10/2015 | 9 | 76,000 | – |
| Steven Wilderspin | Chair of the audit and risk committee | 10/02/2021 | 3 | 74,000 | 15,000 |
| Alex Yew | Non-executive director | 01/11/2022 | 2 | 63,000 | 20,000 |
Andrew Didham (chairman)
Andrew Didham, a UK resident, is a Fellow of the Institute of Chartered Accountants in England & Wales. He is a senior executive director with extensive board-level experience within the Rothschild banking group. Andrew was group finance director for 16 years and a member of the group management of the worldwide Rothschild business, comprising investment banking, wealth management, asset management and merchant banking activities. He has broad non-executive director experience, being on the boards of IG Group Holdings Plc, Shawbrook Group Plc, Charles Stanley Group Plc, and formerly Jardine Lloyd Thomson Group Plc. Within Rothschild, he remains an executive vice chairman (a position he has held since 2012) and a non-executive member of NM Rothschild and Sons Limited. Formerly, he was a partner in the London office of KPMG with responsibility for the audit of a number of global financial institutions and assignments for various government and regulatory authorities.
Julia Chapman (senior independent director)
Julia Chapman, a Jersey resident, is a solicitor qualified in England & Wales and Jersey with over 30 years’ experience in the investment company and capital markets sector. Having trained with Simmons & Simmons in London, she moved to Jersey to work for Mourant du Feu & Jeune (now known as Mourant) and became a partner in 1999.
Julia was appointed senior counsel to State Street following its acquisition of Mourant’s fund administration business in April 2010. She headed up a team supporting State Street’s European alternative investment services division. In July 2012, Julia left State Street to focus on the independent provision of directorship and governance services to a small number of alternative investment fund vehicles. Julia serves on the boards of three other Main Market listed companies: Henderson Far East Income Limited, BH Macro Limited and Sanne Group Plc.
Dawn Crichard (chair of the management engagement committee)
Dawn Crichard, a Jersey resident, is a Fellow of the Institute of Chartered Accountants of England and Wales with over 20 years’ experience in senior chief financial officer and financial director positions. Having qualified with Deloitte, she moved into the commercial sector and was chief financial officer of a large private construction group for 12 years. Dawn then worked with both private and listed clients in the hedge fund division of State Street. Following this, she was appointed as chief financial officer for Bathroom Brands Plc. In her current role as head of finance at a family office, she has been involved in establishing and overseeing high-value private expert funds. Her broad accounting and commercial experience includes establishing new group head offices, mergers, acquisitions, refinancing and restructuring.
Michael Gray (chair of the investment committee)
Michael Gray, a Jersey resident, is a qualified corporate banker and corporate treasurer. Michael was most recently the regional managing director of Corporate Banking for RBS International, based in Jersey, but with responsibility for The Royal Bank of Scotland’s Corporate Banking Business in the Crown Dependencies and British Overseas Territories.
In a career spanning 31 years with The Royal Bank of Scotland Group Plc, Michael has undertaken a variety of roles, including that of an auditor, and has extensive general management and lending experience across a number of industries. He is also a non-executive director of Jersey Finance Limited, the promotional body for the finance sector in Jersey, and a Main Market listed company JTC Plc, as well as other listed and private companies.
Steven Wilderspin (chair of the audit and risk committee)
Steven Wilderspin, a Jersey resident, is a Fellow of the Institute of Chartered Accountants of England & Wales. Since 2007, he has acted as an independent director on a number of public and private investment funds and commercial companies. In 2017, he retired as the chair of the audit and risk committee of 3i Infrastructure Plc after 10 years of service.
Steven is currently the chair of the risk committee of Blackstone Loan Financing Limited, chair of the audit and risk committee of HarbourVest Global Private Equity Limited, and a non-executive director of Phoenix Spree Deutschland Limited. Prior to 2007, he was a director at Maples Finance Jersey, with responsibility for their fund administration and fiduciary business. Steven began his career at PwC in London in 1990.
Alex Yew (independent director)
Alex Yew, a UK resident, has more than 25 years of experience as a lawyer, banker and investor. He is a qualified solicitor in Singapore, England and Wales. Alex currently holds a number of non-executive roles in infrastructure, energy, and energy transition. Prior to this, he was a senior adviser and a senior managing director at John Laing, an international investor in infrastructure and energy assets. Alex worked at John Laing for more than 14 years, during which time he held leadership positions in project finance, new markets, strategy, and partnerships, and was regional head of the European and Latin American businesses. He was also a member of the senior leadership team and the investment committee. Prior to John Laing, Alex was a director in the infrastructure advisory team at CIBC World Markets in London. He was also a banker and lawyer in Southeast Asia before he moved to the UK.
Previous publications
Readers interested in further information about GCP may wish to read our previous notes.
Figure 26: QuotedData’s previously published notes on GCP
| Title | Note type | Publication date |
| Stable income, uncertain times | Initiation | 30 January 2020 |
| Rebased dividend | Update | 1 June 2020 |
| Compelling yield | Annual overview | 11 January 2021 |
| Penalised for being conservative? | Update | 1 July 2021 |
| The future is brighter and greener | Annual overview | 18 January 2022 |
| Improving outlook and room to grow | Update | 19 July 2022 |
| Green is good | Annual overview | 7 February 2023 |
| Merger to unlock compelling value? | Update | 17 August 2023 |
| Don’t look back in anger | Annual overview | 30 January 2024 |
| Crystallising unrealised value | Update | 6 August 2024 |
IMPORTANT INFORMATION
Marten & Co (which is authorised and regulated by the Financial Conduct Authority) was paid to produce this note on GCP Infrastructure Investments Limited.
This note is for information purposes only and is not intended to encourage the reader to deal in the security or securities mentioned within it. Marten & Co is not authorised to give advice to retail clients. The research does not have regard to the specific investment objectives financial situation and needs of any specific person who may receive it.
The analysts who prepared this note are not constrained from dealing ahead of it but, in practice, and in accordance with our internal code of good conduct, will refrain from doing so for the period from which they first obtained the information necessary to prepare the note until one month after the note’s publication. Nevertheless, they may have an interest in any of the securities mentioned within this note.
This note has been compiled from publicly available information. This note is not directed at any person in any jurisdiction where (by reason of that person’s nationality, residence or otherwise) the publication or availability of this note is prohibited.
Accuracy of Content: Whilst Marten & Co uses reasonable efforts to obtain information from sources which we believe to be reliable and to ensure that the information in this note is up to date and accurate, we make no representation or warranty that the information contained in this note is accurate, reliable or complete. The information contained in this note is provided by Marten & Co for personal use and information purposes generally. You are solely liable for any use you may make of this information. The information is inherently subject to change without notice and may become outdated. You, therefore, should verify any information obtained from this note before you use it.
No Advice: Nothing contained in this note constitutes or should be construed to constitute investment, legal, tax or other advice.
No Representation or Warranty: No representation, warranty or guarantee of any kind, express or implied is given by Marten & Co in respect of any information contained on this note.
Exclusion of Liability: To the fullest extent allowed by law, Marten & Co shall not be liable for any direct or indirect losses, damages, costs or expenses incurred or suffered by you arising out or in connection with the access to, use of or reliance on any information contained on this note. In no circumstance shall Marten & Co and its employees have any liability for consequential or special damages.
Governing Law and Jurisdiction: These terms and conditions and all matters connected with them, are governed by the laws of England and Wales and shall be subject to the exclusive jurisdiction of the English courts. If you access this note from outside the UK, you are responsible for ensuring compliance with any local laws relating to access.
No information contained in this note shall form the basis of, or be relied upon in connection with, any offer or commitment whatsoever in any jurisdiction.
Investment Performance Information: Please remember that past performance is not necessarily a guide to the future and that the value of shares and the income from them can go down as well as up. Exchange rates may also cause the value of underlying overseas investments to go down as well as up. Marten & Co may write on companies that use gearing in a number of forms that can increase volatility and, in some cases, to a complete loss of an investment.