
Global equity exposure with a little extra juice
HSBC Multi Factor Worldwide Equity UCITS ETF (HWWA) is a long-standing active ETF that neatly demonstrates the appeal of the asset class. Through a tried-and-trusted investment process based on factor investing – which we explain in this note – it has consistently achieved a modest outperformance of its global equity benchmark.
Despite a significant wobble at the time of the “Liberation Day” tariff announcements in April, global equities enjoyed another strong year in 2025, and the rally was somewhat more broad-based than in previous years. Over the year HWWA outperformed the benchmark.
Although risks clearly remain, not least from erratic American policymaking, prospects for global equities generally look promising going into 2026. For investors wanting this exposure, with the prospect of some outperformance on top, HWWA is worthy of consideration. We look deeper into this on the next few pages.
Global equities exposure with quantitative overlay
HWWA aims to outperform the benchmark MSCI All Country World Index. The investment manager identifies stocks from this index and ranks them based on certain factors. Shares are then quantitatively selected to create a portfolio to maximise exposure to the highest-ranking stocks.
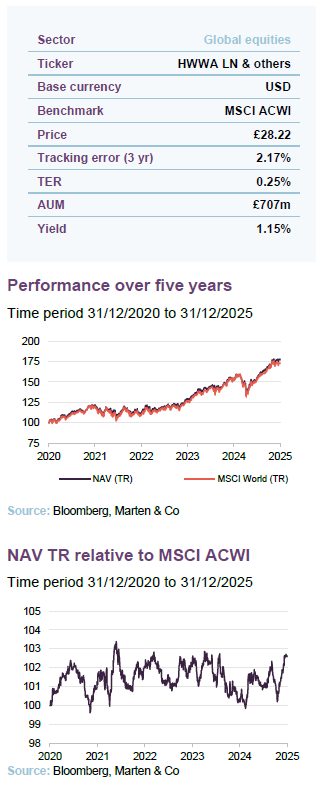
| 12 months ended | NAV total return (%) | Benchmark total return (%) |
|---|---|---|
| 31/12/2021 | 20.9 | 19.6 |
| 31/12/2022 | (7.8) | (8.7) |
| 31/12/2023 | 15.9 | 15.8 |
| 31/12/2024 | 17.8 | 19.8 |
| 31/12/2025 | 16.4 | 13.9 |
Source: Bloomberg, Marten & Co
HWWA: long-standing success through factor investing
Launched in 2014, with the current process instigated in 2017.
HWWA was launched by HSBC Global Asset Management in July 2014. Initially, the fund followed a global equity approach, but underwent a strategic shift around October 2017, when HSBC introduced its current multi-factor model. This change aligned the fund with a trend towards factor-enhanced investing, combining quantitative analysis.
Multi-factor investing
Multi-factor investing is an investment approach that seeks to enhance returns and manage risk by systematically targeting several drivers of equity performance – known as factors – within a single strategy. Rather than relying on traditional market-cap weighting, multi-factor models assign portfolio weights based on characteristics that have been linked to long-term excess returns, such as value, quality, momentum, low volatility, and size. Each of these factors may perform differently across market cycles; by combining them, multi-factor strategies seek to smooth performance variability and reduce reliance on any single source of return.
The approach originated from decades of academic research in financial economics and has become increasingly used among institutional investors seeking a balance between passive diversification and active risk management. Multi-factor portfolios use quantitative screening and optimisation techniques to select and weight stocks according to their exposure to these traits, while controlling for risks such as sector or regional concentration. In theory, the result is an equity portfolio that maintains broad market exposure but with tilts designed to capture inefficiencies that may persist in markets.
Active ETFs, which typically have low costs and a focus on liquid investments, may be suited to multi-factor investing. Multi-factor strategies rely on systematic, rules-based models to identify and balance exposures to different factors, which makes them quantitative and data-driven, with reference to an underlying index. Active ETFs such as HWWA provide a platform for implementing these models in real time, with managers able to adjust portfolio weights as factor signals evolve, without being constrained by a fixed benchmark replication requirement.
HWWA: Quantitative overlay aiming for outperformance
HWWA ranks the stocks in the MSCI ACWI and then quantitively selects stocks to make up the portfolio.
HWWA’s investment manager identifies stocks from the MSCI All Country World Index (MSCI ACWI) and ranks them from the least to the most attractive, based on several of the above factors. The manager then quantitatively selects shares to create a portfolio that aims to maximise the fund’s exposure to the highest ranked stocks and minimise the level of risk. This is done through the application of a series of constraints related to sector and company weights, to ensure the portfolio is not overly concentrated in any particular area. The result is a portfolio that appears to have broad diversification while maintaining the intended factor exposures.
HWWA’s stated aim is relative outperformance versus the index. The direction of performance is expected to correlate with global equities, but HWWA aims to perform relatively better than the MSCI ACWI. Although the portfolio construction is systematic, the fund is actively managed through the selection and weighting of the factors within the model. These decisions are based on the manager’s research and judgement rather than following a fixed index rule set.
In common with most of the European active ETF sector, HWWA invests directly in its underlying securities rather than using derivatives, and therefore adopts a physical replication approach.
Structure
HSBC Multi Factor Worldwide Equity UCITS ETF has two share classes: distribution (ISIN: IE00BKZGB098) and accumulation (ISIN: IE0000378O66). Each is available on different exchanges and in different currencies, as per Figure 1:
Figure 1: HSBC Factor Worldwide Equity UCITS ETF, available exchanges and currencies
| Distribution | Accumulation |
|---|---|
| London Stock Exchange: USD (HWWD LN)/ GBP (HWWA LN) | London Stock Exchange: USD (HWDA LN)/ GBP (HWWS LN) |
| Borsa Italiana: EUR (HWWA IM) | NYSE Euronext: (HWDA FP) |
| Deutsche Boerse AG – Xfra: (H41J GR) | |
| Deutsche Boerse AG – Xetra: (H41J GY) | |
| SIX Swiss Exchange: (HWWD SW) |
Source: HSBC Global Asset Management
Throughout this note the ticker HWWA has been used for consistency, and as the default investment for UK-based sterling investors. Performance comparisons and benchmark tracking are calculated using NAV, in line with the fund’s global investment universe.
Tracking error
The three-year tracking error of HWWA (to 31 January 2026) is 2.17%. Specifically, this represents the standard deviation of the difference between HWWA’s returns and those of the benchmark. This level of tracking error is consistent with the strategy and indicates more divergence than a passive ETF, while the fund remains relatively close to the benchmark. This pattern is typical for quantitative-based active ETFs, which may provide returns close to the benchmark over a given period, with the potential for a small amount of outperformance generated by active management.
Fees
HWWA has a Total Expense Ratio (TER) of 0.25%, covering the management fee, custody and administration fees, registrar and audit/compliance costs. The fee accrues daily within the fund’s NAV. It does not include the transaction costs of purchases and sales. HWWA’s TER is higher than the TER of passive global equity ETFs, which typically have a TER of between 0.12% and 0.22%.
2025: another strong year for global equities
Markets rallied over 2025; the rally was global, rather than being dominated by the US.
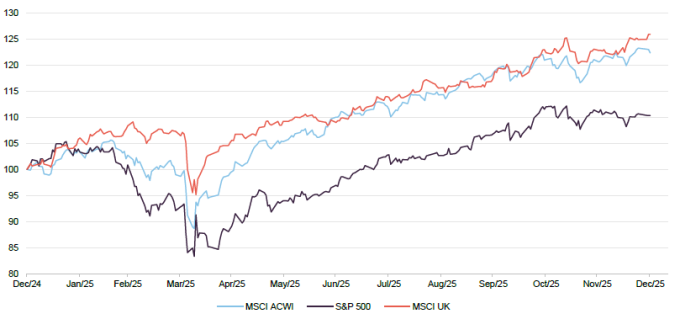
2025 appears to have been a positive year in markets, as shown in Figure 2. Global equities, as measured by the MSCI ACWI, rose by over a fifth over twelve months. Markets appeared less concentrated than in much of the recent past. Although the technology-heavy US market – illustrated here by the S&P 500 – continued to perform strongly, it appears to have dominated investor attention to a lesser extent than in other recent years. For example, the UK saw an improvement in both sentiment and performance from previously lower levels, and UK equities outperformed both their US and global peers during the period. This is illustrated by the performance of the MSCI UK Index.
The chart shows the year’s main period of market weakness in April, when equities fell rapidly following President Trump’s “Liberation Day” tariff announcements. The downturn was short-lived, with an initial 90-day tariff pause followed by a series of negotiations between the Trump administration and different countries.
Markets rallied over 2025; the rally appeared to be global, rather than being dominated by the US.
Figure 2: Market performance over 2025, indices rebased to 100
Source: Bloomberg, Marten & Co
For the remainder of the year, these reversals on tariffs appeared to allow investors to focus on other areas. This seemed to shift attention towards corporate fundamentals. Company balance sheets and profitability remained broadly stable, which may have been supported by earlier cost control and cash positions, even as global trade slowed. Inflation continued to rise, but monetary authorities began signalling potential rate cuts to offset what appeared to be weakening growth momentum.
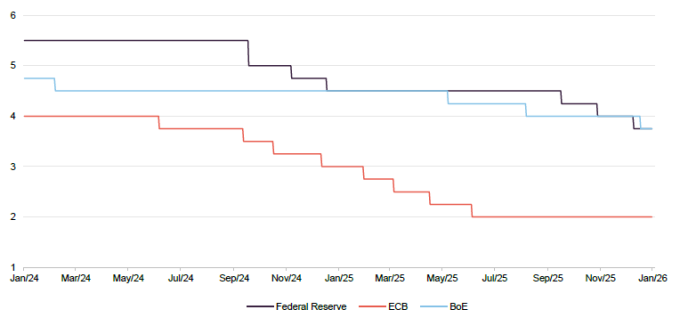
Figure 3 shows a steady fall in interest rates across developed markets in the past two years. Such an environment has historically been associated with positive performance for global equities, which may suggest the potential for another positive year for global equities, and by extension for HWWA.
Figure 3: US (Federal Reserve), eurozone (ECB) and UK (BoE) benchmark interest rates since January 2024
Source: Bloomberg, Marten & Co
Top 10 holdings
HWWA’s top 10 is closely aligned to the MSCI ACWI, but there are some important differences.
Given how HWWA is constructed and managed, its top 10 constituents list, as shown in Figure 4, closely matches the MSCI ACWI Index. Nonetheless, there are some differences, which may reflect the effects of active management.
HWWA has a higher concentration to the largest components of the index, which may be related to the role of momentum in factor investing. This results in a pronounced exposure to the “Magnificent Seven” US technology names.
Figure 4: Top 10 holdings as at 31 December 2025
| Holding | Sector | Country | Allocation 31 December 2025 (%) | MSCI All Countries World Index (%) | Relative versus index |
|---|---|---|---|---|---|
| NVIDIA | Information technology | US | 5.1 | 4.9 | 0.2 |
| Apple | Information technology | US | 4.8 | 4.3 | 0.5 |
| Microsoft | Information technology | US | 4.1 | 3.7 | 0.6 |
| Alphabet | Communication services | US | 3.8 | 3.6 | 0.2 |
| Amazon | Consumer discretionary | US | 2.8 | 2.4 | 0.5 |
| Meta Platforms | Communication services | US | 1.6 | 1.5 | 0.1 |
| Broadcom | Information technology | US | 1.3 | 1.7 | (0.4) |
| Tesla | Consumer discretionary | US | 1.3 | 1.4 | (0.1) |
| Exxon Mobil | Energy | US | 1.1 | 0.6 | 0.5 |
| Johnson & Johnson | Health Care | US | 1.0 | 0.5 | 0.5 |
| Total of top 10 | 26.9 | 24.6 |
Source: HSBC Global Asset Management, Marten & Co
Asset allocation
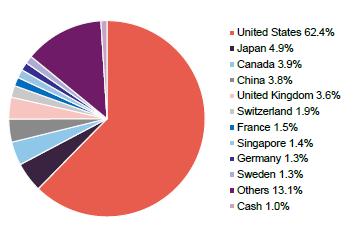
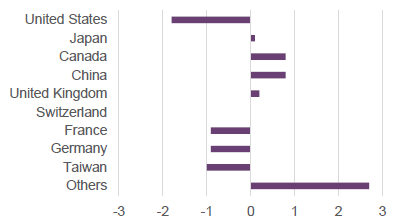
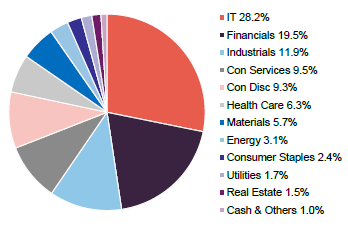
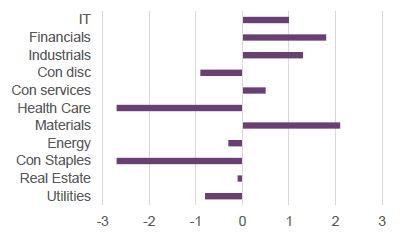
HWWA’s asset allocation appears to match the benchmark relatively closely. As a result, it is primarily weighted towards the United States geographically, and IT and financials in terms of sectors.
Figure 5: HWWA geographic allocation as at 31 December 2025
Source: HSBC Global Asset Management
Figure 6: HWWA geographic allocation relative to MSCI ACWI, %
Source: HSBC Global Asset Management; MSCI
Figure 7: HWWA sector allocation as at 31 December 2025
Source: HSBC Global Asset Management
Figure 8: HWWA sector allocation relative to MSCI ACWI, %
Source: HSBC Global Asset Management; MSCI
Peer group
Figure 9: Total return NAV performance & fees over periods for selection of large-cap global equity active ETFs ending 31 December 2025
| 3 months(%) | 6 months(%) | 1 year(%) | 3 years(%) | 5 years(%) | AUM (£m) | Total expense ratio (%) | |
|---|---|---|---|---|---|---|---|
| HSBC Multi Factor Worldwide Equity | 4.8 | 15.2 | 16.4 | 58.8 | 77.0 | 705 | 0.25 |
| AXA Climate Equity | 3.2 | 12.0 | 13.1 | 47.4 | – | 144 | 0.50 |
| BNP Paribas Easy ESG Enhanced World | 3.9 | 13.7 | 13.0 | – | – | 1,055 | 0.20 |
| Fidelity Global Equity Research Enhanced | 2.8 | 11.8 | 10.1 | 54.9 | 72.7 | 177 | 0.35 |
| First Trust Global Capital Strength ESG Leaders | 0.5 | 3.4 | 3.7 | 23.2 | – | 47 | 0.75 |
| Invesco Global Active ESG Equity | 4.8 | 13.7 | 14.1 | 67.4 | 102.5 | 1,457 | 0.30 |
| iShares World Equity Enhanced Active | 3.2 | 12.0 | 13.1 | 47.4 | – | 1,080 | 0.30 |
| JPM Global Research Enhanced Index Equity | 3.2 | 12.0 | 13.1 | 47.4 | – | 486 | 0.25 |
| Peer group median | 3.3 | 11.7 | 12.1 | 49.5 | 84.1 | 644 | 0.36 |
| HWWA rank | 1/8 | 1/8 | 1/8 | 2/7 | 2/3 | 4/8 | 2/8 |
Source: Morningstar, Bloomberg, Marten & Co
Figure 9 shows that HWWA’s performance appears to compare favourably with other active ETFs in the global large-cap equity sector. As many active ETFs have launched recently, the number of comparable funds decreases over longer time periods.
Any comparison of fees for active ETFs may require caution, given the varying levels of “active” management across the sector, and higher levels of active management may be associated with higher fees. HWWA’s TER is among the joint second lowest of the funds in Figure 9.
Performance
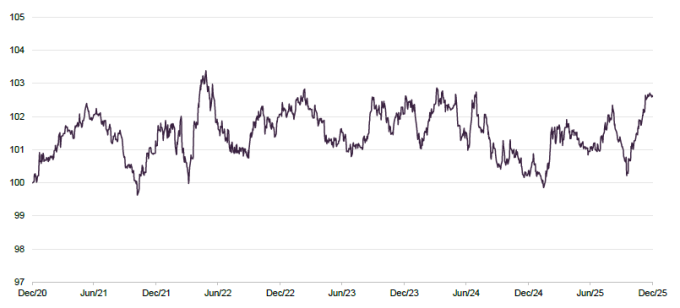
HWWA’s performance appears to track that of the MSCI ACWI Index closely, in line with its mandate. Figure 10 shows that (net of fees) relative performance was ahead of the benchmark over the majority of the five-year period.
Figure 10: HWWA’s NAV total return relative to MSCI ACWI index, rebased to 100, over five years to 31 December 2025
Source: Bloomberg, Marten & Co
Figure 11: Cumulative total return performance over periods ending 31 December 2025
| 1 month (%) | 3 months(%) | 6 months (%) | 1 year (%) | 3 years(%) | 5 years(%) | |
|---|---|---|---|---|---|---|
| HWWA NAV | 0.3 | 4.8 | 15.2 | 16.4 | 58.8 | 77.0 |
| MSCI ACWI index | (0.6) | 3.3 | 13.3 | 13.9 | 58.0 | 72.5 |
| Relative performance | 0.9 | 1.5 | 1.9 | 2.5 | 0.8 | 4.5 |
Source: Bloomberg, Marten & Co.
Dividends
Dividends are passed through to shareholders, rather than being retained in the fund.
HWWA has both income and accumulation share classes, and the fund’s policy is to pass through cash dividends received from the underlying equity holdings to shareholders, through payouts or reinvestment, rather than to retain income within the fund. For the income class, dividends are typically paid on a quarterly basis.
The most recent dividend was 9.18p per share, paid in November 2025. This followed payments of 14.45p in August, 9.17p in May and 6.74p in February. The overall distribution for the year was 39.54p, equating to a yield of 1.4% on the share price of £28.22 on 2 February. Investors should therefore be aware that at any time HWWA’s yield may be higher or lower than the index.
Management
HWWA is managed by HSBC Investment Funds (Luxembourg) S.A., part of the HSBC Global Asset Management platform, which implements the fund’s multi-factor global equity strategy under the oversight of HSBC’s global investment framework.
HSBC Global Asset Management was founded in 1973 and has developed into a global investment manager with a presence across more than 20 countries and territories. As at 30 September 2025, it reported approximately US$852bn in assets under management and employed more than 660 investment professionals working across developed and emerging markets. The organisation manages assets on behalf of a diverse client base, including institutional investors, intermediaries and retail clients, through both segregated accounts and pooled funds.
The firm’s structure combines global oversight with local market insight, with investment teams conducting due diligence in regional markets while sharing research and expertise across its international network. Leadership sits within HSBC’s broader governance framework, with the CEO of HSBC Asset Management reporting up into HSBC’s global executive structure.
IMPORTANT INFORMATION
QuotedData is a trading name of Marten & Co, which is authorised and regulated by the Financial Conduct Authority. This note was prepared by Marten & Co and is for information purposes only. It is not intended to encourage the reader to deal in the security or securities mentioned within it.
Marten & Co is not authorised to give advice to retail clients. The note does not have regard to the specific investment objectives, financial situation and needs of any specific person who may receive it.
Marten & Co may have or may be seeking a contractual relationship with any of the securities mentioned within the note for activities including the provision of sponsored research, investor access or fundraising services.
This note has been compiled from publicly available information. This note is not directed at any person in any jurisdiction where (by reason of that person’s nationality, residence or otherwise) the publication or availability of this note is prohibited.
Accuracy of Content: Whilst Marten & Co uses reasonable efforts to obtain information from sources which we believe to be reliable and to ensure that the information in this note is up to date and accurate, we make no representation or warranty that the information contained in this note is accurate, reliable or complete. The information contained in this note is provided by Marten & Co for personal use and information purposes generally. You are solely liable for any use you may make of this information. The information is inherently subject to change without notice and may become outdated. You, therefore, should verify any information obtained from this note before you use it.
No Advice: Nothing contained in this note constitutes or should be construed to constitute investment, legal, tax or other advice.
No Representation or Warranty: No representation, warranty or guarantee of any kind, express or implied is given by Marten & Co in respect of any information contained on this note.
Exclusion of Liability: To the fullest extent allowed by law, Marten & Co shall not be liable for any direct or indirect losses, damages, costs or expenses incurred or suffered by you arising out or in connection with the access to, use of or reliance on any information contained on this note. In no circumstance shall Marten & Co and its employees have any liability for consequential or special damages.
Governing Law and Jurisdiction: These terms and conditions and all matters connected with them, are governed by the laws of England and Wales and shall be subject to the exclusive jurisdiction of the English courts. If you access this note from outside the UK, you are responsible for ensuring compliance with any local laws relating to access.
No information contained in this note shall form the basis of, or be relied upon in connection with, any offer or commitment whatsoever in any jurisdiction.
Investment Performance Information: Please remember that past performance is not necessarily a guide to the future and that the value of shares and the income from them can go down as well as up. Exchange rates may also cause the value of underlying overseas investments to go down as well as up. Marten & Co may write on companies that use gearing in a number of forms that can increase volatility and, in some cases, to a complete loss of an investment.