
The endgame?
In the midst of a period of difficult investment performance, Impax Environmental Markets (IEM) has been the subject of a campaign by the activist hedge fund Saba Capital. This led to an exit tender offer in May, which resulted in around 80% of shares being tendered. The much-diminished fund is now the subject of a Requisitioned General Meeting (RGM) on 17 June, at which Saba intends to remove the entire board of IEM and replace it with its own nominees.
IEM’s current chairman has stated that Saba has effective control over the company’s strategic direction, so it appears likely that Saba’s resolutions will pass at the RGM. If they do, it will mark the end of the current era at IEM, and the beginning of a potentially very different chapter, about which there is currently very little visibility, beyond a statement by Saba that the new board will be committed to delivering long-term value for all shareholders.
Capital growth and a more sustainable world
IEM is designed to enable investors to benefit from a highly differentiated, well-researched, and diversified portfolio of fast-growing, globally listed companies providing innovative solutions to environmental challenges or improving resource efficiency.
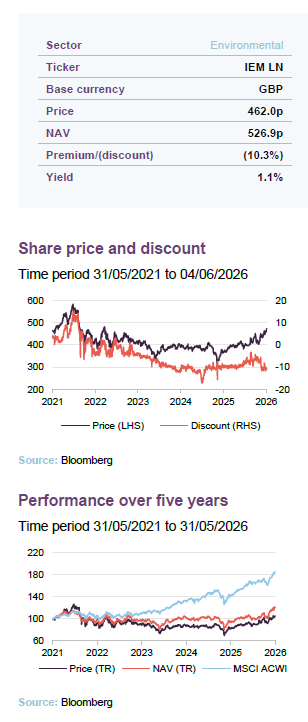
| Year ended | Share price total return (%) | NAV total return (%) | MSCI ACWI total return (%) |
|---|---|---|---|
| 31/05/2022 | (7.7) | (1.6) | 5.4 |
| 31/05/2023 | (3.6) | (3.0) | 3.3 |
| 31/05/2024 | (0.6) | 6.8 | 20.8 |
| 31/05/2025 | (6.4) | (7.7) | 8.0 |
| 31/05/2026 | 27.1 | 28.2 | 30.7 |
Upcoming AGM and RGM
IEM has been the subject of a campaign from the American activist hedge fund Saba Capital. Saba held a significant stake in IEM by the end of 2025, with the board concerned that this presented a significant challenge to the company’s stability and mandate, given different groups of shareholders on the register with very different investment strategies.
Following engagement with shareholders, including Saba, a continuation tender offer was launched in 2026. However, Saba did not support this, nor the board’s condition that it tender all or near all its shares. Therefore, fearing the risk of the sort of destabilising and expensive dispute with Saba that a number of investment companies in the sector have faced, the board launched a fallback exit tender offer.
This exit tender offer was supported by over 99% of shareholders who voted, and completed on 19 May. Almost 80% of IEM’s shares were tendered, with most non-Saba shareholders clearly not wanting to be invested in a Saba-controlled vehicle.
There is now a realistic prospect of Saba taking control of the much smaller fund that exists post the tender offer. Following share buyback activity by the trust, as at 21 May, Saba owns 31.36% of the shares and has issued a valid requisition notice to the board to remove the entire board and replace it with Saba nominees. The board is therefore obliged to convene a Requisitioned General Meeting. This will take place on the same day as the Annual General Meeting, on 17 June.
The chairman of IEM, Glen Suarez, wrote to shareholders on 22 May accepting that “Saba now has effective control over the company’s strategic direction”. He also stated the unanimous recommendation of the board to vote in favour of all the AGM resolutions, including the re-election of the current board, and the unanimous recommendation to vote against all of the Saba resolutions at the RGM. Glen states that the board has no visibility on what the plans of Saba and their nominated directors are, and that “a board nominated by Saba provides an unknown future, with unknown directors susceptible to pressure from Saba as the company’s largest shareholder and the entity that nominated them to their position as directors”.
Asset allocation
At the end of April 2026, IEM had 54 holdings, down very slightly from the 55 holdings at the time of our last note (which used data from 31 March 2025).
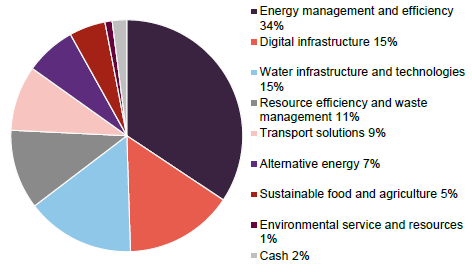
North America remains IEM’s largest geographic exposure, although it has reduced from 57% to 46% over the past year. The European exposure has increased from 29% to 34%. In terms of sectors, weightings towards energy management and efficiency, and digital infrastructure have increased since our last note.
Figure 1: IEM portfolio by geography as at 30 April 20261
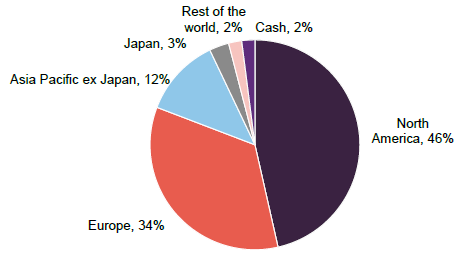
Figure 1: IEM portfolio by geography as at 30 April 20261
Top 10 holdings
Figure 3: IEM 10 largest holdings as at 30 April 2026
| Stock | Subsector | Country | As at 30/04/26 (%) | As at 31/03/25 (%) | Change(%) |
|---|---|---|---|---|---|
| Siemens Energy | Smart & efficient grids | Germany | 4.4 | n/a | n/a |
| Waste Connections | General waste management | United States | 3.5 | 3.3 | 0.2 |
| Air Liquide | Industrial energy efficiency | France | 3.5 | n/a | n/a |
| SSE | Renewable energy development | United Kingdom | 3.0 | n/a | n/a |
| Contemporary Amperex Tech | Advanced road vehicles & devices | China | 3.0 | n/a | n/a |
| KLA | Water efficiency | United States | 2.8 | n/a | n/a |
| Novonesis (Novozymes) | Sustainable agriculture | Denmark | 2.8 | n/a | n/a |
| Veolia Environnement | Water utilities | France | 2.8 | n/a | n/a |
| Littelfuse | Industrial energy efficiency | United States | 2.3 | n/a | n/a |
| Schneider Electric | Smart & efficient grids | France | 2.2 | n/a | n/a |
| Total of top 10 | 30.3 |
IEM has overhauled its list of top ten holdings in the past year. As shown in Figure 3, of the top ten on 31 March 2025, only Waste Connections is still on the list, with the other nine holdings being different. The managers have made big changes in an attempt to arrest recent disappointing performance.
Performance
IEM has struggled against the MSCI ACWI index, as shown in Figures 4 and 5. A strong year up to May 2021 has now fallen out of the five-year comparison and, though there have been some periods of steady performance since, generally the direction of relative returns has been downwards. This is due both to the very strong run in global equities, driven by technology companies falling outside IEM’s remit, in particular, as well as IEM’s investment style being out of favour. Rising inflation and interest rates from the end of 2021 were a particular headwind to growth-focused stocks, and inflationary concerns have also reemerged recently.
Figure 4: IEM performance relative to MSCI ACWI over five years ended 31 May 2026
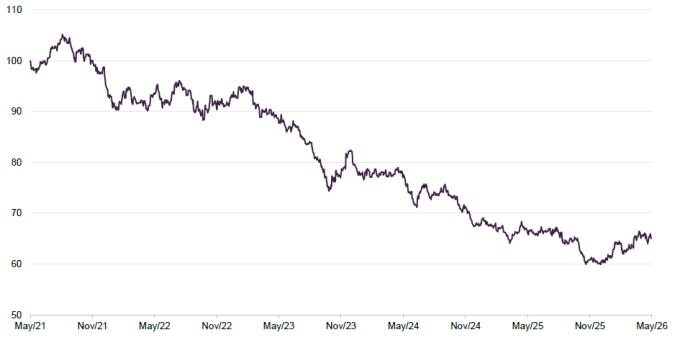
Figure 5: IEM cumulative returns for periods ending 31 May 2026
| 3 months(%) | 6 months(%) | 1 year(%) | 3 years(%) | 5 years(%) | |
|---|---|---|---|---|---|
| IEM price | 2.4 | 16.9 | 27.1 | 15.9 | 5.2 |
| IEM NAV | 9.2 | 19.3 | 28.2 | 23.3 | 20.6 |
| MSCI AC World Index | 7.6 | 11.6 | 30.7 | 68.2 | 85.5 |
Previous publications
Readers interested in further information about IEM may wish to read our previous notes (details are provided in Figure 6 below). You can read the notes by clicking on them below or by visiting our website.
Figure 6: QuotedData’s previously published notes on IEM
| Title | Note type | Date published |
|---|---|---|
| Sustainable long-term growth | Initiation | 3 June 2024 |
| Delayed but not derailed | Update | 3 December 2024 |
| Significant headwinds, but still value | Update | 8 May 2025 |
IMPORTANT INFORMATION
This marketing communication has been prepared for Impax Environmental Markets Plc by Marten & Co, which is authorised and regulated by the Financial Conduct Authority (FCA). It constitutes non-independent research as defined under the UK MiFID II regime and the onshored Commission Delegated Regulation (EU) 2017/565.
This communication is intended for use by investment professionals as defined in Article 19(5) of the Financial Services and Markets Act 2000 (Financial Promotion) Order 2005.
Marten & Co is not authorised to provide advice to retail clients. Accordingly, if you are not a professional investor, or are otherwise restricted from receiving this information, you should disregard it.
Charts and data are sourced from Bloomberg unless otherwise stated. Please read the important information at the back of this document. The note does not have regard to the specific investment objectives, financial situation and needs of any specific person who may receive it.
The note has not been prepared in accordance with legal requirements designed to promote the independence of investment research and as such is considered to be a marketing communication. The analysts who prepared this note are not constrained from
dealing ahead of it, but in practice, and in accordance with our internal code of good conduct, will refrain from doing so for the period from which they first obtained the information necessary to prepare the note until one month after the note’s publication. Nevertheless, they may have an interest in any of the securities mentioned within this note.
This note has been compiled from publicly available information. This note is not directed at any person in any jurisdiction where (by reason of that person’s nationality, residence or otherwise) the publication or availability of this note is prohibited.
Accuracy of Content: Whilst Marten & Co uses reasonable efforts to obtain information from sources which we believe to be reliable and to ensure that the information in this note is up to date and accurate, we make no representation or warranty that the information contained in this note is accurate, reliable or complete. The information contained in this note is provided by Marten & Co for personal use and information purposes generally. You are solely liable for any use you may make of this information. The information is inherently subject to change without notice and may become outdated. You, therefore, should verify any information obtained from this note before you use it.
No Advice: Nothing contained in this note constitutes or should be construed to constitute investment, legal, tax or other advice.
No Representation or Warranty: No representation, warranty or guarantee of any kind, express or implied is given by Marten & Co in respect of any information contained on this note.
Exclusion of Liability: To the fullest extent allowed by law, Marten & Co shall not be liable for any direct or indirect losses, damages, costs or expenses incurred or suffered by you arising out or in connection with the access to, use of or reliance on any information contained on this note. In no circumstance shall Marten & Co and its employees have any liability for consequential or special damages.
Governing Law and Jurisdiction: These terms and conditions and all matters connected with them, are governed by the laws of England and Wales and shall be subject to the exclusive jurisdiction of the English courts. If you access this note from outside the UK, you are responsible for ensuring compliance with any local laws relating to access.
No information contained in this note shall form the basis of, or be relied upon in connection with, any offer or commitment whatsoever in any jurisdiction.
Investment Performance Information: Please remember that past performance is not necessarily a guide to the future and that the value of shares and the income from them can go down as well as up. Exchange rates may also cause the value of underlying overseas investments to go down as well as up. Marten & Co may write on companies that use gearing in a number of forms that can increase volatility and, in some cases, to a complete loss of an investment.