
A unique approach to UK equities
JPMorgan UK Equity Core Active UCITS ETF (JUKE) is the only European active ETF focused entirely on UK shares. Now nearly four years old, it has proven its ability to outperform its benchmark, especially in the past year. This success comes from a benchmark-aware, bottom-up approach based on detailed research and quantitative analysis, with risk controls in place, aiming for steady long-term outperformance.
2026 may prove to be a good time to invest in UK equities, or to increase exposure to them. UK equities have lagged behind the US and global markets for much of the last decade, but sentiment has begun to shift. In 2025, UK shares outperformed, and JUKE delivered returns above its benchmark during this period.
Active exposure to UK equities
Launched in June 2022, JUKE provides low-cost, broad-based exposure to UK equities. Using a bottom-up, active approach, the managers adjust weightings based on fundamental research, seeking to outperform the benchmark, and, by extension, passive alternatives.
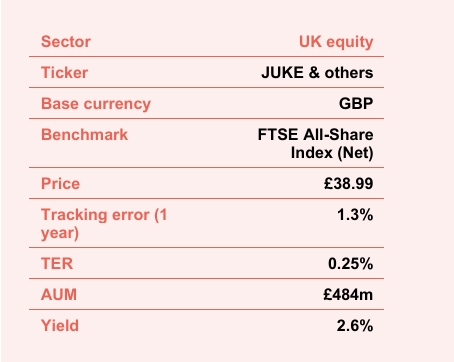
At a glance
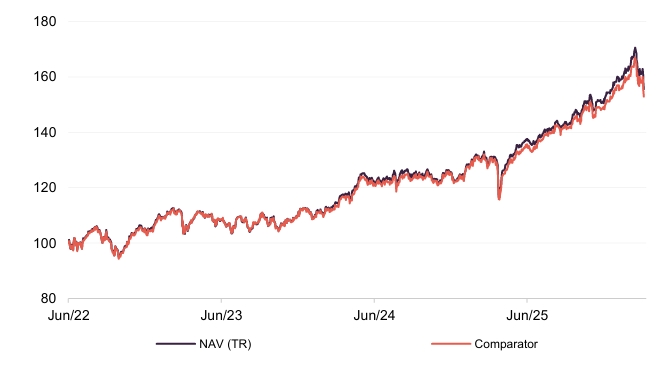
Performance since launch
JUKE’s performance tracks UK equities closely. However, it has proven able to deliver relative outperformance, after fees, particularly over the past year.
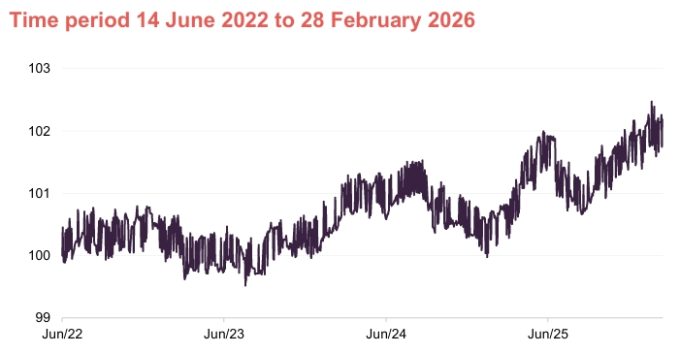
NAV TR relative to comparator
JUKE’s relative performance versus its comparator has generally trended higher since launch. This has been most pronounced recently, during a period of strength for UK equities.
| 12 months ended | NAV total return (%) | Comparator (%)1 |
|---|---|---|
| 29/02/2024 | 0.9 | 0.9 |
| 28/02/2025 | 17.9 | 17.7 |
| 27/02/2026 | 29.1 | 27.2 |
JUKE – the only pureplay way to access UK equity exposure through an active ETF
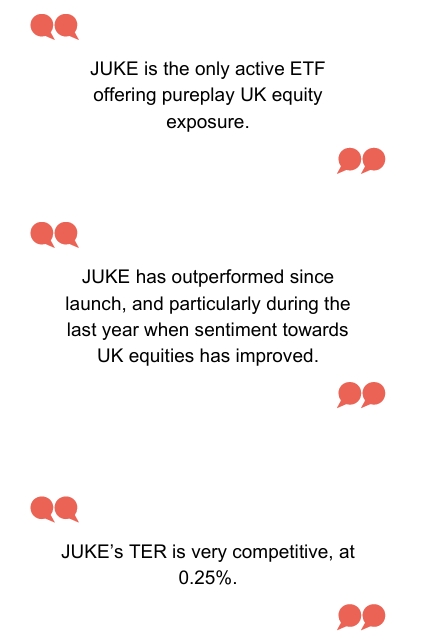
JUKE is the only active ETF, invested solely in UK equities, currently available.
JUKE stands out in the European active ETF market by offering access to a portfolio of UK shares, with no direct competitors at present. It addresses a gap for investors who previously had to choose between low-cost passive ETFs with no chance of outperforming the market, or traditional active funds with higher fees, less transparency and only daily trading. JUKE aims to offer a middle ground, combining aspects of both.
Since launch in 2022, JUKE has attracted net inflows every year, even as the wider UK equity sector has faced challenges.
Bottom-up stock selection combined with risk controls
Investors may wish to consult the fund’s website HERE
We met Callum Abbot, one of JUKE’s three portfolio managers, who explained the fund’s active, bottom-up investment approach. The process combines fundamental research with quantitative analysis, but all final decisions are made by a person.
JUKE is designed to be a core UK equity holding, suitable to sit alongside higher-risk funds or as an alternative to passive options. It is an “enhanced index” fund, that deliberately takes a low level of active risk.
The team believes that a portfolio that is cheaper than the market, higher-quality and with stronger momentum will outperform over time. Using JPMorgan Asset Management’s research resources, they rank all stocks in their universe by value, quality and momentum. They also consult regularly with JPMorgan’s internal and external analysts.
The managers avoid taking big market or macro bets. For example, if UK interest rates looked set to fall, they would not automatically favour the whole housebuilding sector, but might overweight specific preferred stocks.
JUKE aims to beat its benchmark by overweighting stocks with the most potential and underweighting those with less. The index around 550 stocks, while JUKE holds around 145. The fund is able to ignore many smaller stocks, as those outside the FTSE 100 make up less than 20 basis points of the total individually. The team avoids holding too many small positions, only including smaller companies when they have strong conviction.
To manage risk, the team uses several methods to prevent taking large, unintended bets that wouldn’t suit a core fund. All holdings are closely monitored for news that could affect their outlook. The portfolio is rebalanced monthly, trimming stocks that have become overweight after strong performance and increasing allocations to other favoured stocks.
A proprietary risk tool is used to assess factors like value versus growth and exposure to “AI losers,” helping to keep risks in line with the benchmark. Portfolio turnover is steady at around 2-3% per month, regardless of market volatility, as the team aims to keep the portfolio’s performance – relative to the benchmark – resilient to major events.
UK equities: an asset whose time has come?
The UK enjoyed an extremely strong 2025.
UK equities have recently rebounded, with indices hitting record highs and delivering strong returns in 2025. After years of trailing global benchmarks led by US tech giants, the UK market saw one of its best annual performances in decades, outperforming major peers.
This recovery is driven by a shift towards value and income stocks, areas where the UK has traditionally been strong. Investors have also started looking beyond large tech stocks, boosting sectors like financials, natural resources, and insurance, which make up a larger part of the UK market.
Figure 1 shows that from launch to the end of 2024, JUKE underperformed global equities due to the US market’s strength. However, in 2025 this trend reversed, continuing into early 2026 and bringing JUKE’s cumulative returns close to those of the MSCI World Index.
Figure 1: JUKE’s NAV total return relative to MSCI World Index, rebased to 100, since launch to 28
February 2026

Despite recent gains, the JUKE team notes that the UK market still trades at a large valuation discount to many other markets, with for example the US market at about a 50% premium to the UK. With forecast earnings growth above 10% over the next few years and a dividend yield near 4%, the team sees a strong case for good total returns from UK equities even without further re-rating. The UK market’s exposure to sectors like mining, energy and banks provides real diversification, and JUKE’s managers believe these sectors have further growth potential given their current position in their cycles.
Current overweight positions – examples
Serco
Serco is an outsourcing company supplying services to government in defence, transport, justice, health and immigration. The stock was first bought because it looked undervalued. Since then, Serco has won key contracts, boosting its share price. Although the valuation is now less attractive than it was, JUKE sees a positive momentum story for the stock.
Coca-Cola HBC
Coca-Cola HBC, formerly Coca-Cola Hellenic Bottling Company, is the third largest Coca-Cola bottler and operates in several European and other international markets. The JUKE team values the company’s strong presence in faster-growing developing markets where rising incomes and increasing urbanisation are boosting demand for soft drinks.
Domestic banks
UK domestic banks experienced an exceptional year of share price growth in 2025, but their valuations remain close to long-term averages, despite what JUKE’s manager sees as an above-average cycle for the sector. Interest rate exposure is hedged, so gains from higher rates are spread over time. The manager thinks that the banks seem to have more regulatory and political support than before, and despite UK economic challenges, there is still potential for volume growth in the sector.
Construction
The construction industry is now more disciplined, reducing its use of fixed-price contracts after previous costly setbacks. Investment in areas like new schools and hospitals remains strong, supporting healthy order books. Callum notes that companies like Morgan Sindall are also benefiting from increased demand for office fitouts as firms encourage employees to return to the workplace.
Current underweight positions – examples
REITS
The Real Estate Investment Trust (REIT) sector is very sensitive to interest rates, so the recent rises after years of near-zero levels is a challenge. JUKE’s manager also thinks the assets of many REITs are generally low quality, especially within retail and offices.
Beverage companies
Companies like Diageo have faced challenges recently. Some of this is cyclical, as consumers work through spirits bought during Covid, and higher prices from the pandemic now need incomes to catch up. There is also a longer-term question about whether people are drinking less alcohol and if this will continue. The JUKE team sees the evidence here as unclear, but this uncertainty is affecting the sector.
Structure
JPMorgan UK Equity Core Alpha is available on several exchanges (see Figure 2) and offers both distribution and accumulation share classes. All classes are priced in sterling.
Figure 2: JPMorgan UK Equity Core Active UCITS ETF, available exchanges
| Distribution | Accumulation |
|---|---|
| London Stock Exchange: JUKE LN | London Stock Exchange: JUKC LN |
| Cboe DXE (Chicago): JUKEX I2 | Cboe DXE (Chicago): JUKCX I2 1 |
| Tradegate (Deutsche Boerse): BBLE TH | Tradegate (Deutsche Boerse): BBLD TH |
| Swiss Exchange: JUKC SW |
Liquidity & spreads
Figure 3: Average daily liquidity and bid-ask spread of share classes, 12 months to 3 March 2026

Figure 3 shows that most trading happens in the two London share classes, which also have the lowest average bid-ask spread at under 0.3%. The other classes see less trading and usually have much wider spreads. For clarity, we refer to the fund as JUKE throughout this note, as most investors hold the distribution class.
Tracking error
JUKE’s tracking error is low.
JUKE’s one-year tracking error to 28 February 2026 was 1.3%, showing a small difference between its returns and the benchmark. This is low for an active ETF, even one using quantitative methods and holding stocks similar to the index. It indicates limited deviation from the benchmark, with some potential for modest outperformance.
Callum explains that the team uses a “risk budget” to manage how much they differ from the index, mainly through stock selection where they feel most confident. They maintain 30-50 basis points of active positions at stock and sector level, with an active share of 18-20%. Monthly rebalancing keeps JUKE’s risk in line with the team’s target.
Fees
JUKE’s fees are very competitive.
JUKE’s total expense ratio (TER) is 0.25%. This includes the management fee and costs for custody, administration, audit and regulation, all accrued daily and reflected in the NAV. It does not cover portfolio transaction costs or investor-level costs like bid-ask spreads and brokerage fees.
Callum describes JUKE as the lowest-cost way to access JPMorgan’s active UK funds. While JUKE’s TER is higher than passive ETFs, which usually charge 0.12% to 0.22%, its active management makes the fee competitive.
Top 10 holdings
JUKE’s top ten holdings are the same as the benchmark’s.
JUKE’s top 10 holdings are the same as the benchmark but with different weightings. The fund is most overweight to Shell and Rio Tinto, and most underweight in Unilever. Its top 10 holdings are slightly more concentrated than the index, and this is seen across the whole portfolio: JUKE holds around 145 stocks compared to around 537 in the benchmark, with 240 in the wider financials sector.
This report uses the Vanguard FTSE All Share Index Unit Trust income units, which track the FTSE All-Share Index.
Figure 4: Top 10 holdings as at 31 January 2026
| Holding | Sector | Allocation 31 January 2026 (%) | Comparator(%) | Relative |
|---|---|---|---|---|
| HSBC | Banks | 8.0 | 7.8 | 0.2 |
| AstraZeneca | Pharmaceuticals | 7.3 | 7.2 | 0.1 |
| Shell | Oil & gas | 6.0 | 5.7 | 0.3 |
| Rolls-Royce Holdings | Aerospace & defence | 3.8 | 3.6 | 0.2 |
| Unilever | Personal care | 3.4 | 3.8 | (0.4) |
| British American Tobacco | Tobacco | 3.2 | 3.3 | (0.1) |
| GSK | Pharmaceuticals | 2.9 | 2.7 | 0.2 |
| Rio Tinto | Industrial metals & mining | 2.8 | 2.5 | 0.3 |
| BP | Oil & gas | 2.7 | 2.6 | 0.1 |
| Barclays | Banks | 2.5 | 2.4 | 0.1 |
| Total of top 10 | 42.6 | 41.6 |
Asset allocation
JUKE’s sector allocation is more varied than usual for an “index plus” active ETF, though it remains broadly in line with the benchmark. As shown in Figure 5, the fund is overweight in 10 of the 11 largest sectors, with only the gas, water and multi-utilities sector underweight. This is balanced by a 3.6% underweight in the broad “others” category.
Figure 5: JUKE sector allocation as at 31 January 2026

Figure 6: JUKE sector allocation relative to comparator (%)

Performance
Relative performance has been strong, particularly recently.
Figure 7 shows that JUKE has slightly outperformed its comparator. Returns were similar to the index for the first 18 months after launch, but from early 2024 and through most of 2025, JUKE pulled ahead. In April 2025, JUKE saw a marked boost in performance following President Trump’s “Liberation Day” tariff announcements, which caused significant market volatility.
Peer group
JUKE is the only European active ETF focused mainly or entirely on UK shares, so there is no direct peer group for comparison.
Figure 7: JUKE’s NAV total return relative to comparator, rebased to 100, since launch to 28
February 2026

Figure 8: Cumulative total return performance over periods ending 28 February 2026
| 1 month (%) | 3 months (%) | 6 months (%) | 1 year (%) | 3 years (%) | |
|---|---|---|---|---|---|
| JUKE NAV | 6.4 | 12.5 | 20.1 | 29.1 | 53.5 |
| Comparator | 6.0 | 12.1 | 18.3 | 27.2 | 51.1 |
| Relative performance | 0.4 | 0.4 | 1.8 | 1.9 | 2.4 |
Per Figure 8, JUKE has outperformed the index across all time periods shown, from one month up to three years, supporting the case for active management.
Dividends
All income is returned to shareholders.
JUKE offers both income and accumulation share classes. It passes on cash dividends from its investments to shareholders, either as payouts or reinvested income, rather than keeping income in the fund. Dividends for the income class are usually paid quarterly.
The latest dividend was 18.93p per share, paid on 6 February 2026, after previous payments of 23.9p in November, 31.24p in August, and 27.83p in May. Total distributions for the year were 101.9p per share, giving a yield of 2.6% on the price of £38.99 on 20 March. Investors should be aware that JUKE’s yield can sometimes be higher or lower than the index.
Management
JUKE is a sub-fund of the JPMorgan ETFs (Ireland) ICAV, which has separate liability between its sub-funds. It is managed by Callum Abbot (14 years at JPMorgan), Christopher Llewelyn (41 years), and Richard Morillot (16 years), bringing significant experience. Callum and Richard focus on choosing stocks, while Chris handles implementation.
The team is part of the international equity group, which includes 76 investment professionals. They share research through JPMorgan’s Spectrum platform, encouraging collaboration across analysis and company meetings.
J.P. Morgan Asset Management, part of JPMorgan Chase & Co., manages the fund. The firm is a major global investment manager, operating in both developed and emerging markets with platforms in the UK, Europe, the US, and Asia. It manages a wide range of assets and offers active, index and alternative strategies. Oversight, risk management, and compliance are built into JPMorgan Chase’s group-wide controls.
A portion of JUKE’s managers’ deferred pay is invested directly into the funds they manage.
Important Information
This note is for information purposes only and is not intended to encourage the reader to deal in the security or securities mentioned within it. Marten & Co is not authorised to give advice to retail clients. The research does not have regard to the specific investment objectives financial situation and needs of any specific person who may receive it. The analysts who prepared this note are not constrained from dealing ahead of it but, in practice, and in accordance with our internal code of good conduct, will refrain from doing so for the period from which they first obtained the information necessary to prepare the note until one month after the note’s publication. Nevertheless, they may have an interest in any of the securities mentioned within this note. This note has been compiled from publicly available information. This note is not directed at any person in any jurisdiction where (by reason of that person’s nationality, residence or otherwise) the publication or availability of this note is prohibited.
Accuracy of Content: Whilst Marten & Co uses reasonable efforts to obtain information from sources which we believe to be reliable and to ensure that the information in this note is up to date and accurate, we make no representation or warranty that the information contained in this note is accurate, reliable or complete. The information contained in this note is provided by Marten & Co for personal use and information purposes generally. You are solely liable for any use you may make of this information. The information is inherently subject to change without notice and may become outdated. You, therefore, should verify any information obtained from this note before you use it.
No Advice: Nothing contained in this note constitutes or should be construed to constitute investment, legal, tax or other advice.
No Representation or Warranty: No representation, warranty or guarantee of any kind, express or implied is given by Marten & Co in respect of any information contained on this note.
Exclusion of Liability: To the fullest extent allowed by law, Marten & Co shall not be liable for any direct or indirect losses, damages, costs or expenses incurred or suffered by you arising out or in connection with the access to, use of or reliance on any information contained on this note. In no circumstance shall Marten & Co and its employees have any liability for consequential or special damages.
Governing Law and Jurisdiction: These terms and conditions and all matters connected with them, are governed by the laws of England and Wales and shall be subject to the exclusive jurisdiction of the English courts. If you access this note from outside the UK, you are responsible for ensuring compliance with any local laws relating to access.
No information contained in this note shall form the basis of, or be relied upon in connection with, any offer or commitment whatsoever in any jurisdiction.
Investment Performance Information: Please remember that past performance is not necessarily a guide to the future and that the value of shares and the income from them can go down as well as up. Exchange rates may also cause the value of underlying overseas investments to go down as well as up. Marten & Co may write on companies that use gearing in a number of forms that can increase volatility and, in some cases, to a complete loss of an investment.