 Outperforming and attractively valued
Since QuotedData’s last note on JPMorgan Russian Securities (JRS), Russia has been among the best-performing equity markets globally, despite being out of favour with international investors. The RTS Index has climbed above its 2014 pre-Crimea levels, before sanctions were imposed. Although economic growth has disappointed in 2019, earnings and dividend pay-out ratios continue to grow. At a trailing price-earnings (P/E) ratio of just 6x, the Russian market remains extremely cheap.
JRS’s underlying portfolio has a 7% dividend yield, according to its longstanding manager, Oleg Biryulyov. He adds that the Russian market is showing signs of becoming less sensitive to movements in energy prices.
Growth from a diversified Russian portfolio
The company’s objective is to maximise total return through investment predominantly in Russia, with distribution of income dependent upon levels received. Up to 10% of the portfolio can be invested in companies located in former republics of the Soviet Union. The portfolio is fairly concentrated (typically between 25 and 50 positions). JRS is permitted to use gearing (borrowing), but has not done so for some years.
Fund profile
JPMorgan Asset Management (JPMAM) is one of the world’s largest asset managers. Its Emerging Market and Asia Pacific equities team consists of over 90 investment professionals, including the manager Oleg Biryulyov (Oleg). As at 10 September 2019, the team managed in excess of $104.6bn for clients globally. Oleg is a Russian native. He has been with JPMAM and its predecessors since 1994, has been managing JRS since it was launched in 2002, and managed a precursor to JRS from 1998. He is assisted by Habib Saikaly in managing JRS’s portfolio.
JRS aims to generate capital growth for its shareholders by investing in a portfolio that consists predominantly of quoted Russian companies. It is also permitted to invest up to 10% of its portfolio in companies that are outside of Russia but are located in the former Soviet republics.
Blended benchmark
JRS switched its benchmark from MSCI Russia 10/40 Index to the RTS Index with effect from 1 November 2016. QuotedData has used a blend of the two indices within this report (as JRS does in its communications with shareholders). The reason for the change in benchmark was that RTS is a much broader index than the MSCI 10/40 and the manager believes that the RTS Index better represents the universe that this portfolio is selected from.
Manager’s view
Russian stocks were among the strongest performers globally over the first half of the year; when QuotedData’s analyst met Oleg in mid-June, he said that only the relatively illiquid Greek market had performed better. The RTS Index has climbed above its pre-Crimea 2014 levels (before sanctions were imposed), though the Index remains well below its pre-2008 level.
Oleg says this strong-returns environment has coincided with a period of relatively low interest from foreign investors. Perhaps reflecting a mix of factors, including tempered interest in Russia post 2014 as international investors largely remained on the side-lines, local Russian investors have become bigger participants in the market.
The sanctions created an environment where, as prices fell, many fundamentally sound businesses traded at very high dividend yields. Oleg told us that yield on JRS’s portfolio was approaching 7%. Earnings and pay-out ratios continue to grow. This is a major recurring theme – Oleg says that the team are seeing it in almost all company presentations and reports.
Economic growth has disappointed in 2019
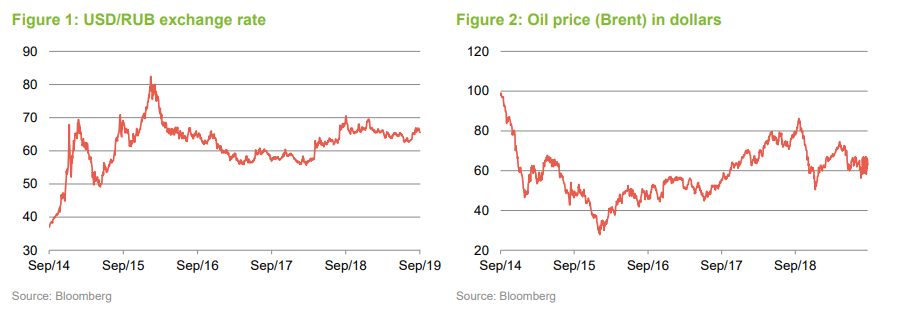
As important as oil is to Russia, Oleg says that in terms of the stock market, there has been evidence of equities becoming less sensitive to movements in energy prices. Despite the strong leg-up in oil prices at the start of the year (oil prices have since come down), the price level remains lower than a year ago. Over the same period, the rouble has strengthened against the US dollar (it has appreciated by 5.8% over the year-to-date) and the RTS Index has increased by 21.8%.
Political relations between Russia and the West have proven to be relatively benign over recent months, as the spotlight has shifted to the US and China’s trade dispute. This has allowed Russian assets to largely move forward relatively unencumbered by events elsewhere.
However, at the macroeconomic level, the performance of the economy has disappointed over recent months. Russia only returned to positive economic growth in 2017 and, after an encouraging 2018, real (inflation-adjusted) GDP growth might have been expected to register more than the 0.5% recorded over the first quarter of 2019. An increase in the rate of VAT has dampened spending by households, many of which continue to feel the effects from five successive years of declining real incomes. Deflation in food prices (food accounts for around 40% of most household budgets) has provided some respite to consumers, although, as we discuss later, this continues to be unhelpful to the food retail sector.
Employment levels have bounced back strongly since the nadir of early 2016, with data reported by the Federal State Statistics Service showing an unemployment rate of 4.5% for July 2019. The figure was a slight drop from mid-2018, which aligns with the view that the economy has lost some momentum.
With inflation at 4.6% in July (low against long-term averages but more than 2% higher than last year), the central bank has some room to trim interest rates to try and restore momentum to the economy – a recent 0.25% cut has reduced the interest rate to 7.25%. It seems plausible that rates are likely to be trimmed by at least another 0.25% before the end of the year.
That said, it is unlikely that domestic demand-focused companies will drive returns for JRS over the next 12 months; export-oriented businesses are expected to carry the baton. Russia’s food retailing sector, led by Magnit and X5, was one of, if not the fastest-growing in the world a few years back. Over recent times, Oleg says that the sector has been heavily affected by food price deflation and the declines in real incomes.
Oleg says that over the past three years it has been a priority of the government to rebuild foreign reserves, which it has succeeded in doing – they are over $500bn – they were under $400bn two years ago.
Oleg also added that for the participation of domestic institutional investors to increase markedly, the equity market needs to evolve beyond a predominant bias to energy-related companies and dividend plays.
Ukraine gas transit contract coming to an end
Despite the political rhetoric, Oleg says that the presidential election in Ukraine passed without any real problems. There were no major surprises as populist ideas succeeded, in keeping with the global trend. Volodymyr Zelensky, a comedian, was sworn in as President in May. During his swearing-in, he announced a snap general election, which his ‘Servant of the People’ party won in July with the first single-party majority in modern Ukrainian history.
Oleg added that whilst Ukraine was still Russia’s largest trading partner by some distance, this may change as Gazprom prepares to stop channelling gas through Ukraine. The contract that directs the passage of Russian gas via Ukraine ends on 31 December 2019. Talks on the transit contract are expected to take place in September. Russia’s transit diversification strategy has led to it investing billions of dollars into pipelines that allow it to reach Western Europe without passing through Ukraine.
Oleg says that, in the meantime, Gazprom is shipping as much as it can. He expects the Nord Stream 2 pipeline to be finalised one way or another by the summer of 2020. Nord Stream 2 will for the most part follow the same route as Nord Stream, across the Baltic Sea.
Structural discount persists
Even accounting for the stock market’s strong recent performance, it remains at a structural discount to most peers. Oleg says that high-dividend yields have effectively acted as price floor for many companies; a lot of fundamentally sound companies have traded at high yields. The trailing price/earnings ratio for the Russian market stands at about 5.5x, which as Figure 3 shows, is a substantial discount to global equities.
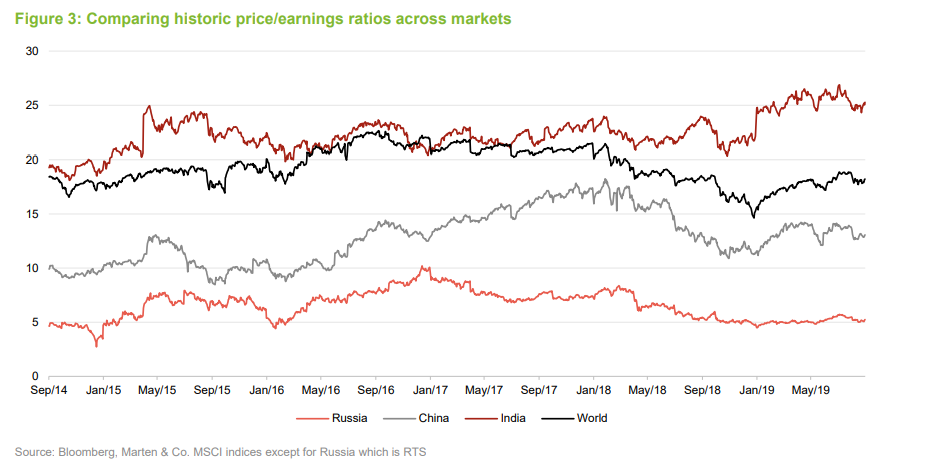
Oleg says that Russia’s long-standing structural valuation discount, specifically to many emerging markets, reflects factors such as its concentrated exposure to the oil and gas sector. In his view, Russia has not developed enough consumer-focused companies, particularly in the technology sector. That said, Oleg adds that it is harder to explain the relative ‘cheapness’ of the commodities companies. We note that Gazprom trades at a trailing price/earnings ratio of 3.1x, as at 9 September 2019. The discounts applied to the commodities companies could reflect concerns over corporate governance standards and political interference.
Investment process
The manager seeks to identify attractively-valued companies with sustainable above-average returns. The investment approach for JRS is based on JPMorgan’s emerging market investment process. JPMAM’s global team is responsible for producing a macroeconomic outlook for each country and region. JPMAM also has a large team of researchers that is looking at companies on a sector basis across all regions of emerging markets. Over 20 of the team are involved in research on Europe, the Middle East and Africa (EMEA) stocks. They help maintain JPMAM’s comprehensive in-house research database. Oleg, in addition to being the lead manager on JRS, is head of EMEA within JPMAM.
Oleg visits Russia at least once a year but he also sees many companies when their representatives come to London. He says that accounting accords with international standards and he thinks that corporate governance has improved, in general.
JPMAM analysts submit ideas for Oleg’s approval and he has final say over what goes into the portfolio. The analyst reports review each stock in great detail, looking at a range of measures including return on equity (ROE), which they want to be sustainable – this includes an assessment of how capital intensive the business is; cash generation; the strength of the balance sheet; and how sensitive the company is to inflation. They will also examine the durability of the company’s business, corporate governance standards and ESG (environmental, social and corporate governance) attributes.
Oleg wants to hold companies that look attractive across a range of factors. Returns are derived from earnings growth and dividends, which are within the control of the company, and valuation multiple changes and currency moves, which come from changes in market sentiment. JPMAM prefers companies that it believes can benefit from each of these. Stocks are assessed for inclusion within the portfolio on the basis of predicted returns. The predicted return is derived from a predicted exit price/earnings ratio and an internal forecast of returns over the next five years (returns are expected to normalise after year three).
Oleg breaks down the portfolio into ‘trading’ stocks that he will move in and out of on valuation grounds, ‘quality’ stocks that will form the core of the portfolio as long-term holdings, and ‘premium’ stocks – the crème de la crème. Turnover works out to about 25% to 35% per annum.
Risk control
There is a 98-question checklist that has to be completed on each stock. This risk profiling produces ‘red flag’ reports that highlight areas of potential concern. In Oleg’s experience, mining and oil & gas sector companies tend to generate more red flags than most other companies. He prefers private companies to ex-state-owned enterprises (he believes that private companies are better managed), but he acknowledges that the state is more involved in the corporate world than it has been.
In addition:
- No more than 10% of gross assets are to be invested in companies that operate or are located in former Soviet Union republics (excluding Russia).
- JRS will not normally invest in unlisted securities.
- No more than 15% of gross assets may be invested in any one company (at the time of purchase).
- JRS will not normally use derivatives.
- No more than 15% of gross assets are to be invested in other UK-listed investment companies.
Oleg says that, whilst the economic sanctions that were put in place in 2014 had no impact on the management of the portfolio, changes to sanctions required JRS to sell its holding in Rusal in April 2018. The manager undertakes regular checks of holdings to ensure compliance, and reports to the board.
Investment universe has been shrinking
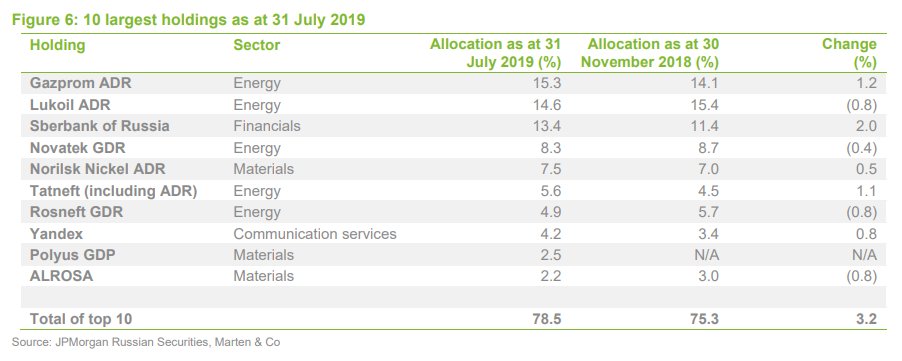
The universe of stocks that are suitable for inclusion within JRS’s portfolio is relatively small. JRS will typically have between 20 and 50 stocks, yet no more than 15% of the portfolio can be invested in any one stock at the time of purchase. Liquidity can be quite low, especially in smaller market-cap companies.
JRS is permitted to have up to 10% in cash and gearing of up to 15%, but gearing has not been used in the portfolio for some years (see capital structure on page 15 in the attached PDF note).
Asset allocation
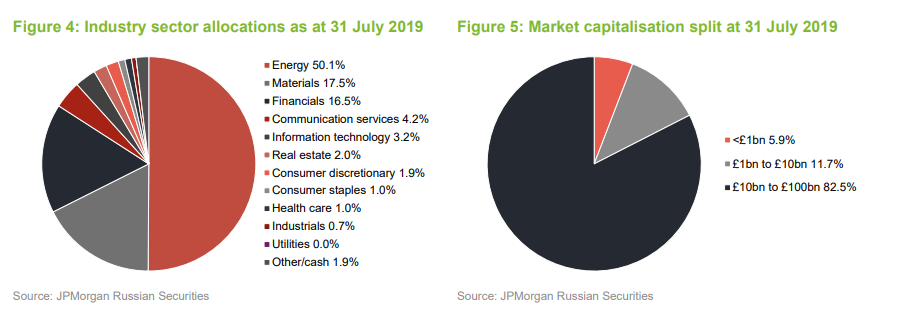
There were 32 companies in JRS’s portfolio at the end of June 2019.
Industry sector breakdown
Over the period since we last published on JRS, turnover in the portfolio has been low, in the single-digits; Oleg has mostly trimmed some exposures, including selling some of the holding in Gazprom. Gazprom shares have increased by nearly 40% since the middle of May, which saw the holding exceed 15% of the portfolio; Oleg felt it prudent to reduce the position.
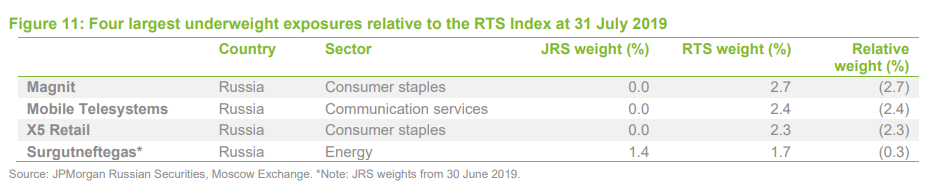
Following the trimming, energy accounted for 50.1% of the sector allocation at the end of July, which was 0.5% less than the benchmark. The biggest underweight exposure was to consumer staples, which comprised just 1% of the JRS portfolio and was 3.7% lower than the benchmark allocation. Oleg believes that food retailing, in particular, is hamstrung by persistent food deflation and intense competitive rivalry. The holding in Magnit, the food retailer, which was 7.3% of the portfolio back in July 2017, has been sold in its entirety over the past year. The manager believes it will take up to two years for the sector’s outlook to improve. The largest overweight exposure relative to the index is to information technology.
Since QuotedData’s last note, the allocations to materials, financials and information technology have increased. In materials, Oleg significantly increased the fund’s exposure to Polyus GDR, Russia’s largest gold producer and a top-10 producer globally. Elsewhere, JRS has increased its exposure to Sberbank. Also, within financials, JRS initiated a position in Qiwi, a payment services company.
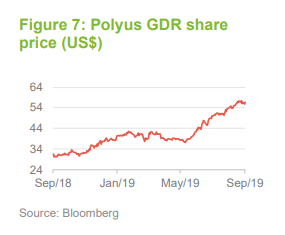
Top 10 holdings
Many of the names in Figure 6, which shows JRS’s top 10 holdings as at 31 July 2019, will be familiar to readers of our previous research on JRS. In part reflecting the underlying market in which it invests, JRS’s portfolio is concentrated and low turnover; turnover works out to about 25% to 35% per annum.
When comparing JRS’s top 10 holdings at the end of July 2019 and at the end of November 2018, a key change is the entry of the gold producer, Polyus GDR. Elsewhere, the manager sold the utilities company Inter RAO, the 10th-largest holding last November. Oleg told us that utility companies are required to pay out substantial dividends and, with the government now asking them to take on capital intensive projects, the sector is squeezed. He expects the sector’s outlook to take up to 10 years to improve. The very strong performance of Gazprom’s share price over the year-to-date has pushed it above Lukoil as the largest holding.
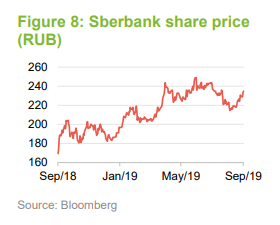
Polyus GDR (2.5%)
Polyus (polyus.com/en/) is the largest gold producer in Russia; the company is involved in the extraction, refining and sale of gold. In global terms, Polyus is a top 10 producer with one of the lowest cost profiles. The company says that it holds the world’s second largest gold reserves with 68m ounces of proven and probable gold reserves underpinning its strong growth profile. Gold has been performing very well over recent months, as appetite for safe-haven exposure increases. While gold does not pay any income, it is seen as a strong diversifier and is fairly uncorrelated with a lot of asset classes. It has been considered valuable for thousands of years. Oleg told us that Polyus was very attractively priced when JRS significantly increased its holding – the shares have performed very well over the past two or three months, particularly. The managed added that compared to most other metals and mining companies in Russia, Polyus benefits from a larger chunk of its costs being domestically based; the Russian central bank has actively been buying gold, which has also been benefitting the company.
Sberbank (13.4%)
The biggest absolute increase in the holdings came from Sberbank (www.sberbank.ru). The bank has a monopoly in Russia, holding 60% of banking system assets and 85% of the profit pool. It had been hit by the tightening in sanctions since the Skripal poisoning in Salisbury in March 2018 – the company’s share price had a particularly poor 2018. They have since come back strongly and the company recently exceeded earnings consensus over its second quarter; the retail lending business has been performing particularly well. As Oleg told us in the meeting, Sberbank has more than half of Russia’s gross banking assets and an even greater share of the profit pool.
Gazprom (15.3%)
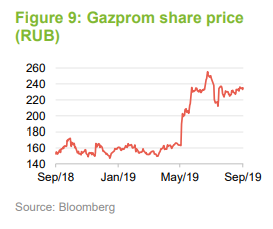
The Gazprom (www.gazprom.com) holding has performed extremely well over 2019 (up about 45% by mid-August). The company’s net income was up 44% year-on-year over the first quarter of 2019, on account of higher gas prices having a greater impact than the decline in gas export volumes. Gazprom has increased its dividend to a record level over 2019 and has said it will base future pay-out calculations on a more transparent approach, based on financial performance. Its CEO, Alexey Miller, has been actively re-shuffling senior management and the company has been revising up estimates. Looking ahead, JRS expects energy prices to remain around current levels with possible upside. This would support their holding in Gazprom and most of the other energy holdings, where a number of stocks are underpinned by high dividend pay-outs and attractive valuations.
Underweight and overweight exposures
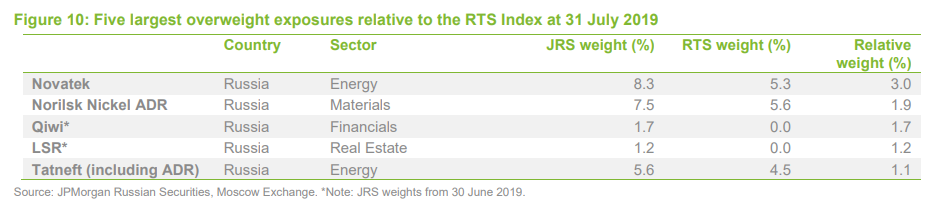
Novatek (8.3%)
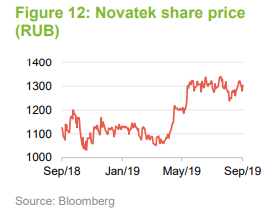
Novatek (www.novatek.ru/en/) is the largest liquified natural gas (LNG) producer in Russia and among the top 10 globally. It is thought to be the lowest cost producer in the industry and historically has benefitted from weakness in the rouble. The company’s share price has performed very well over recent months, with a prime catalyst being the sale of a stake in an Arctic gas liquefaction project to Total; Novatek has also benefitted from higher gas prices. The company reported a net profit of RUB451bn for the six-month period to 30 June 2019, which was a close to six-times increase year on year.
Yandex (4.2%)
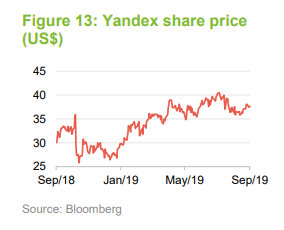
Yandex (www.yandex.ru) is a Russian information technology company that Oleg describes as being Russia’s Google in the internet sphere. Oleg says that the company, whose stock is not a component of the MSCI Russia Index, has a compelling ecosystem of services (for example, video, music, consumer cloud, taxi services, car sharing, car software, e-commerce, payments, business and consumer cloud services, and AI services/smart speaker). The company owns Russia’s leading online advertising platform and an online (Uber-like) taxi service, both of which, it says, benefit from large economies of scale and low incremental costs. It also, in the manager’s opinion, has excellent mapping software. Oleg believes that in Russia, Yandex can sustain its advantage over Google due to its greater focus, wide ecosystem of services and a ‘friendly’ regulator. He says that Yandex, as a private sector company, benefits from an opportunistic management mindset with a well-aligned CEO who has a large part of his personal wealth invested in the company. He also said that the company has been evolving its business; it has taxi links as well as other bolt-on businesses like food delivery and is exploring driverless cars too.
Qiwi (1.7%)
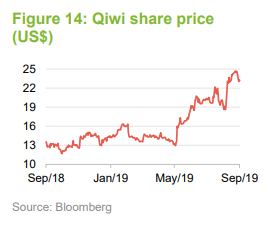
Qiwi (investor.qiwi.com/investor-relations) is a new addition to the portfolio. Oleg describes the company as being somewhat comparable to PayPoint in the UK. The manager saw a value opportunity in the company and believes the company’s growth model of using the cash-generative payments business to fund expansion into associated businesses, such as electronic banking and remittance products, works well. Qiwi had a strong 2018, fuelled by Russia’s hosting of the World Cup, and has a near monopoly in betting. The stock had sold off previously after the founder took a year’s sabbatical; he is now back at the helm and has turned the company around. Oleg says that cash generation of the payments business is allowing Qiwi to invest into new product lines. New businesses include a business small-medium enterprise bank and a remittance-based service.
Portfolio characteristics
As noted in our May 2018 note, JRS’s portfolio bears a considerable resemblance to the RTS Index with the exception perhaps of its higher return on equity than the average stock in the RTS Index. JRS’s portfolio is also more concentrated. This is consistent with JPMorgan Asset Management’s (JPMAM’s) investment approach for JRS. Given the small number of stocks in the benchmark, it is not surprising that the active share and tracking errors are lower than might be the case for JPMAM funds in other markets (JPMAM is targeting active shares of 50%–60% in India and China, for example). Oleg feels that it is hard to get the fund’s active share much higher, given the high index concentration and relatively limited opportunity set. However, JRS’s portfolio is distinctly different from its benchmark and it should be noted that Oleg has sufficient room to avoid companies or areas of the market that he does not like. He excludes companies facing sanctions and avoids companies where he considers corporate governance standards to be too low. He also avoids sectors that have structural difficulties that he feels are not adequately reflected in the price. A good example of a sector that he is currently avoiding is food retailing, where JRS currently has no exposure to either of the two big retailers, X5 and Magnit, which between them, account for about 5% of the RTS Index.
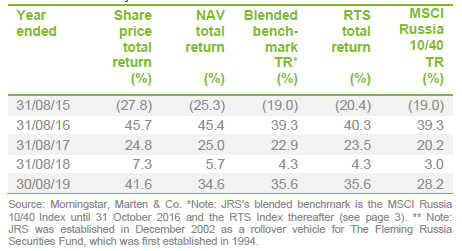
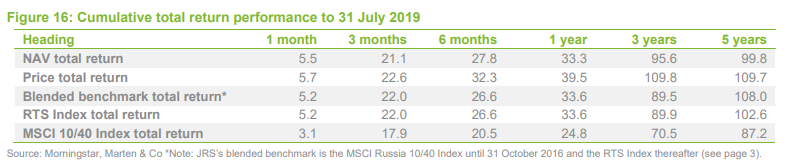
Performance
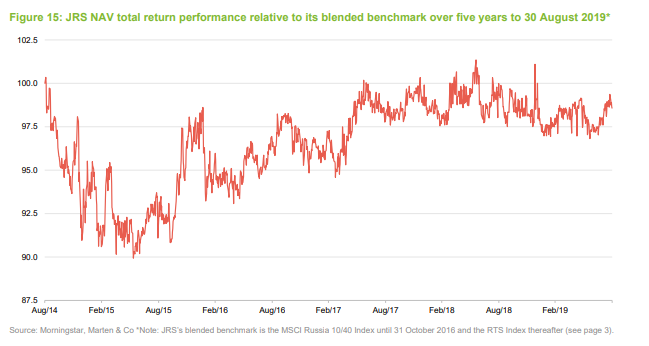
JRS has outperformed its benchmark over most time periods but, as is evident in Figure 15, 2014 was a difficult year for the company as Russia was hit both by sanctions and the collapse in the oil price. It is apparent from the figures below that the RTS Index provides a more challenging comparator than the MSCI 10/40 Index (the returns of the RTS are greater than those of the MSCI Index over all of the time periods provided), validating the decision to change the reference benchmark (if it was still being compared against the MSCI Russia Index, JRS would be outperforming). In earlier meetings with the manager, he attributed most of the fund’s significant episodes of underperformance (in 2008, 2011 and 2014) to its small cap exposure. With small cap exposure having decreased over recent years, this should be less of a problem than it has been in the past.
Oleg told us that within JRS’s existing holdings, other than the materials company Alrosa, more or less all of the other portfolio holdings were up over the year-to-date. Alrosa is the world’s biggest diamond producer; it has had to significantly dial down its sales and profit forecasts as ongoing US/China trade tensions weigh heavily on precious metals spending in China.
In addition to some of the largest holdings, including Gazprom and Sberbank, the portfolio’s exposure to Tatneft – a vertically integrated oil & gas company – boosted relative returns. The company recorded better-than-expected first-quarter 2019 results on the back of lower costs and slightly higher realised prices for refined products. Elsewhere, in the month of June 2019, exposure to LSR (which is not a constituent of the benchmark), a leading real estate developer in Russia, was a leading contributor to relative returns. The company has benefited from rising real estate prices in St. Petersburg and Moscow.
On the negative side in June, JRS’s lack of exposure to Mobile TeleSystems, a communication services company, dragged on relative returns. The company had a strong first quarter and its Ukrainian business has been performing well of late.
Dividend
Income generation does not form part of JRS’s objective; instead it is a residual effect of the manager’s stock selection. Nevertheless, in recent years the Russian stock market has delivered reasonable levels of income and the board reports that current forecasts estimate that this will continue. Reflecting this, JRS began making dividend payments in 2013. It typically pays an interim dividend in October and a final dividend in March of each year.
The management fee is charged against 20% to income and 80% to capital. All other expenses are charged to the income account. Subject to there being sufficient income available, JRS pays two dividends annually for a given financial year; an interim on October and a final in March.
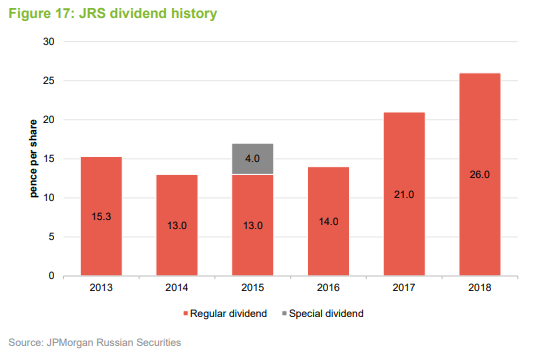
Over the course of the accounting year that ended on 31 October 2018, JRS generated revenue of 29.58p per share (up from 23.97p in the year ended 31 October 2017). The total dividend for the 2018 year of account period includes an interim dividend of 20p paid in October 2018 and a final dividend of 6p paid in March 2019. The total dividend of 26p is equivalent to a yield of 3.8% on the share price of 693p as at 11 September 2019.
Figure 17 shows how JRS’s dividend payments have evolved in recent years. The special dividend in 2015 related to one-off profits made by companies on their foreign exchange exposure – the rouble fell sharply against other currencies in that period.
The revenue reserve after the payment of the final dividend was £6.2m (2017: £3.9m).
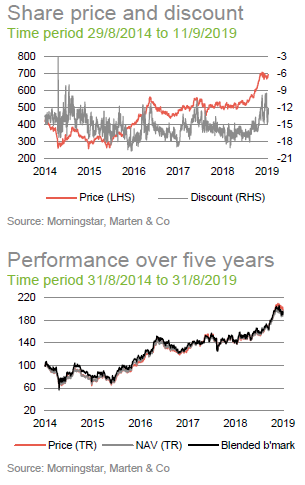
Discount
Figure 18 shows how JRS’s discount to NAV has moved over the past five years.
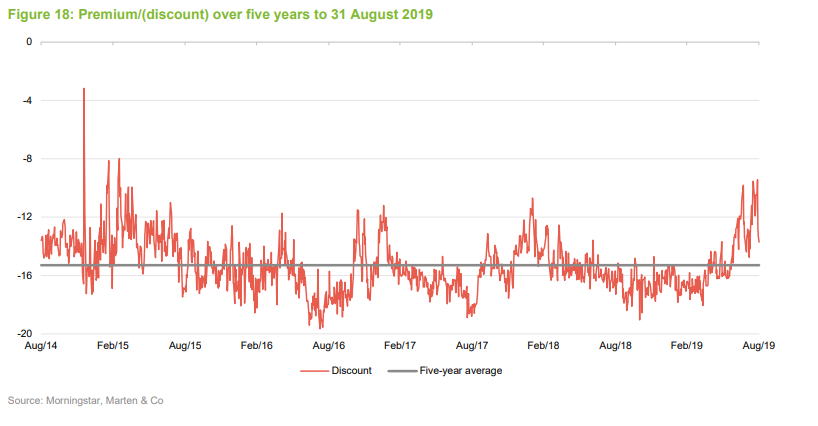
Over the 12-month period to 31 August 2019, JRS’s discount moved within a range of 9.4% to 19.0%. As at 11 September 2019, the discount was 13.8%. As illustrated in Figure 18, the discount has been on a narrowing trend, with Russia’s stock market among the best-performing in the world over the year-to-date.
The board is aiming to repurchase at least 6% of issued share capital each year
Within its annual results announcement on 23 January 2018, JRS’s board said that it had agreed, subject to market conditions, that it would increase JRS’s buy-back activity with a view to buying back at least 6.0% of the trust’s issued share capital each year. This provides investors with some indication of the level of purchase activity they should ordinarily expect.
The repurchases are also providing a greater amount of liquidity for shareholders who wish to exit and increase the net asset value for remaining shareholders. Furthermore, JRS is of sufficient size that the impact on remaining liquidity (from a smaller number of shares in issue) and on the ongoing charges ratio (by spreading JRS’s fixed costs over a smaller asset base) should be minimal with the benefits of the repurchases more than outweighing the costs.
Performance-related tender offer in 2022
It is also noteworthy that JRS has a continuation vote in 2022 (the last was passed at the March 2017 AGM). If the 2022 continuation passes, the board has committed to providing shareholders with a tender offer if, over the five years from 1 November 2016, JRS’s NAV total return on a cum income basis is less than the total return of the benchmark (all in sterling equivalent terms). If triggered, the tender will be for up to 20% of JRS’s outstanding share capital, the tender price being NAV less the costs of the tender and less a discount of 2%. The tender will therefore increase the NAV for remaining shareholders while allowing exiting shareholders to get a price close to NAV.
Fees and costs
The manager and company secretary to the company is JPMorgan Funds Limited (JPMF). Portfolio management is delegated to JPMorgan Asset Management UK Limited (JPMAM).
JPMF is entitled to a management fee of 1% per annum of JRS’s net assets. The fee is calculated monthly in arrears. There is no performance fee and the management contract can be terminated by either party with 90 days’ notice.
The ongoing charges for the year ended 31 October 2018 were 1.33% (2017: 1.33%). This included £214,000 of administration expenses (up from £184,000 for 2017), £150,000 of safe custody fees (up from £146,000 for 2017) and £142,500 for directors’ fees (unchanged from 2017).
Capital structure and life
JRS has a simple capital structure with one class of ordinary share in issue, and no other classes of share capital. Its ordinary shares have a premium main market listing on the London Stock Exchange and, as at 11 September 2019, there were 47,008,234 in issue with none held in treasury. Its year end is 31 October and its AGMs are usually held in March.
JRS may hold up to 10% in cash and gearing (borrowing) is permitted by the board up to a maximum limit of 15%, both in normal market conditions. However, the company currently has no borrowing facility in place.
JRS does not have a fixed life, but every five years, shareholders are asked to approve the continuation of the company. A resolution that the company continue as an investment trust will be put to shareholders at the AGM in 2022 and every five years thereafter.
Board
The board comprises five non-executive directors, all of whom are considered to be independent from the manager and none of whom sit on other boards together. There is no senior independent director, as the board considers that role not to be needed for a company with five non-executive directors.
The longest-serving director, George Nianias, has been in place for around 11 years and had planned to step down from the board. In January 2019, JRS announced that Philippe Delpal was to be appointed as a non-executive director following the company’s AGM on 12 March 2019. However, on 8 March 2019, JRS announced that Philippe Delpal’s appointment was being postponed due to personal circumstances. In the interim, George Nianias has agreed to remain a director.
A nomination committee, chaired by Gill Nott, is responsible for selecting new directors when needed. It used a search agency to suggest suitable candidates when appointing Tamara Sakovska. All directors stand for re-election at each AGM, in line with corporate governance best practice.
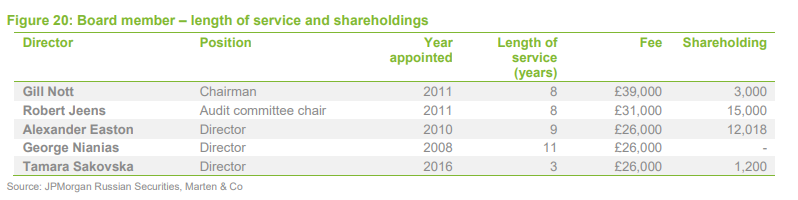
Gill Nott (chairman)
Gill Nott has been chairman since 12 June 2015. Gill spent the majority of the first 27 years of her career working in the energy sector. In 1994 she became chief executive of ProShare. Due to her work in the retail savings sector, she spent six years on the board of the Financial Services Authority from 1998 to 2004. Gill has held a portfolio of non-executive positions, particularly in the closed-end fund sector, over the last 15 years. She is a non-executive director of Premier Global Infrastructure Trust Plc and its subsidiary, PGIT Securities 2020 Plc.
Robert Jeens (audit committee chair)
Robert Jeens spent 12 years with Touche Ross & Co, where he was an audit partner, before moving to Kleinwort Benson Group Plc, where he became finance director in 1992. He then spent three years as group finance director of Woolwich Plc until 1999, following which he has held a portfolio of non-executive appointments. He is currently chairman of Allianz Technology Trust Plc and a director of Chrysalis VCT Plc.
Alexander Easton (director)
Alexander Easton was formerly the head of European equities at UBS Investment Bank and managing director responsible for UBS Brunswick (Russia). He is currently a partner in a number of Russian venture capital firms.
George Nianias (director)
George Nianias is the founder and group chairman of Denholm Hall Group. He has a close association with Russia and has also been financial adviser to several eastern European cities including Krakow, St. Petersburg and Moscow. He has also advised sovereign and local governments, financial institutions and corporations in western and eastern Europe. From 1987 to 1992, he was risk manager for Fixed Income and Treasury departments of S.G. Warburg Group Plc. George founded the firm’s Quantitative Research Group in 1988 and the Arbitrage Group in 1990. From 1985 to 1987, he worked for Citicorp in risk management. From 1983 to 1985 he was a credit officer at Citibank NA in the Commercial and General Banking Division London. George has often been consulted by the Bank of England and the Federal Reserve Bank of New York on matters connected with the money and bond markets in the UK and US.
Tamara Sakovska (director)
Tamara Sakovska is an investment professional with significant experience in developed and emerging markets. She is currently an investment partner at Global Family Partners in London. Her previous role was head of origination, Europe in the private equity team at Eton Park International LLP. Before joining Eton Park, Tamara worked at Permira in London and at Goldman, Sachs & Co. in New York. She is a native Russian speaker.
Previous publications
Readers interested in further information about JRS may wish to read QuotedData’s previous notes, which are summarised below.
- Russian recovery – Initiation – 9 March 2017
- Low valuations and rising yields – Update – 27 September 2017
- Beyond politics – Annual overview – 30 May 2018
- Expert access to attractively valued market – Update – 22 January 2019
The legal bit
Marten & Co (which is authorised and regulated by the Financial Conduct Authority) was paid to produce this note on JPMorgan Russian Securities Plc.
This note is for information purposes only and is not intended to encourage the reader to deal in the security or securities mentioned within it.
Marten & Co is not authorised to give advice to retail clients. The research does not have regard to the specific investment objectives financial situation and needs of any specific person who may receive it.
The analysts who prepared this note are not constrained from dealing ahead of it but, in practice, and in accordance with our internal code of good conduct, will refrain from doing so for the period from which they first obtained the information necessary to prepare the note until one month after the note’s publication. Nevertheless, they may have an interest in any of the securities mentioned within this note.
This note has been compiled from publicly available information. This note is not directed at any person in any jurisdiction where (by reason of that person’s nationality, residence or otherwise) the publication or availability of this note is prohibited.
Accuracy of Content: Whilst Marten & Co uses reasonable efforts to obtain information from sources which we believe to be reliable and to ensure that the information in this note is up to date and accurate, we make no representation or warranty that the information contained in this note is accurate, reliable or complete. The information contained in this note is provided by Marten & Co for personal use and information purposes generally. You are solely liable for any use you may make of this information. The information is inherently subject to change without notice and may become outdated. You, therefore, should verify any information obtained from this note before you use it.
No Advice: Nothing contained in this note constitutes or should be construed to constitute investment, legal, tax or other advice.
No Representation or Warranty: No representation, warranty or guarantee of any kind, express or implied is given by Marten & Co in respect of any information contained on this note.
Exclusion of Liability: To the fullest extent allowed by law, Marten & Co shall not be liable for any direct or indirect losses, damages, costs or expenses incurred or suffered by you arising out or in connection with the access to, use of or reliance on any information contained on this note. In no circumstance shall Marten & Co and its employees have any liability for consequential or special damages.
Governing Law and Jurisdiction: These terms and conditions and all matters connected with them, are governed by the laws of England and Wales and shall be subject to the exclusive jurisdiction of the English courts. If you access this note from outside the UK, you are responsible for ensuring compliance with any local laws relating to access.
No information contained in this note shall form the basis of, or be relied upon in connection with, any offer or commitment whatsoever in any jurisdiction.
Investment Performance Information: Please remember that past performance is not necessarily a guide to the future and that the value of shares and the income from them can go down as well as up. Exchange rates may also cause the value of underlying overseas investments to go down as well as up. Marten & Co may write on companies that use gearing in a number of forms that can increase volatility and, in some cases, to a complete loss of an investment.