Climbing inflation and power prices driving NAV uplift
NextEnergy Solar Fund (NESF) is a leading investor in the UK solar market. In addition, since investors approved a broadening of its investment policy in 2020, it has added exposure to battery storage and to solar assets in other OECD countries, leveraging the global expertise of its manager which is active across eight countries.
At end September 2021, NESF had 99 operational solar assets. The revenue from these comes from sales of power and subsidies. The subsidy income – around 60% of the total – is inflation-linked (to RPI).
Rising power prices and higher inflation drove an uplift in NESF’s NAV at end September. Currently, NESF’s shares offer a 7.0% yield, covered by cash generated from the portfolio.
Income from solar-focused portfolio
NESF aims to provide its shareholders with attractive risk-adjusted returns, principally in the form of regular dividends, by investing in a diversified portfolio of primarily UK-based solar energy infrastructure assets.
Fund profile
NESF is a UK-focused solar fund which was established in April 2014 with the aim of generating attractive risk-adjusted returns. The intention was that most of the return would come as dividends. Following shareholder approval for a revised investment policy in September 2020, the company has the freedom to invest up to 30% of gross assets in other OECD countries outside the UK. It can also invest up to 15% in solar-focused private equity structures, and 10% in energy storage.
NESF’s investment manager is NextEnergy Capital IM Limited and it is advised by NextEnergy Capital Limited. Both companies are part of the NextEnergy Capital Group (NEC), which has around $3.2bn of AUM. To date, NEC has invested in over 325 individual solar plants for an installed capacity in excess of 1.4 GW, making it amongst the most experienced solar investors globally. WiseEnergy is NEC’s operating asset manager. It has provided solar asset management, monitoring and technical due diligence services to over 1,300 utility-scale solar power plants with an installed capacity over 2.2GW. Starlight is NEC’s development company. It has developed over 100 utility-scale projects and continues to progress a global pipeline of c.2.5GW of both green and brownfield project developments.
There are over 200 members of the NextEnergy team, around 115 of whom are employed on the asset management side of the business. The adviser has offices in Chile, India, Italy, Portugal, Spain, the UK, and the USA. NESF now has some exposure to most of these markets.
An investment committee comprised of Michael Bonte-Friedheim (founding partner and group CEO), Giulia Guidi (head of ESG), Ross Grier (UK managing director), and Aldo Beolchini (managing partner and chief investment officer) oversees NESF’s portfolio.
Environmental and social benefits
Over the 12 months ended 30 September 2021, the power produced by NESF avoided the production of the equivalent of 229,000 tonnes of CO2 emissions. Its assets generated enough energy to power 299,000 UK homes for a year.
NESF aims to be a market leader in the solar sector for enhancing ecology and biodiversity, with a particular emphasis on supporting pollinators such as bees. Ground-mounted solar is underplanted with wildflower meadows (with a bias to white flowers like chamomile that reflect light back onto the panels, enhancing generation). Sheep graze sites, and a portion of each site is left uncut over the winter. NEC has a Biodiversity Management Plan which is being deployed over a select number of sites and involves, for example, the planting of wildflower meadows, installation of bird and bat boxes etc.
NESF provides funding to local communities and supports educational projects. The NextEnergy Foundation (to which the manager contributes at least 5% of its profits) is a global organisation tasked with alleviating poverty, providing access to clean power and reducing emissions. The adviser has been working with suppliers to ensure that equipment is sourced ethically. ESG clauses are incorporated into contracts with suppliers of equipment and operations and maintenance firms.
Background
The need to cut carbon emissions is driving significant growth in renewable energy. In the UK, power generated by renewables rose ten-fold between 2010 and 2020.
Solar PV technology has become increasingly competitive in recent years as the costs of panels have fallen. Figure 1, which shows the estimated costs of producing power in the UK for a range of generation types, demonstrates that, following an 80% fall in the cost of solar since 2010, unsubsidised solar is already the cheapest source of new build power. Now, in the UK, subsidies are once again available for new solar generation. The fourth allocation round for CfDs is underway and the results are expected to be announced in the summer of 2022.

In addition, the cost of gas-powered generation has soared well beyond the estimates in Figure 1. In the UK, the marginal price for power tends to be heavily influenced by the natural gas price as shortfalls in supply are met by gas-fuelled peaking plant. Much higher gas prices (on higher Middle Eastern and Asian demand and lower Russian exports) are believed to be driving much higher electricity prices.
Renewable energy generators such as NESF can benefit significantly from higher power prices as their variable costs remain unchanged.

Asset allocation
At 30 September 2021, NESF was invested in 99 operating solar assets, with a capacity of 895MW and had made a $50m commitment to an LP vehicle NextPower III ESG, which acquires solar power plants at the ready-to-build stage or in operations across high-growth OECD international markets. NESF plans to make some co-investments alongside the LP.
In addition, NESF has established a £100m joint venture with Eelpower, a leading battery storage specialist in the UK. The first asset bought by the joint venture was a 50MW ready-to-build, standalone battery located in Fife, Scotland. This is intended to be energised this year. Eelpower is a specialist in the UK battery market with a strong track record and extensive experience in the delivery, management, and optimisation of battery storage assets in the UK. Eelpower will provide EPC and ongoing specialist asset management services to the storage assets and will source further acquisition opportunities.
NextEnergy Solar Fund has furthered its geographic diversification by signing its first co-investment transaction in connection with NextPower III ESG. It is buying a 25% stake in a Spanish 50MW utility scale solar project currently under construction in Cádiz, Spain (Agenor) for €10.6m. Energisation of the project is expected to take place in the first half of 2022. One of the attractions of co-investments is that they are available on a no-fee, no-carry basis. Further co-investments are in the pipeline and the manager says it expects to announce these later in the year.
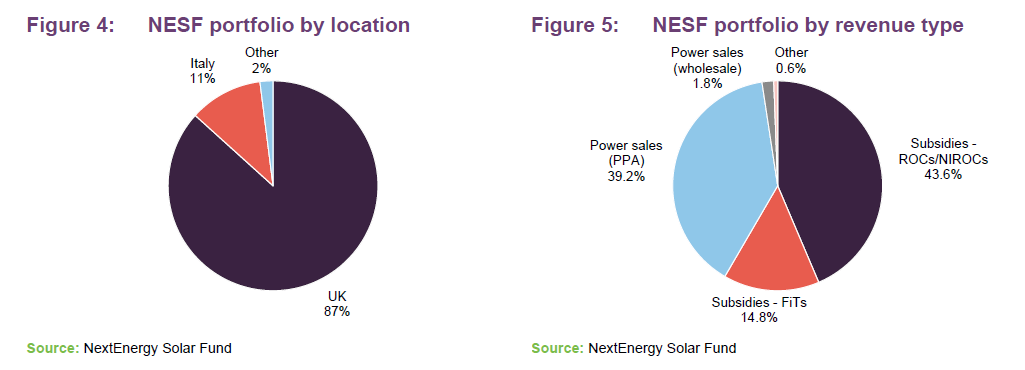
At end March 2021, NESF had 150MW of subsidy-free assets, including some under development. It has sold some of these in the past, crystallising attractive returns on those investments. The 150MW figure excludes some assets (the Anglian Water projects and the Camden portfolio) subject to long-term PPAs with inflation-linked prices (and so have similar risk to subsidised assets). As Figure 5 shows, most power is sold under PPAs.
NESF’s eight Italian assets were bought in 2017. These benefit from FiTs until 2032 and consequently a high proportion of the income from these assets (about 85%) is fixed until then.
Valuation
In common with peers, NESF’s portfolio is valued on a discounted cash flow basis (the most-recent weighted average discount rate was 6.3%). At 30 September 2021, the calculation assumed long-term inflation of 2.5% and short-term (one-year) inflation of 4.8%. Currently, inflation is above this level.
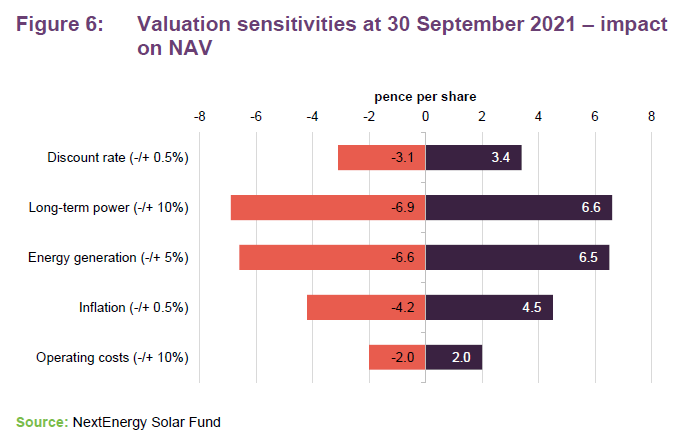
Short-term (up to 2025) power prices were estimated at £71.1/MWh (contrast that with Figure 2) and longer-term power prices at £44.1/MWh. The UK Corporation Tax rate was estimated to be 19% up to 2023 and 25% thereafter. The weighted average discount rate was 6.3%. Figure 6 shows the sensitivity of NESF’s NAV to changes in those assumptions.
Performance – NAV is climbing
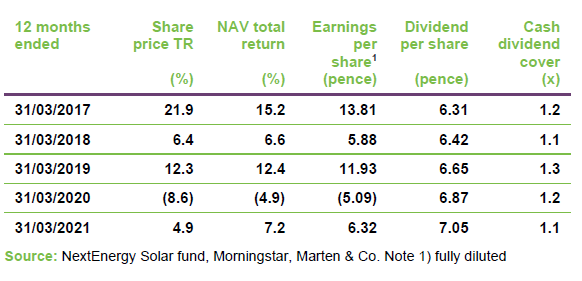
Since launch, NESF has delivered NAV returns averaging at 6.8% per annum. The exposure to construction-phase assets achieved through NextPower III ESG offers potential for further NAV growth as these assets are energised.

At 30 September 2021, NESF’s NAV was 103.1p, up from 98.9p at 31 March 2021. Solar irradiation for the period was 2.4% higher than budget. This was offset to some extent by some unplanned outages resulting in 1.1% more power being produced than was budgeted for in the six-month period ended 30 September 2021. COVID-19 restricted maintenance work, which resulted in more outages than usual. However, the company says that things are now expected to be back to normal.
Sharply higher short-term (2021–2025) power price forecasts offset a further small decline in long-term price estimates, and this had a positive influence on the NAV. So, too, did higher short-term inflation forecasts. All of NESF’s UK subsidies are inflation-linked.
At 30 September 2021, 96% of NESF’s budgeted generation for FY22 was hedged. That falls to 75% for FY23, 59% for FY24 and 18% for FY25. 92% of the cashflows from the Italian portfolio are hedged back into sterling until 2032.
Dividend
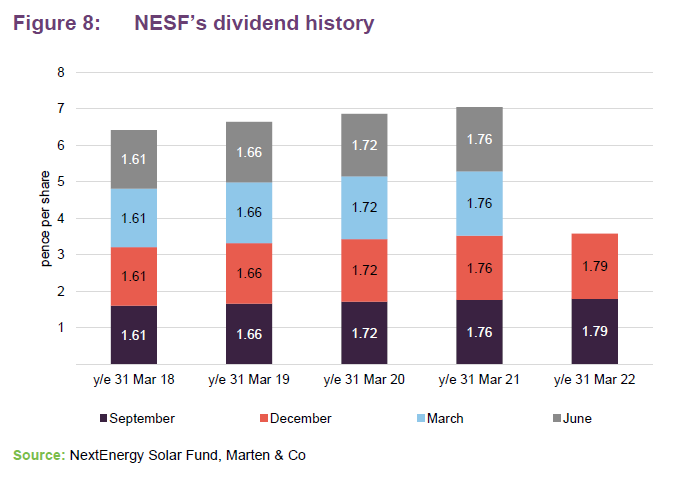
NESF pays quarterly dividends in June, September, December and March. NESF has an unbroken track record of annual dividend increases since launch (a 2.1% CAGR). A progressive dividend policy was adopted in the accounting year ended March 2021. For the accounting year ended 31 March 2022, NESF is targeting a dividend of 7.16p (up from 7.04p for FY21) and forecasts that this will be well-covered by cash 1.3x.
Premium/discount
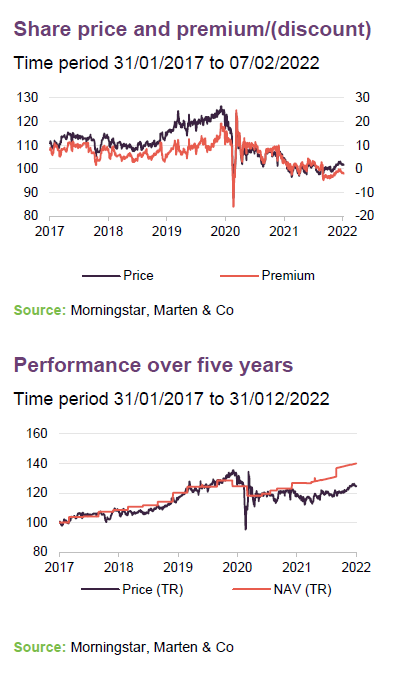
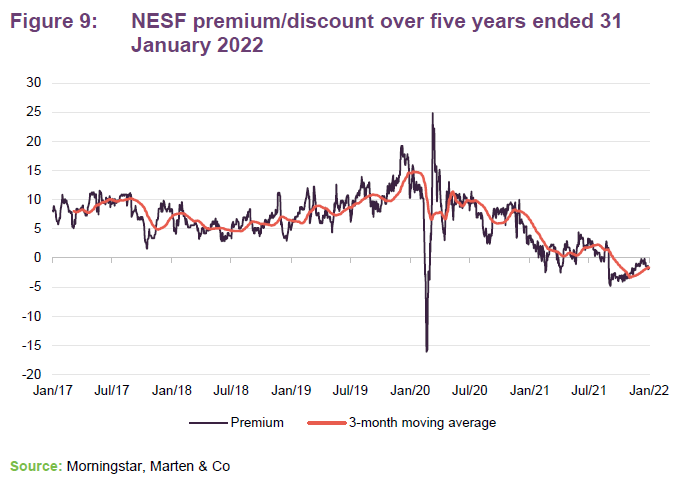
NESF’s shares traded at a premium to NAV for most of its life. However, while the shares recovered quickly following the panic associated with the onset of the pandemic in March 2020, when most investment companies saw a sharp widening of discounts, the premium faded again, and the shares traded at a discount on-and-off over 2021. Over 2021, NESF’s shares traded within a range of a 4.8% discount to a 4.4% premium and averaged a 0.2% premium. On 7 January 2022, the shares were trading at a discount of 2.1%.
Fees and charges
The manager is entitled to a fee calculated as 1.0% of the first £200m of net assets, 0.9% on the next £100m and 0.8% on the balance. The ongoing charges ratio is 1.10%.
Capital structure
NESF has 588,694,100 ordinary shares in issue, none of which are held in treasury. Uniquely within the sector, NESF also has 200m unsecured preference shares in issue. These pay a fixed preferred dividend of 4.75%, which the manager says was much more cost-effective than project financing when they were issued. NESF has the option to redeem them at nominal value for six years from April 2030. Beyond April 2036, preference shareholders have the right to convert their preference shares into ordinary shares based on nominal value and the NAV of the ordinary shares at the time.
At the end of September 2021, NESF’s financial gearing was 26% (44% if the preference shares are included). £145.4m of the drawn debt facility expires in 2035 and £44.1m in 2034. A further £79.1m of short-term debt was drawn at 30 September 2021, with £85.9m undrawn and available to fund new investments.
The legal bit
Marten & Co (which is authorised and regulated by the Financial Conduct Authority) was paid to produce this note on NextEnergy Solar Fund Limited.
This note is for information purposes only and is not intended to encourage the reader to deal in the security or securities mentioned within it.
Marten & Co is not authorised to give advice to retail clients. The research does not have regard to the specific investment objectives financial situation and needs of any specific person who may receive it.
The analysts who prepared this note are not constrained from dealing ahead of it but, in practice, and in accordance with our internal code of good conduct, will refrain from doing so for the period from which they first obtained the information necessary to prepare the note until one month after the note’s publication. Nevertheless, they may have an interest in any of the securities mentioned within this note.
This note has been compiled from publicly available information. This note is not directed at any person in any jurisdiction where (by reason of that person’s nationality, residence or otherwise) the publication or availability of this note is prohibited
Accuracy of Content: Whilst Marten & Co uses reasonable efforts to obtain information from sources which we believe to be reliable and to ensure that the information in this note is up to date and accurate, we make no representation or warranty that the information contained in this note is accurate, reliable or complete. The information contained in this note is provided by Marten & Co for personal use and information purposes generally. You are solely liable for any use you may make of this information. The information is inherently subject to change without notice and may become outdated. You, therefore, should verify any information obtained from this note before you use it.
No Advice: Nothing contained in this note constitutes or should be construed to constitute investment, legal, tax or other advice.
No Representation or Warranty: No representation, warranty or guarantee of any kind, express or implied is given by Marten & Co in respect of any information contained on this note.
Exclusion of Liability: To the fullest extent allowed by law, Marten & Co shall not be liable for any direct or indirect losses, damages, costs or expenses incurred or suffered by you arising out or in connection with the access to, use of or reliance on any information contained on this note. In no circumstance shall Marten & Co and its employees have any liability for consequential or special damages.
Governing Law and Jurisdiction: These terms and conditions and all matters connected with them, are governed by the laws of England and Wales and shall be subject to the exclusive jurisdiction of the English courts. If you access this note from outside the UK, you are responsible for ensuring compliance with any local laws relating to access.
No information contained in this note shall form the basis of, or be relied upon in connection with, any offer or commitment whatsoever in any jurisdiction.
Investment Performance Information: Please remember that past performance is not necessarily a guide to the future and that the value of shares and the income from them can go down as well as up. Exchange rates may also cause the value of underlying overseas investments to go down as well as up. Marten & Co may write on companies that use gearing in a number of forms that can increase volatility and, in some cases, to a complete loss of an investment.
