Taking advantage of a favourable landscape
Various events appear to have combined to drive a meaningful shift in markets. As we explore in this note, inflation forecasts have changed and with them interest rate expectations. A Republican clean sweep in the US elections seems to offer the prospect of a favourable landscape for financials. There has been an improvement in the NAV and share price of Polar Capital Global Financials (PCFT) over the past 12 months.
PCFT’s managers believe that the financials sector is the biggest beneficiary of an ongoing rotation from growth to value, which they think has much further to go, and that PCFT offers investors an ideal way to play this.
Growing income and capital from financials stocks
PCFT aims to generate a growing dividend income, together with capital appreciation. It invests primarily in a global portfolio, consisting of listed or quoted securities issued by companies in the financial sector. This includes banks, life and non-life insurance companies, asset managers, stock exchanges, speciality lenders and fintech companies, as well as property and other related sub-sectors.
| Year ended | Share price total return (%) | NAV total return (%) | MSCI ACWI Financials (%) | MSCI ACWI (%) |
|---|---|---|---|---|
| 30/11/2020 | (1.6) | (6.2) | (8.2) | 11.4 |
| 30/11/2021 | 29.7 | 28.1 | 27.0 | 20.4 |
| 30/11/2022 | (7.6) | 2.0 | 6.8 | (1.8) |
| 30/11/2023 | (7.5) | (2.6) | 0.3 | 5.4 |
| 30/11/2024 | 45.4 | 35.2 | 36.1 | 25.6 |
Source: Morningstar, Marten & Co
Fund intro
PCFT looks to grow investors’ income and their capital
More information on the trust is available on its website www.pcgft.com
Polar Capital Global Financials Trust (PCFT) has twin objectives of growing both investors’ income and their capital. Its global mandate aims to make it a useful alternative for UK-based investors looking to diversify their financials exposure.
PCFT launched on 1 July 2013 with a fixed life. In April 2020, in conjunction with a vote on prolonging the life of the trust, shareholders were offered a cash exit. Holders of 39.1% of PCFT’s then-issued share capital opted to sell their shares and the portfolio was reconstructed to facilitate this. At the same time, shareholders overwhelmingly approved an extension of the trust’s life beyond May 2020 and the trust now has an unlimited life, but with five-yearly tender offers, the first of which is scheduled for 2025.
Predominantly, the portfolio is invested in listed/quoted securities. The trust may have some exposure to unlisted/unquoted securities, but this is not expected to exceed 10% of total assets at the time of investment.
Benchmarked against MSCI ACWI Financials
Since April 2020, the trust’s performance benchmark has been the MSCI All-Countries World Financials Net Total Return Index in sterling (MSCI ACWI Financials).
PCFT’s AIFM is Polar Capital LLP, which had AUM of £22.7bn at 30 September 2024 and employs 14 investment teams, spread across offices in Europe, the US and Asia. PCFT’s lead managers are Nick Brind, George Barrow, and Tom Dorner.
Market backdrop
Based on the MSCI indices, financials is the second biggest sector globally, ranking behind information technology with 16% of the index at end September 2024 versus 25% for IT.
Figure 1: Breakdown of the global financials sector
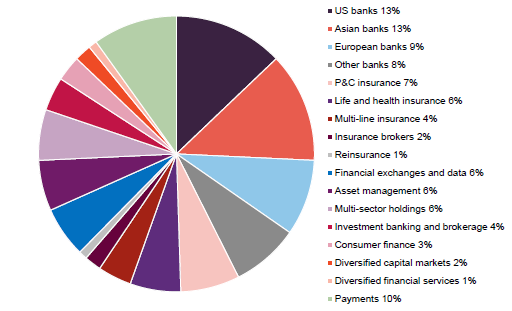
Source: MSCI as at September 2024
However, it is not an easy sector to analyse, and not just in terms of regulations, and accounting standards. As Figure 1 shows, the sector is diverse. PCFT’s managers observe that large parts of it (and a majority of the market cap of the sector) can be categorised as value investments, but there are growth elements too. Some areas they are wary of, but they feel that others are looking very attractive.
The trust was born as a way of offering UK-based investors access to a much more diverse opportunity set with more exciting prospects than was available in their home market. It is designed to be a one-stop shop for investors that want financials exposure and lets investors tap into the expertise of one of the largest and most experienced teams in the sector – see page 16.
Currently, around half the portfolio is comprised of stocks that the managers believe are good quality companies with strong competitive positions. About 30% is invested in cyclical businesses (taking advantage of favourable economic conditions) but with strong balance sheets. The balance is invested in recovery situations where the managers see a clear catalyst for a turnaround in fortunes.
Figure 2: MSCI ACWI Financials versus MSCI ACWI
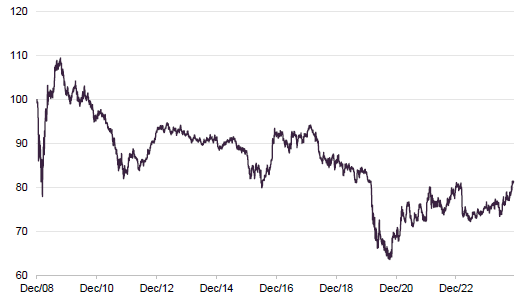
Source: Morningstar, Marten & Co
As Figure 2 shows, since the financial crisis, the financials sector has underperformed relative to the wider market.
At the end of November 2024, the sector was trading on a forward P/E of 13.0x compared to 18.5x for the wider market. A re-rating began in the wake of COVID. However, the managers believe that this recovery in the fortunes of the financials sector is only just getting started.
Figure 3: Relative valuation of financials and wider market as at 30 November 2024
| P/E(x) | P/E fwd (x) | P/Book(x) | Yield (%) | |
|---|---|---|---|---|
| MSCI ACWI Financials | 14.76 | 12.97 | 1.74 | 2.65 |
| MSCI ACWI | 22.39 | 18.46 | 3.30 | 1.79 |
The managers say that the five themes that they have identified, and which we covered in detail in our last note (see page 19) remain intact: the growth of alternative asset managers; a strong pricing environment for reinsurance companies; growth in financial services and reform within emerging markets; undervalued small- and mid-caps; and a need to be selective in PCFT’s exposure to banks.
One influence on the sector’s performance has been the direction of interest rates. The managers suggest that higher rates, introduced to choke off the inflation that followed the period of COVID stimulus, created an opportunity for banks to widen their lending margins, but other parts of the sector have been flourishing too as insurance premiums have been rising, alternative asset managers have been growing assets under management, volumes of electronic payments have grown, and innovation drives efficiencies and growth of new markets.
Figure 4: JPMorgan Chase Tier 1 capital ratio (%)
Source: Bloomberg
In the wake of the US election, the market’s initial reaction was to drive US bond yields higher, perhaps rationalising that some of Trump’s policies may be inflationary. Those fears appear to have eased (US 10-year Treasuries yielded 4.28% at the start of November and 4.17% at the end of that month). Nevertheless, PCFT’s managers believe that factors such as de-globalisation, demographics, and net zero commitments mean that interest rates will remain higher for longer. They feel that this spells good news for financials, and banks in particular. As noted in the asset allocation section, the managers have repositioned PCFT’s banks exposure from a bias to European stocks towards the US. They say that the Republican clean sweep in the US elections looks particularly favourable for US banks.
The US financial sector may also benefit from a promised bonfire of regulations. The Basel rules on banks’ capital ratios that were introduced in the wake of the global financial crisis mean that banks’ balance sheets are much stronger than they were going into it. PCFT’s managers note that well-capitalised UK and European banks are already projected to sustain around 10% total capital return per annum over the next three years. However, there were concerns in the US that new Basel III rules were set to raise capital requirements for the largest banks once again.
Jamie Dimon, CEO of JPMorgan Chase (PCFT’s biggest position), has been a leading critic of the regulator. Ahead of the election, the Fed watered down its plans to hike the amount of capital that the big US banks have to hold. Now, the capital requirements could be cut again. That could translate into a period of much higher returns of capital to shareholders through dividends and share buybacks.
Investment process
PCFT’s managers are stock-pickers and geographic and sector allocations are driven by their stock selection decisions. However, the breadth of opportunity is highest in the US, which dominates the benchmark. The maturity of the industry in that country is coupled with a fragmentation of the banking market.
Emphasis on proprietary research
The managers are actively involved in researching opportunities. Proprietary research is a core part of the investment process. The managers feel that, while some of it is useful, external research is too often short-term in focus. They prefer to take a medium- to long-term view. Access to companies’ management is an important part of the process.
The approach seeks to identify stocks with the potential to create strong risk-adjusted returns. An analysis of balance sheet strength plays a part in this.
Focus on limiting the downside
Short-term profitability and rapid top-line growth may mask underlying problems with asset quality. Most financials stocks are very highly geared, and consequently there is a real need to focus on limiting the downside.
The remit is global and includes emerging markets. The universe is about 500 stocks (typically, the smallest stock that the managers would consider for PCFT’s portfolio would have a market cap of around $500m). There are no limits on the exposure of the investment portfolio to either smaller or mid-cap companies, but the majority of the portfolio is invested in companies with a market capitalisation greater than US$5bn.
The managers say that this is a manageable number of stocks for the team to cover. The likes of Goldman Sachs and JPMorgan are complex beasts, but most banks have relatively simple business models. In many areas, pricing is commoditised and so the sector is quite generic, but research is essential to sort the good from the bad.
The managers use a scoring system to look at a range of variables around risk, growth, and value. These include balance sheet strength; how the company is funded; the composition of the loan book; historical quality of the loan book; and trends in margins. This model provides a framework for further analysis rather than producing a buy list.
The team meets about 400 companies a year
The team meets about 400 companies each year, but a lot of this is double-checking their research findings, talking to both customers and competitors, for example.
For banks and similar companies, any assessment of value is based on a variation of CAPM – using returns on equity and price to book. The managers find that P/E ratios and measures of growth do not work as well.
The sector is not just about balance sheet businesses, however, and it is evolving. The managers use a more earnings-driven, traditional approach to valuing other companies.
Restrictions
The investment manager has discretion to invest up to 10% of the portfolio in debt securities.
PCFT may have a small exposure to unlisted and unquoted companies, but in aggregate, this is not expected to exceed 10% of total assets at the time of investment.
PCFT will not invest more than 10% of total assets, at the time of investment, in other listed closed-ended investment companies and no single investment will normally account for more than 10% of the portfolio at the time of investment.
PCFT may employ levels of borrowing from time to time with the aim of enhancing returns, currently subject to an overall maximum of 20%.
ESG
ESG factors are integrated into the investment process, and the managers believe that they are a critical driver of long-term returns. Governance and risk management has always been an important component of the investment process as it sets the tone, along with culture, for how a business is managed and will perform in a stressed environment. The managers’ proprietary ESG process incorporates both quantitative and qualitative factors, making use of both internal research and data from third-party ESG providers. An ESG overlay is prepared for each company. This focuses on specific governance (risk management, engagement, litigation, strategy) and environmental factors (exposure to fossil fuels, communication, and engagement).
The lowest-rated companies are excluded from the universe of prospective investments, and any company that scores badly on governance is also automatically excluded.
The analysis helps identify matters that will be raised with the companies by the managers. Ongoing monitoring and engagement of companies is central to the team’s approach.
PCFT has an A MSCI ESG rating
As at 30 November 2023, PCFT had an MSCI ESG rating of A, with a weighted average ESG quality score of 6.56 versus 6.62 for PCFT’s benchmark. The trust’s holdings have a low carbon intensity, which to a large extent reflect the nature of the financials sector. The trust has a strong record of voting at meetings of the companies it invests in, and at over a third of them, the fund’s vote was not cast in favour of resolutions put forward at these meetings.
Portfolio – asset allocation
Figure 5: PCFT geographic exposure as at 31 October 2024
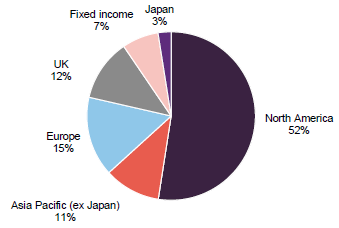
Source: Polar Capital Global Financials Trust
Figure 6: PCFT sector exposure as at 31 October 2024
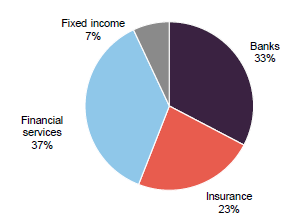
Source: Polar Capital Global Financials Trust
At the end of October 2024, there were 90 positions in PCFT’s portfolio, up from 81 at the end of April (the data that we used when we last published). Since end April, the trust’s exposure to North America and Asia (ex-Japan) has increased at the expense of Europe, UK, and Japan. PCFT had slightly more in insurance and financial services at end October than it did at end April, while the exposure to banks fell.
Top 10 holdings
Figure 7: Relative valuation of financials and wider market as at 30 November 2024
| Country/region | Subsector | 31/10/2024(%) | 30/04/2024(%) | Change(%) | |
|---|---|---|---|---|---|
| JPMorgan | United States | Banks | 6.6 | 6.7 | (0.1) |
| Mastercard | United States | Financial services (payments) | 4.5 | 5.4 | (0.9) |
| Bank of America | United States | Banks | 3.9 | ||
| Visa | United States | Financial services (payments) | 2.8 | 2.6 | 0.2 |
| UniCredit | Italy | Banks | 2.6 | 2.5 | 0.1 |
| Fidelity National Information | United States | Financial services | 2.4 | ||
| Nasdaq | United States | Financial services (exchange) | 2.1 | ||
| ICICI | India | Banks | 1.9 | 2.2 | (0.3) |
| Barclays | United Kingdom | Banks | 1.9 | 2.2 | (0.3) |
| Erste Group Bank | Austria | Banks | 1.9 | ||
| Total | 30.7 |
Source: Polar Capital Global Financials Trust. Note 1) Percentage of gross assets
Since we last published (using data as at end April 2024), Chubb, Wells Fargo, Goldman Sachs, and Citigroup have dropped out of the top 10 holdings, to be replaced by Bank of America, Fidelity National Information Services, Nasdaq, and Erste Group Bank.
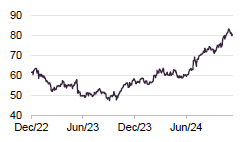
Figure 8: Bank of America (USD)
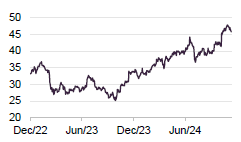
Source: Bloomberg
Bank of America
Bank of America (bankofamerica.com) is one of the world’s largest banks and the fifth largest constituent of PCFT’s benchmark at end November 2024. At the end of Q3 2024, it had $5.9trn of total deposits, loans, and investment balances, and could boast 23 consecutive quarters of growth in the number of its checking accounts and 14 consecutive quarters of small business loan growth.
Its Common Equity Tier 1 Capital ratio was 11.8% at end September 2024, 112bps above the regulatory minimum. It grew its quarterly dividend by 8% and continues to buy back stock (more than offsetting share issuance to meet equity-based compensation plans for staff).
Net interest margins have fallen from recent highs, but costs as a percentage of income have been falling. Provisions for credit losses have been creeping up. Gains in markets are driving up AUM and with that management fees. Revenue from investment banking activities is a bit weaker than it was a year ago, but the company suggests that this reflects lower net interest income. Investment banking fees were up 18% year-on-year, and Bank of America ranked third globally on this metric.
Exposure to commercial real estate amounts to 6.4% of total loans and leases, and within that exposure to offices is less than a quarter of the total.
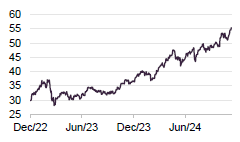
Figure 9: Fidelity National Information Services (USD)
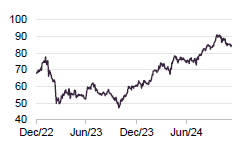
Source: Bloomberg
Fidelity National Information Services
Fidelity National Information Services (fisglobal.com) is a leading global financial services technology business. It has grown both organically and through acquisition (buying SunGard in 2015 and Worldpay in 2019, for example) and now serves over 14,000 clients across 150 countries, including 95% of the world’s leading banks.
When it released its third quarter results, it uplifted its earnings outlook for FY24 – it now expects a 54%–56% uplift in adjusted EPS on revenue growth of 4.1%–4.4%. It has been buying back stock and is on track to return $4.8bn in dividends and buybacks for FY24.
In 2023, Fidelity National Information Services decided to separate Worldpay from the rest of the business. A plan to spin it out was dropped and in February 2024, it announced that it had sold a 55% stake in the business to a private equity investor for $12bn. That helped finance a $4bn share buyback.
Figure 10: Nasdaq (USD)
Source: Bloomberg
Nasdaq
Nasdaq (nasdaq.com) is best known as the operator of the eponymous exchange. However, it is also a data business, an index provider, and a financial technology business. Nasdaq has been building its software division through acquisition. In 2020, for example, it bought Verafin, an anti-financial crime business. In November 2023, Nasdaq bought a financial software business Adenza for $10.5bn. There were cost synergies to extract from absorbing Adenza, but Nasdaq saw the potential for revenue synergies too, as it expanded its offering to its customers. The managers say that Nasdaq’s share price reaction to the deal suggested that the market felt it had overpaid, but they felt this presented an attractive entry point for PCFT.
Nasdaq’s Q3 2024 results demonstrate the benefits of acquiring Adenza, with annualised SaaS revenue 31% higher year-on-year (13% organic). The exchange continues to attract new listings, with 33 new listings in Q3 alone. In addition, the volume of exchange-traded products linked to Nasdaq indices continues to climb and at end Q3 2024 amounted to $575bn.
Figure 11: Erste Group Bank (EUR)
Source: Bloomberg
Erste Group Bank
Headquartered in Austria, Erste Group Bank (erstegroup.com) is one of the largest financial services providers in the Eastern part of Europe (Austria, Czech Republic, Slovakia, Hungary, Romania, Serbia, Croatia, and an indirect presence in Montenegro) in terms of clients and total assets.
Total assets have grown by 7.5% CAGR since end 2019 and the cash return on equity has risen to 16.7% from 10.0% over that period, helped by a fall in the cost/income ratio from 59.0% to 45.8%.
In its Q3 figures, Erste Group Bank upgraded its full-year projections, saying its net interest income was forecast to grow by more than 2% versus 2023. Positive effects from customer deposit and fixed rate customer loan repricing, as well as loan growth of about 5% and better income from its bond portfolio, should more than offset the negative effect of central banks’ interest rate cuts. Net fee and commission income is projected to grow by about 10% year-on-year.
Other portfolio changes
As mentioned earlier, there has been an overall shift in the portfolio away from European banks (sales of stocks such as AIB and Banco Santander) toward US ones, reflecting the managers’ view on the shift in the risk/reward ratio post the US election. However, as a recovery play, PCFT has been buying the Italian bank BFF, which the managers describe as a good and profitable business. However, the company was investigated by the Bank of Italy and forced to suspend its dividend, which triggered a review of its credit rating by Moody’s and sharp drop in its share price. The managers note that the balance sheet is strong, with a common equity Tier 1 Capital ratio of 12.3%, well ahead of regulatory targets.
PCFT’s position in Munich Re has been switched into Hannover Re on the basis that the latter makes more use of retrocession insurance and is therefore better protected from an upsurge in catastrophic weather events. The holding in Berkshire Hathaway was trimmed as that company has significantly raised its cash position and therefore seemed likely to lag a rising market.
Performance
PCFT’s historic performance has been covered in our previous notes, a list of which is provided on page 19.
Figure 12: PCFT NAV total return relative to MSCI ACWI Financials over five years ended 30 November 2024
Source: Morningstar, Marten & Co
Since the summer, PCFT’s relative performance has declined. However, as Figure 13 shows, PCFT’s NAV returns are ahead of its benchmark since the trust was restructured in April 2020. The sector has also outperformed the wider global index over that period as well, including over the past year.
Figure 13: Cumulative total return performance over periods ending 30 November 2024
| 3 months (%) | 6 months (%) | 1 year (%) | 3 years (%) | Since 22 April 20201 (%) | 5 years (%) | Since launch (%) | |
|---|---|---|---|---|---|---|---|
| PCFT price | 11.5 | 17.9 | 45.4 | 24.2 | 125.3 | 58.6 | 172.8 |
| PCFT NAV | 8.9 | 14.0 | 35.2 | 34.3 | 129.9 | 61.3 | 189.3 |
| MSCI ACWI Financials | 12.0 | 17.5 | 36.1 | 45.7 | 128.1 | 69.8 | 211.1 |
| MSCI AC World Index | 7.3 | 10.7 | 25.6 | 30.0 | 92.3 | 74.3 | 358.8 |
Source: Morningstar, Marten & Co. Note 1) 22 April 2020 was the date of PCFT’s reconstruction- see page 13. Note 2) Based on data supplied by the manager, the return on the portfolio since launch has been 178.0%. This return adjusts for the dilutive effect on NAV returns of PCFT’s subscription shares.
The managers provided us with some performance attribution data covering the first 10 months of 2024. In retrospect, they felt that they could have positioned the portfolio more bullishly. In particular, the portfolio had a modest underweight to US and Australian banks, both of which have done well.
Figure 14: Five-largest negative contributions to relative returns YTD to 31 October 2024
| Average stock weight (%) | Active weight (%) | Stock return (%) | Total attribution (%) | |
|---|---|---|---|---|
| Interactive Brokers Group | 1.29 | 1.29 | 82.21 | 0.46 |
| Barclays | 1.67 | 1.34 | 54.44 | 0.44 |
| Virtu Financial | 0.58 | 0.58 | 51.28 | 0.35 |
| BBVA | 0.47 | (0.05) | 8.35 | 0.33 |
| Beazley | 1.45 | 1.45 | 44.73 | 0.32 |
Source: Polar Capital Global Financials Trust
Source: Morningstar, Marten & Co. Note 1) 22 April 2020 was the date of PCFT’s reconstruction- see page 13. Note 2) Based on data supplied by the manager, the return on the portfolio since launch has been 178.0%. This return adjusts for the dilutive effect on NAV returns of PCFT’s subscription shares
Interactive Brokers Group has been reporting strong earnings on the back of higher customer trading volumes, and higher interest income on cash balances and margin loans to customers.
The managers think that, in retrospect, Barclays was just too cheap and that, as other investors cottoned onto this, the share price rose sharply. However, they say that even now the stock is not expensive. PCFT also has a holding in NatWest Bank as it thinks that the UK banking sector is in good shape. It does not have exposure to Lloyds Bank or other financial institutions that have been hit hard by the auto finance commission payments claims.
Virtu Financial is a trading systems software business that the managers say is benefiting from decent trading volumes, and is buying back its shares quite aggressively.
Figure 15: Five-largest negative contributions to relative returns YTD to 31 October 2024
| Average stock weight (%) | Active weight (%) | Stock return (%) | Total attribution (%) | |
|---|---|---|---|---|
| OSB Group | 1.24 | 1.24 | (19.20) | (0.34) |
| Banco Santander | 0.75 | 0.11 | 15.77 | (0.31) |
| Sabre Insurance | 0.54 | 0.54 | (5.11) | (0.30) |
| HSBC Holdings | 0.31 | (1.06) | 11.99 | (0.26) |
| Progressive Corp | 0.76 | (0.31) | 50.93 | (0.25) |
Source: Polar Capital Global Financials Trust
OSB Group’s share price has rallied since the end of October. As mentioned above, the position in Banco Santander has now been sold.
Dividend
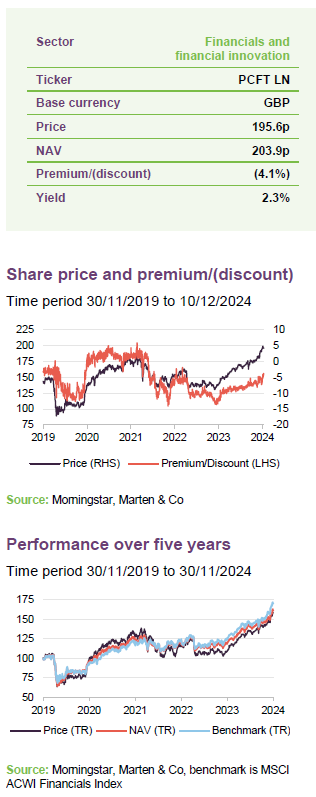
PCFT pays dividends semi-annually on its ordinary shares in February and August. All dividends are paid as interim dividends. The payments are not necessarily of equal amounts. The company does not pay a final dividend. As at 10 December 2024, the dividend yield was 2.3%.
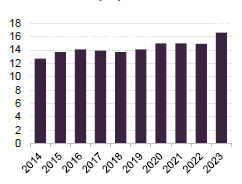
Figure 16: PCFT dividend and revenue earnings history for years ended 30 November
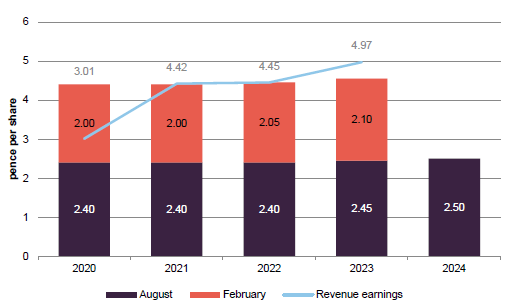
Source: Polar Capital Global Financials Trust
Reserves help support the dividend
PCFT has edged up its dividends in recent years. Most years, these have been covered by earnings. However, the events of COVID – when many companies were prevented from paying dividends – meant that it had to dip into revenue reserves to maintain its dividend in 2020. PCFT pursues a long-term policy of dividend growth, although there is no guarantee that this can be achieved. At the end of May 2024, the revenue reserve stood at £14.8m (4.9p per share).
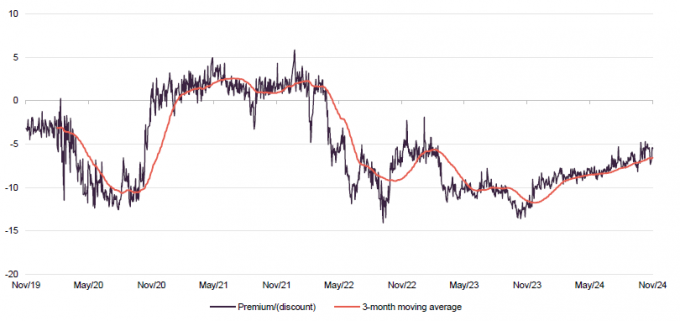
Premium/discount
Over the 12 months ended 30 November 2024, PCFT’s discount moved within a range of 4.7% to 12.4% and averaged 8.2%. At 10 December 2024, PCFT was trading on a discount of 4.1%.
Figure 17: PCFT’s premium/(discount) over the five years to 30 November 2024
Source: Morningstar, Marten & Co
As the discount has narrowed, the need for share buybacks has reduced and this is reflected in Figure 18. Investors may also be factoring in next year’s liquidity event, but if the backdrop remains favourable as the managers expect, perhaps we could see the trust expand on the back of this.
Figure 18: PCFT buybacks since 1 November 2024
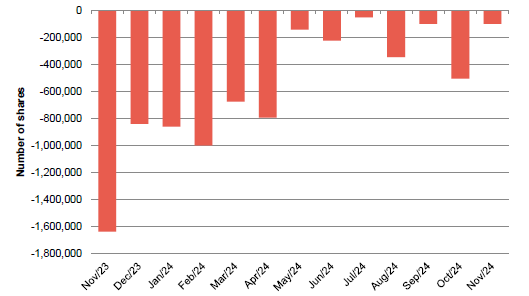
Source: Polar Capital Global Financials Trust (data to close of business on 10 December 2024).
Fees and costs
PCFT’s manager is Polar Capital LLC (Polar). PCFT pays Polar a base management fee of 0.70% of NAV per annum. The investment management agreement may be terminated by either party giving 12 months’ notice. The base management fee is charged 80% to revenue and 20% to income.
In addition, the manager has the opportunity to earn a performance fee. This is calculated over five-year periods, the first of which runs from 7 April 2020 to 30 June 2025. The performance fee will be 10% of the total return generated by PCFT in excess of a performance hurdle. The hurdle is set as the return on the benchmark (MSCI ACWI Financials) plus 1.5% per annum.
For the year ended 30 November 2023, PCFT’s ongoing charges ratio fell to 0.86% from 0.87% for the prior year.
Capital structure and life
PCFT has a simple capital structure with a single class of ordinary shares in issue and trades on the Main Market of the London Stock Exchange. As at 10 December 2024, there were 303,219,365 ordinary shares with voting rights and a further 28,530,635 shares held in treasury.
Five-yearly tender offers from 2025 onwards
PCFT has an unlimited life. With effect from 2025, the board intends to propose tender offers at five-yearly intervals. These would allow any shareholder who wishes to exit the company to do so at a price close to NAV.
Shares bought back as part of the tender offer process and any other shares bought back in the normal course of discount control may be held in treasury and reissued at a premium to asset value.
PCFT’s accounting year end is 30 November and AGMs are usually held in April.
Gearing
PCFT may borrow up to 20% of net assets at the time of drawdown. Since July 2022, PCFT has had access to a three-year revolving credit facility of up to £50m plus two three-year term loans one of £15m and the other of $18.4m. The facilities have been made available by RBS and all mature on 8 July 2025.
At end October 2024, PCFT had net gearing equivalent to 10.2% of NAV.
Major shareholders
Figure 19: Major shareholders
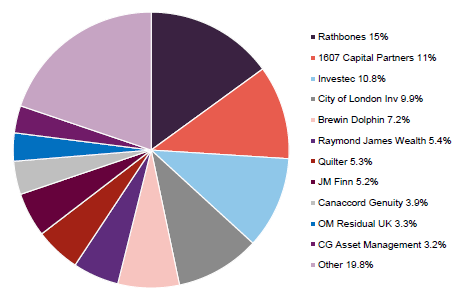
Source: Bloomberg
Management
The five-strong global financials team at Polar Capital LLC was managing £621m, as of end October 2024.
Nick Brind
Nick joined Polar Capital following the acquisition of HIM Capital in September 2010, and is co-manager of PCFT and the Polar Capital Financial Credit Fund. He has 29 years’ investment experience across a wide range of asset classes but since 2003 has focused on global financials. Before joining HIM Capital, Nick worked at New Star Asset Management. While there, he managed the New Star Financial Opportunities Fund, a high-income financials fund investing in the equity and fixed-income securities of European financials companies. Previous to that, he worked at Exeter Asset Management and Capel-Cure Myers. Nick has a Masters in Finance from London Business School.
George Barrow
George has been co-fund manager of PCFT since December 2020. He joined Polar Capital in September 2010 and is also the co-manager of the Polar Capital Financial Opportunities Fund. George has 15 years’ industry experience and over 10 years’ experience analysing Europe, Asia, and emerging markets. Prior to joining Polar Capital, he was an analyst at HIM Capital from 2008, where he completed his IMC. He has a Master’s Degree in International Studies from SOAS, where he graduated with merit.
Tom Dorner
Tom joined the team in December 2023 from abrdn, where he was a senior investment director in the developed markets team and managed the abrdn Europe ex UK Income Equity Fund. Tom was responsible for analytical coverage of European financials and managed a number of other European investment funds during his nine years there. Prior to this, he was an analyst specialising in the European Insurance sector at Citi and Lehman Brothers in London. He qualified as a Chartered Accountant with Ernst & Young in the Insurance Audit practice and has a BA (Hons) in War Studies from Kings College London, and an MA in Philosophy from the University of Nottingham.
Nabeel Siddiqui
Nabeel joined the Polar Capital Financials team as an analyst in August 2013 working closely with John Yakas and Nick Brind, focusing on the US, Latin America & Australia.
Prior to this, Nabeel worked as an operations executive at Polar Capital. He began his career in August 2008 with Habib Bank, where he worked within a variety of functions. He has a Master’s Degree in Money and Banking and has passed all three levels of the CFA.
Jack Deegan
Jack joined the Polar Capital Financials team as an analyst in October 2017 and is co-manager with Nick Brind on the Financial Credit Fund.
Prior to this, he worked at DBRS Ratings, covering the Swiss market as a lead analyst, as well as UK, Dutch, Japanese and Australian banks. Before DBRS, Jack worked in the Markets Division of the Bank of England for four years, assessing financial institutions with a view to determining access to the Bank’s Sterling Monetary Framework (SMF) facilities, and internal counterparty trading limits. He has a BA in Classical Archaeology & Ancient History from Oxford University and a Master’s Degree in Islamic Politics from SOAS.
Board
The board comprises four non-executive directors, all of whom are independent of the investment manager and who do not sit together on other boards.
Figure 20: Board member – length of service and shareholdings
| Position | Date of appointment | Length of service (years) | Annual director’s fee1 (GBP) | Shareholding1 | |
|---|---|---|---|---|---|
| Simon Cordery | Chair | 1 July 2019 | 5.4 | 43,000 | 41,358 |
| Susie Arnott | Director | 1 December 2022 | 2.0 | 31,000 | 20,000 |
| Angela Henderson | Director | 1 December 2022 | 2.0 | 31,000 | – |
| Cecilia McAnulty | Chair of the audit committee | 1 November 2021 | 3.1 | 36,750 | 40,000 |
Source: Polar Capital Global Financials Trust. Note 1) last available information as at 30 November 2023
Simon Cordery (chair)
A director since 2019, Simon was appointed chair of PCFT on 30 March 2023. He has over 40 years’ experience working within financial services, of which nearly 30 years have been focused on the wealth management industry. Most recently he was head of Investor Relations and Sales at BMO Global Asset Management, where he spent almost 25 years in senior roles. Previously, Simon held roles with Invesco Fund Managers, Jefferies & Co, Kleinwort Benson Securities and Rea Bros Merchant Bank. He has considerable and detailed knowledge of the investment trust industry and remains actively involved with the AIC. He is a Chartered Fellow of the Chartered Institute for Securities and Investment.
Susie Arnott (non-executive director)
Susie started her career in fund management over 20 years ago. She was primarily focused on the financial sector; including periods focused on emerging markets investments and global financials portfolios. Susie also spent a number of years working in ‘Impact Investing’, combining her experience and passion for social investment and impact measurement. In her current role, she continues to focus on investment with a global impact incorporating ESG as a mainstream consideration.
Susia is a director of Sableknight Limited and Lockfold Communications.
Angela Henderson (non-executive director)
Angela qualified as a solicitor and initially focused her career on corporate law before moving into financial services, where she spent time as an in-house lawyer and a director of global equities. Angela invested in and held non-executive board seats at small UK companies in the technology and asset management sectors and has previously served on the governing body of a London hospital foundation trust. She is currently a non-executive director and chair of risk for Macquarie Capital (Europe) Limited, non-executive director and chair of the Management and Service Provider Engagement Committee of Hargreave Hale AIM VCT plc and Wells Fargo Securities Limited, and has various other private interests.
Cecilia McAnulty (chair of the audit committee)
Cecilia is an experienced non-executive director and Chartered Accountant with almost 30 years’ investment and financial services experience. Her executive career included senior investing roles at Royal Bank of Scotland, Barclays Capital and Centaurus Capital and encompassed a broad range of asset classes including public and private debt and equity.
Cecilia is a non-executive director and audit chair of Northern 2 VCT Plc, and non-executive director of RIT Capital Partners Plc and Eurobank Cyprus Limited.
Previous publications
QuotedData has published a number of notes on PCFT. You can read these by clicking the links in the table below or by visiting the QuotedData.com website.
Figure 21: QuotedData’s previously published notes on PCFT
| Don’t fear a slowing economy | Initiation | 30 April 2019 |
| Banks too cheap to ignore | Update | 29 October 2019 |
| New lease of life | Update | 22 February 2020 |
| Too much pessimism? | Annual overview | 22 October 2020 |
| The tide has turned | Update | 25 February 2021 |
| More to go for | Annual overview | 18 November 2021 |
| Riding out the storm | Update | 5 April 2022 |
| Don’t fear the dog that is yet to bark | Annual overview | 30 November 2022 |
| Avoiding mishap | Update | 7 June 2023 |
| Pessimism overdone, time to buy | Annual overview | 12 December 2023 |
| Handful of themes to drive performance | Update | 13 June 2024 |
Source: Marten & Co
IMPORTANT INFORMATION
Marten & Co (which is authorised and regulated by the Financial Conduct Authority) was paid to produce this note on Polar Capital Global Financials Trust Plc.This note is for information purposes only and is not intended to encourage the reader to deal in the security or securities mentioned within it.Marten & Co is not authorised to give advice to retail clients. The research does not have regard to the specific investment objectives financial situation and needs of any specific person who may receive it.
The analysts who prepared this note are not constrained from dealing ahead of it, but in practice, and in accordance with our internal code of good conduct, will refrain from doing so for the period from which they first obtained the information necessary to prepare the note until one month after the note’s publication. Nevertheless, they may have an interest in any of the securities mentioned within this note.
This note has been compiled from publicly available information. This note is not directed at any person in any jurisdiction where (by reason of that person’s nationality, residence or otherwise) the publication or availability of this note is prohibited.
Accuracy of Content: Whilst Marten & Co uses reasonable efforts to obtain information from sources which we believe to be reliable and to ensure that the information in this note is up to date and accurate, we make no representation or warranty that the information contained in this note is accurate, reliable or complete. The information contained in this note is provided by Marten & Co for personal use and information purposes generally. You are solely liable for any use you may make of this information. The information is inherently subject to change without notice and may become outdated. You, therefore, should verify any information obtained from this note before you use it.
No Advice: Nothing contained in this note constitutes or should be construed to constitute investment, legal, tax or other advice.
No Representation or Warranty: No representation, warranty or guarantee of any kind, express or implied is given by Marten & Co in respect of any information contained on this note.
Exclusion of Liability: To the fullest extent allowed by law, Marten & Co shall not be liable for any direct or indirect losses, damages, costs or expenses incurred or suffered by you arising out or in connection with the access to, use of or reliance on any information contained on this note. In no circumstance shall Marten & Co and its employees have any liability for consequential or special damages.
Governing Law and Jurisdiction: These terms and conditions and all matters connected with them, are governed by the laws of England and Wales and shall be subject to the exclusive jurisdiction of the English courts. If you access this note from outside the UK, you are responsible for ensuring compliance with any local laws relating to access.
No information contained in this note shall form the basis of, or be relied upon in connection with, any offer or commitment whatsoever in any jurisdiction.
Investment Performance Information: Please remember that past performance is not necessarily a guide to the future and that the value of shares and the income from them can go down as well as up. Exchange rates may also cause the value of underlying overseas investments to go down as well as up. Marten & Co may write on companies that use gearing in a number of forms that can increase volatility and, in some cases, to a complete loss of an investment.