Recovery play
When we last published on Polar Capital Global Healthcare (PCGH), President Trump had just been elected, and while there were some nerves about Robert F. Kennedy Jr (RFK) being linked to the top job in the US health system, the mood was reasonably upbeat. The managers observed that the sector’s fundamentals (underlying financial and operational health of the sector, such as revenue growth and profitability) were strong, stocks looked cheap, and cautioned against worrying about the impact of politics on the sector. That might have been a rational stance last November, but the record of the past few months tells a different story.
The frustrating thing is that, outside of a few areas that are directly affected by US health policies, the fundamentals remain strong, and the stocks have only got cheaper. The sector feels oversold, and we think that PCGH, which can still boast the best long-term returns in the sector, should be a good way to play an eventual recovery.
Long-term capital growth from healthcare stocks
PCGH aims to deliver long-term capital growth to its shareholders by investing in a diversified global portfolio of healthcare stocks.
At a glance
Share price and discount
Over the 12 months ended 31 July 2025, PCGH’s share price discount to net asset value (NAV) moved within a range of 9.1% to 2.0% and averaged 5.2%. At 19 August 2025, PCGH was trading on a discount of 3.2%.
PCGH’s narrow discount reflects its strong track long-term record. It has also been helped by anticipation of a potential liquidity event as we approach its scheduled liquidation vote.
Time period 31 July 2020 to 19 August 2025
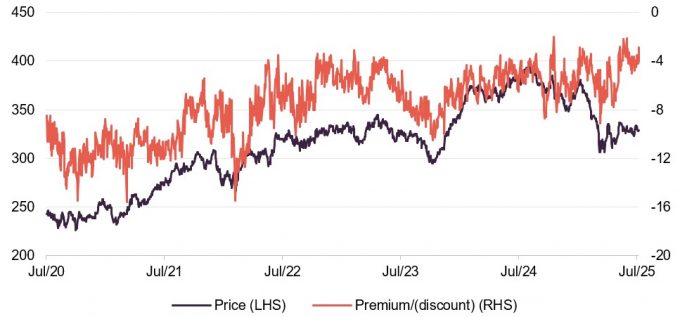
Source: Morningstar, Marten & Co
Performance over five years
Pleasingly, PCGH has made up the ground it lost relative to the benchmark in the first few months of the year and rebuilt its lead over the benchmark (both in NAV and share price terms) for the five-year period ended 31 July 2025 and, crucially, for the period since the last reconstruction in June 2017.
Time period 31 July 2020 to 31 July 2025
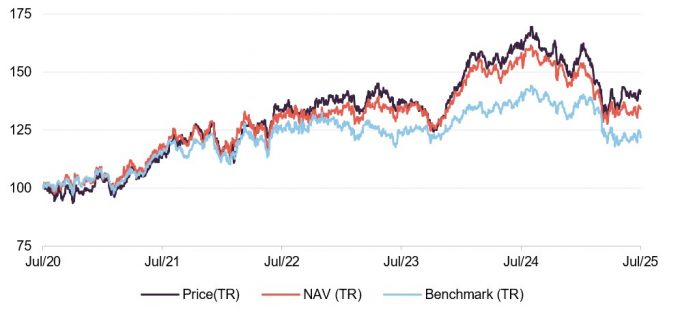
Source: Morningstar, Marten & Co
| Year ended | Share price total return (%) | NAV total return (%) | MSCI ACWI Healthcare total return (%) | MSCI ACWI total return (%) |
|---|---|---|---|---|
| 31/07/2021 | 14.1 | 18.4 | 15.1 | 25.7 |
| 31/07/2022 | 16.8 | 11.5 | 9.3 | 2.3 |
| 31/07/2023 | 2.5 | 1.9 | (1.7) | 6.8 |
| 31/07/2024 | 18.6 | 16.9 | 13.0 | 17.2 |
| 31/07/2025 | (12.5) | (14.6) | (13.0) | 12.5 |
Market backdrop – peak fear?
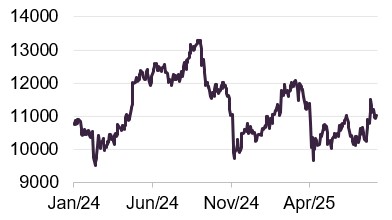
When we last published on PCGH in November 2024, there was a sense of optimism within the healthcare sector. However, from that month onwards, health care indices, and the biotech sector in particular, slumped.
Figure 1: MSCI ACWI Health Care
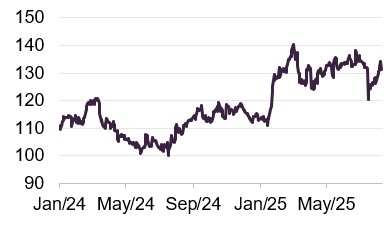
Figure 2: NASDAQ Biotechnology
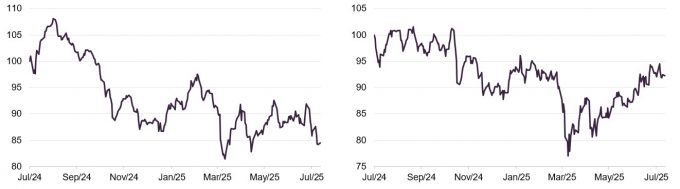
Source: Bloomberg, Marten & Co
Source: Bloomberg, Marten & Co
Trade tensions and tariff pronouncements account for much of the market volatility since November 2024. The market volatility that accompanied “Liberation Day” triggered another leg down in health care indices. However, whilst the biotech subsector has clawed its way back from this, the wider sector has not.
Concern has grown, too, about the impact of Trump’s “One Big Beautiful Bill” (OBBB) on the US deficit, and this has been compounded by threats towards the independence of Federal Reserve. Nevertheless, the wider market has made progress.
The gulf between the 12.5% positive return on the MSCI All Countries World Index (ACWI) over the 12 months ended 31 July 2025 shown in the table on the front page of this note and the 13.0% fall in PCGH’s benchmark reflects, in part, investors’ continued fixation on mega-cap AI plays. However, there have also been a number of negative headlines affecting the healthcare sector and, as PCGH’s manager has highlighted, this has driven substantial outflows from both active and passive (index-tracking) funds focused on this area.
PCGH co-manager James Douglas wrote an article in June in which he said that we could soon reach or already be at “peak fear” (a term used to describe the point of maximum pessimism among investors, potentially signalling a turnaround).
The confirmation of vaccine sceptic and pseudoscience promoter RFK as Health Secretary has been followed by a wholesale shake-up of the various bodies that fall under his control. Recent confirmation of the termination of a $500m mRNA vaccine development programme and his call to suppress a study that ran counter to his views on vaccine safety and efficacy are unnerving. Cuts to research funding through the National Institutes of Health (NIH) already appear to be having an effect on demand for lab equipment in the US.
Several commentators have claimed that the FDA (Food and Drug Administration) will be run more efficiently, including using AI to speed up reviews of applications, and this would lead to speedier approvals of new therapies. A more pragmatic approach was proposed for the review of therapies targeted at rare diseases. However, there are also concerns that staff shortages are causing delays.
A projected $1trn cut to the budget for Medicaid (a joint federal and state programme in the United States that provides free or low-cost health coverage to eligible low-income individuals and families) in the OBBB is weighing on some managed healthcare providers that are exposed to this part of the market.
In May, one of Trump’s blizzard of executive orders was aimed at ensuring that Americans pay no more for drugs than patients in other similar countries. However, the practicalities of this are yet to be worked out.
Another proposal is to force drug companies to bring manufacturing back to the US by imposing tariffs of up to 200% on imports. A Section 232 investigation into the pharmaceutical industry is underway (this allows the US government to investigate whether imports threaten national security). If it justifies the tariffs, pharmaceutical firms with manufacturing centres in places such as Ireland and Switzerland could be affected.
The US is the largest healthcare market in the world by some distance, and disruption and the creation of uncertainty from the top does have a real impact, therefore. However, the PCGH team thinks that the market has significantly overreacted and valuations in the sector no longer reflect reality. The managers continue to highlight six key drivers that they believe underpin the sector’s long-term growth prospects, and they confirm that all of these remain intact.
Six drivers
- Delivery disruption: the trend towards treating patients outside of a hospital setting. This is made much easier by technological advances in areas such as telemedicine (the remote diagnosis and treatment of patients).
- Innovation: incredible advances in research are opening up new avenues for therapies, some targeting previously incurable diseases. The managers cite opportunities in gene and cell therapy, targeted oncology (cancer treatments that attack specific molecular targets), novel vaccines, and rare diseases as examples. However, the innovation theme also applies in the area of medical devices.
- M&A: a combination of cash-rich pharmaceutical companies facing a looming patent cliff (the expiration of patents on major drugs) and undervalued biotech stocks, many of which are trading at less than the value of the cash on their balance sheet, makes the environment ripe for further consolidation.
- Emerging markets: The Polar team sees considerable opportunities in under-served emerging markets. For example, China’s ageing population represents a vast attractive market. The managers note an improving economic backdrop, increasing numbers of acquisitions of Chinese companies and in-licensing activity with Chinese partners.
- Outsourcing: Notwithstanding the Trump regime’s efforts to throw grit into the machinery of cross-border trade, it makes sense for companies to streamline their businesses by outsourcing non-core activities, and the managers expect that this trend will continue.
- Disease prevention: this includes vaccines, but also improvement in diagnostics that ensure patients are treated earlier and more effectively to achieve better outcomes.
In addition, the managers highlight the important role that AI has to play in the sector. There are often-touted applications in drug discovery and the handling of large data sets for claims management, for example, but also in processing scans and as an aid to diagnosis.
Asset allocation
Maintaining the portfolio’s underweight exposure to the US
Our last note used portfolio data as at 30 September 2024. The gyrations in markets and the shifts in sentiment have necessitated some repositioning of the portfolio since then. However, relative to end-September 2024, the geographic exposures of the portfolio at the end of June are not materially different. The portfolio remains very underweight the US. India has replaced Japan, the exposure to Denmark and the UK has risen, and there is a little less in Ireland, and France.
Figure 3: Portfolio by country as at 31 July 2025
Figure 4: Portfolio country weights relative to benchmark as at 31 July 2025
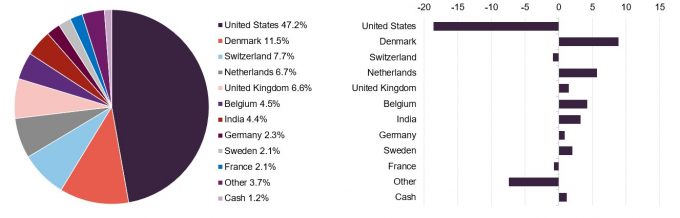
Source: Polar Capital
Source: Polar Capital
The portfolio is also still as underweight pharmaceuticals as it was last September, but with a greater overweight exposure to healthcare equipment, less in life sciences tools and services, and less in managed healthcare.
There were 37 positions in the portfolio at the end of July (the same as nine months prior). The active share had risen from 67% to 73%.
There is no gearing (rather, a net cash position of 1%).
Figure 5: Portfolio by sector as at 31 July 2025
Figure 6: Portfolio sector weights relative to benchmark as at 31 July 2025
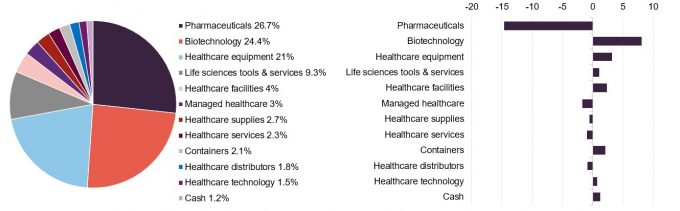
Source: Polar Capital
Source: Polar Capital
Top 10 holdings
Since we last reported (using data as at 30 September 2024), Novo Nordisk, AbbVie, Roche, Sanofi, Fresenius, Sandoz, and Terumo have dropped out of the top 10 holdings to be replaced by AstraZeneca, Abbott Laboratories, UCB, Thermo Fisher Scientific, Argenx, Edwards Lifesciences, and Ascendis Pharma.
Figure 7: PCGH 10 largest holdings as at 31 July 2025
| Stock | Sector | Country | % at 31/07/25 | % at 30/09/24 | % change |
|---|---|---|---|---|---|
| Eli Lilly & Co | Pharmaceuticals | United States | 7.2 | 7.9 | (0.7) |
| AstraZeneca | Pharmaceuticals | United Kingdom | 6.6 | – | 6.6 |
| Abbott Laboratories | Healthcare equipment | United States | 4.9 | – | 4.9 |
| UCB | Pharmaceuticals | Belgium | 4.5 | 2.8 | 1.7 |
| Thermo Fisher Scientific | Life science tools & services | United States | 4.3 | – | 4.3 |
| Argenx | Biotechnology | Netherlands | 4.2 | 2.2 | 2.0 |
| Intuitive Surgical | Healthcare equipment | United States | 3.4 | 3.0 | 0.4 |
| United Health Group | Managed healthcare | United States | 3.0 | 7.7 | (4.7) |
| Edwards Lifesciences | Healthcare equipment | United States | 3.0 | – | 3.0 |
| Ascendis Pharma | Biotechnology | Denmark | 2.9 | – | 2.9 |
| Total | 43.9 |
Looking at some of the portfolio changes in more detail:
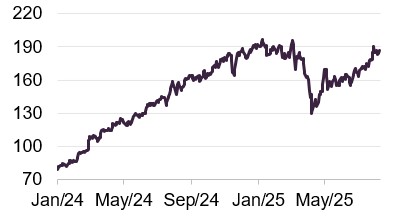
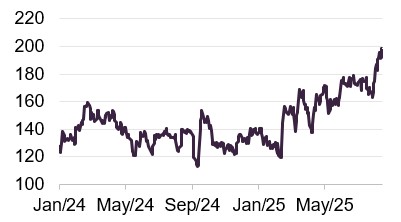
AstraZeneca
Figure 8: AstraZeneca (GBp)
Source: Bloomberg
AstraZeneca
AstraZeneca (astrazeneca.com) is an Anglo/Swedish pharmaceutical company with a diversified portfolio of products covering oncology, cardiovascular renal and metabolic (CVRM), respiratory and immunology, vaccines and immune therapies, and rare disease.
The company has a large number of potential therapies in development, with 12 positive Phase III trial (the final and generally most expensive stage of drug testing before regulatory approval) readouts in H1 2025 that the company suggests have a combined potential revenue of over $10bn.
Results for the first six months of 2025 were good, with total revenue up 11% and a 17% growth in EPS.
AstraZeneca has an ambition to achieve $80bn of revenue in 2030 (for reference H1 2025 revenues were $28bn) and launch at least 20 new drugs by then. The message from its management is that it is on track to deliver this.
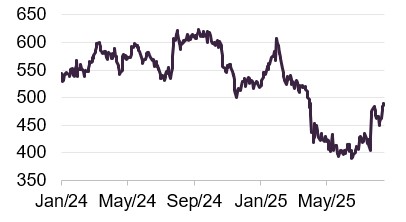
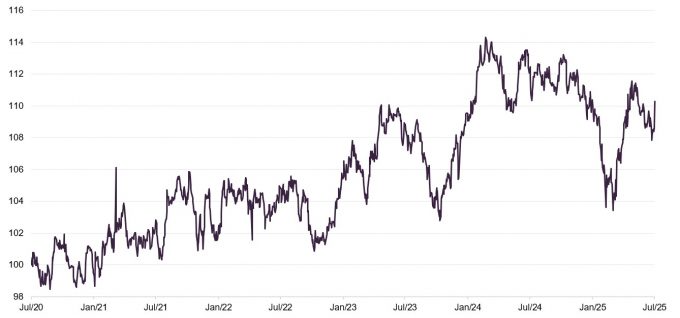
Abbott Laboratories
Figure 9: Abbott Laboratories (USD)
Source: Bloomberg
Abbott Laboratories (abbott.com) is a $226bn market cap company with specialities in medical devices (notably cardiovascular products such as pacemakers, and diabetes care devices such as wearable glucose monitors), diagnostics, nutrition, and branded generic pharmaceuticals.
Organic sales (sales growth excluding acquisitions, disposals, or currency effects) grew about 7.5% during the second quarter, supported by strong contributions from its cardiology business. The company recently won FDA approval for an artificial mitral valve (which regulates the flow of blood through the heart). It is also trialling a device aimed at managing atrial fibrillation (an irregular heartbeat condition that can lead to stroke or heart failure). The full-year guidance is for 7.5% to 8.0% growth across the business, sustaining the momentum from the first half of the year (H1).
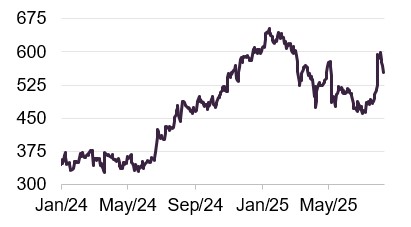
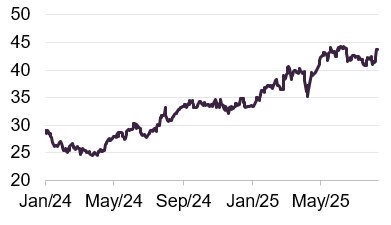
UCB
Figure 10: UCB (EUR)
Source: Bloomberg
UCB (ucb.com) is a Belgium-headquartered global biopharmaceutical business, focused on neurological and autoimmune conditions.
For its financial year ending in 2025 (FY25), UCB is targeting sales of at least €7bn, a 30%+ EBITDA margin and core EPS of at least €7.25. UCB has had recent success with the launch of a psoriasis treatment and drugs targeted at managing epilepsy, which have contributed to 26% growth in revenue for H1 2025.
The company’s pipeline includes trials of a drug for use in paediatric psoriasis, hidradenitis suppurativa, and juvenile idiopathic arthritis. In addition, the company plans to launch a Phase III programme which includes evaluating a treatment for palmoplantar pustulosis (PPP) and another trial for patients with Rett Syndrome.
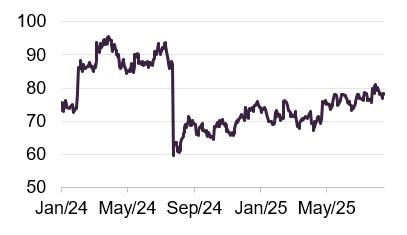
Thermo Fisher Scientific
Figure 11: Thermo Fisher (USD)
Source: Bloomberg
Thermo Fisher Scientific (thermofisher.com) is a beneficiary of the trend to outsourcing. It operates in four divisions – life sciences solutions, analytical instruments, speciality diagnostics, and laboratory products and biopharma services.
The share price had been coming off, possibly on fears of the impact of NIH cuts on demand for its products and services. However, H1 2025 figures were well received, with 3% growth in revenue and 6% growth in diluted EPS. The company is said to have put part of its lower growth diagnostics business up for sale.
Argenx
Figure 12:Argenx (EUR)
Source: Bloomberg
Argenx (argenx.com) specialises in immunology. In particular, it is focused on areas where a particular type of antibody called IgG (immunoglobulin G, the most common type of antibody in the blood and immune system) are often the cause of the disease. These include myasthenia gravis (a chronic autoimmune neuromuscular disease), immune thrombocytopenia (a disorder causing low platelet counts and bleeding risk), and chronic inflammatory demyelinating neuropathy (a rare nerve disorder causing weakness and impaired sensation). Argenx already markets treatments in these areas, has 15 additional candidates in development, and has a number of pre-clinical pipeline candidates.
Argenx is also collaborating with a number of other firms on a programme of externally-sponsored research.
The success of new products is evident in a big (97%) jump in revenue for H1 2025 compared to the same period last year, which fed through into a basic profit per share of $6.80, which is a marked improvement on the prior year’s loss of $0.55 per share.
Edwards Lifesciences
Figure 13: Edwards Lifesciences (USD)
Source: Bloomberg
Edwards Lifesciences (edwards.com) is focused on cardiovascular disease. Its leading product is in transcatheter aortic valve replacement (TAVR) – a procedure used to replace a damaged aortic valve – but it also has fast-growing therapies aimed at treating mitral and tricuspid (TMTT) diseases (valve conditions affecting blood flow in the heart).
The selloff in the share price around the time of last year’s H1 figures was related to disappointing figures for the TAVR business. However, this area has since picked up. H1 2025 number show 11.9% growth in revenues, and it guided towards 9–10% growth over2025 as a whole. It also guided towards EPS at the high end of a range of $2.40–$2.50.
Ascendis Pharma
Figure 14: Ascendis Pharma (DKK)
Source: Bloomberg
Ascendis Pharma (ascendispharma.com) is a biopharmaceutical company. Its “TransCon” transient conjugation technology is designed to release drugs evenly over time. It works by binding an inert carrier drug to the active ingredient. By distributing the dose in this way, the patient gets the benefit of the drug over a longer period of time (improving patient outcomes), which can mean it can be taken less often (lowering the dosing frequency).
Ascendis has a range of products in clinical development. Two products that are already approved are targeted at hormone replacement and delivering a human growth hormone used for the treatment of growth hormone deficiency. A third product aimed at treating children with achondroplasia (a rare genetic bone growth disorder that causes dwarfism) is about to go into Phase III trials.
Performance
Pleasingly, PCGH has made up the ground it lost relative to the benchmark in the first few months of the year and rebuilt its lead over the benchmark (both in NAV and share price terms) for the five-year period ended 31 July 2025 and, crucially, for the period since the last reconstruction in June 2017.
In the next section, we delve deeper into the stocks that drove PCGH’s returns over the first half of 2025. The numbers also highlight the underperformance of the healthcare sector relative to the wider market during this period.
Figure 15: PCGH NAV total return performance relative to benchmark over five years ended 31 July 2025
Source: Morningstar, Marten & Co
Figure 16: Total return performance for periods ending 31 July 2025
| 3 months (%) | 6 months (%) | 1 year (%) | 3 years (%) | 5 years (%) | Since 20 June 2017 (%) | |
|---|---|---|---|---|---|---|
| PCGH price | 0.9 | (12.3) | (12.5) | 6.4 | 41.9 | 65.3 |
| PCGH NAV | (1.4) | (12.6) | (14.6) | 1.7 | 34.2 | 68.3 |
| Benchmark | (3.5) | (12.8) | (13.0) | (3.3) | 21.7 | 61.6 |
| NASDAQ Biotech | 5.9 | (7.2) | (9.9) | 7.7 | 8.9 | 41.5 |
| MSCI ACWI | 13.0 | 1.3 | 12.5 | 40.8 | 81.0 | 118.7 |
Top contributors
Over the six months to end June 2025, PCGH’s portfolio underperformed the benchmark by a small (37bps) margin. On a sector basis, the trust’s exposure to heath care distributors, health care supplies, and life sciences tools and services was a positive. However, the trust’s biotechnology exposure was a big detractor from returns.
Figure 17: Top positive contributors to return relative to benchmark 30 June 2025 YTD
| Stock | Average stock weight (%) | Active weight (%) | Stock return (%) | Stock return versus benchmark (%) | Contribution (%) |
|---|---|---|---|---|---|
| Fresenius | 3.23 | 2.99 | 34.78 | 42.40 | 1.10 |
| Uniphar | 1.18 | 1.18 | 83.54 | 91.15 | 0.75 |
| ConvaTec | 2.11 | 2.11 | 30.38 | 38.00 | 0.72 |
| Cardinal Health | 2.13 | 1.69 | 29.67 | 37.29 | 0.67 |
| Sandoz | 2.45 | 2.20 | 21.89 | 29.51 | 0.63 |
Fresenius
Figure 18: Fresenius (EUR)
Source: Bloomberg
Fresenius (fresenius.com) is a German healthcare business. We discussed it in our November 2024 PCGH note (a link to which is provided at the end of this report). As we highlighted then, the company has restructured its business into two divisions with the aim of improving its profitability and PCGH’s managers were also enthused about the prospects of its biosimilars business (near-identical copies of approved biological medicines, usually sold at lower cost once patents expire). H1 2025 numbers showed 5% organic revenue growth and an 8% growth in EPS. The company guided towards full-year revenue growth of 5–7% and said that its execution of a launch pipeline for both IV (intravenous) generics and biosimilars was progressing well.
Others
Uniphar (uniphar.ie) is a healthcare services business benefitting from the growth of outsourcing both in medtech and pharmaceuticals. EPS grew in double digits in H1 2025, underpinned by 8% organic revenue growth. The results exceeded the company’s own expectations. It has also been buying back its stock.
ConvaTec (convatecgroup.com) is focused on the management of chronic conditions in areas such as wound care, stoma, continence, and infusions. After a good H1, the share price has slipped a bit since. Its AGM update released in May was upbeat, describing broad-based organic growth for the business. The H1 results announcement published in July maintained guidance for margins in the 22–22.5% range, but mentioned a small tariff-related headwind.
Cardinal Health (cardinalhealth.com) has also seen its share price come off since the end of June. It is a distributor of pharmaceuticals, a global manufacturer and distributor of medical and laboratory products, and a provider of performance and data solutions for healthcare facilities. It actually upgraded its EPS guidance for 2026 in its results announcement for the 12 months ended 30 June 2025. However, revenue came in slightly behind expectations.
Sandoz (sandoz.com) is a Swiss firm that was spun out of Novartis in 2023, with a portfolio of about 1,300 quality generic and biosimilar medicines. The share price has recovered from the impact of Liberation Day and continues to hit new highs. This was helped by H1 2025 figures that showed year-on-year EPS growth of 33% and guidance towards mid-single-digit revenue growth for the year as a whole.
Figure 19: Top negative contributors to return relative to benchmark 30 June 2025 YTD
| Stock | Average stock weight (%) | Active weight (%) | Stock return (%) | Stock return versus benchmark (%) | Contribution (%) |
|---|---|---|---|---|---|
| Zealand Pharma | 2.45 | 2.40 | (48.58) | (40.97) | (1.26) |
| Globus Medical | 1.99 | 1.99 | (34.86) | (27.24) | (0.75) |
| Vaxcyte | 1.18 | 1.18 | (63.75) | (56.13) | (0.67) |
| Bruker | 1.87 | 1.87 | (35.84) | (28.22) | (0.57) |
| Cytokinetics | 1.74 | 1.74 | (35.88) | (28.26) | (0.54) |
Zealand Pharma
Figure 20: Zealand Pharma (DKK)
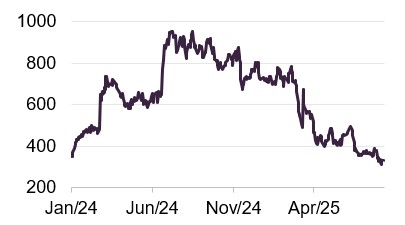
Source: Bloomberg
When we last published on PCGH, Zealand Pharma (zealandpharma.com) was the largest positive contributor to PCGH’s returns, helped by positive clinical trial data on two of its obesity assets. Last October, there was a setback for a hoped-for FDA approval of a drug to treat hypoglycaemia in infants. However, that should not have been enough to derail the share price. Then in March 2025, it announced a collaboration and licence agreement with Roche to commercialise an obesity drug that Zealand believes could deliver weight loss comparable to GLP-1 receptor agonists (a drug class used in diabetes and obesity treatment) but with improved tolerability. For Zealand, the numbers involved are significant, with upfront cash payments of $1.65bn and potential milestone payments that could add up to a total consideration of $5.3bn.
Others
Globus Medical’s (globusmedical.com) Q1 numbers came in below estimates, held back in part by disruption related to the integration of a recent acquisition. However, the company has since launched a sizable share buyback programme and beaten expectations for its Q2 figures.
Vaxcyte’s (vaxcyte.com) share price dived at the end of March after investors decided that the results from a Phase II trial of its pneumococcal vaccine were mixed. It has also been caught up in the general anti-vax rhetoric coming from the US government.
Bruker (bruker.com) has been hit by slower demand for life science instruments, which has not been helped by cuts to NIH funding.
Cytokinetics (cytokinetics.com) featured in the detractors table in our last note. It was thought to be an acquisition target, but as yet no suitors have emerged.
Peer group
PCGH is the third-largest trust in the sector, yet has the second-lowest ongoing charges ratio, helped by its competitive fee structure. Yield has not been a consideration for PCGH (the two trusts with high yields are paying dividends from capital). PCGH’s discount is the lowest in the sector.
Figure 21: AIC Biotech and healthcare sector as at 19 August 2025
| Premium/ (discount) (%) | Dividend yield (%) | Ongoing charge (%) | Market cap (£m) | |
|---|---|---|---|---|
| Polar Capital Global Healthcare | (3.2) | 0.7 | 0.88 | 411 |
| Bellevue Healthcare | (4.1) | 4.8 | 1.03 | 158 |
| International Biotechnology | (10.1) | 4.8 | 1.20 | 224 |
| RTW Biotech Opportunities | (23.0) | 0.0 | 1.75 | 345 |
| Syncona | (44.4) | 0.0 | 1.62 | 577 |
| The Biotech Growth | (10.1) | 0.0 | 1.10 | 210 |
| Worldwide Healthcare | (6.4) | 0.7 | 0.80 | 1,423 |
| PCGH rank | 1/7 | 4/7 | 2/7 | 3/7 |
In terms of PCGH’s investment remit, Bellevue Healthcare and Worldwide Healthcare are the closest to PCGH in that they also aim to offer exposure to the whole sector rather than a narrow focus on biotechnology. Bellevue’s consistently poor returns have forced it to launch a strategic review into its future. Worldwide Healthcare has maintained a constant bias to biotechnology relative to its benchmark, which acted as a drag on its long-term returns but has provided a short-term relative boost.
As we show in Figure 22, PCGH remains the best-performing trust in its sector over five years and since the restructuring in 2017.
Figure 22: Total return NAV performance for periods ending 31 July 2025
| 3 months (%) | 6 months (%) | 1 year (%) | 3 years (%) | 5 years (%) | Since 20 June 2017 (%) | |
|---|---|---|---|---|---|---|
| Polar Capital Global Healthcare | (1.4) | (12.6) | (14.6) | 1.7 | 34.2 | 68.3 |
| Bellevue Healthcare | (2.8) | (23.8) | (21.7) | (23.8) | (11.1) | 32.5 |
| Worldwide Healthcare | 2.8 | (11.5) | (12.5) | (1.0) | 4.6 | 44.2 |
| International Biotechnology | 6.4 | (8.7) | (4.3) | 15.8 | 20.0 | 55.3 |
| RTW Biotech Opportunities | (2.0) | (15.5) | (19.5) | 14.9 | 24.0 | n/a |
| Syncona | 0.0 | (4.5) | (4.7) | (13.6) | (18.8) | 30.2 |
| The Biotech Growth Trust | 11.2 | (7.0) | (17.9) | (1.3) | (24.5) | 9.7 |
| PCGH rank | 5/7 | 5/7 | 4/7 | 3/7 | 1/7 | 1/6 |
Premium/(discount)
Figure 23: PCGH premium/(discount) over five years ended 31 July 2025
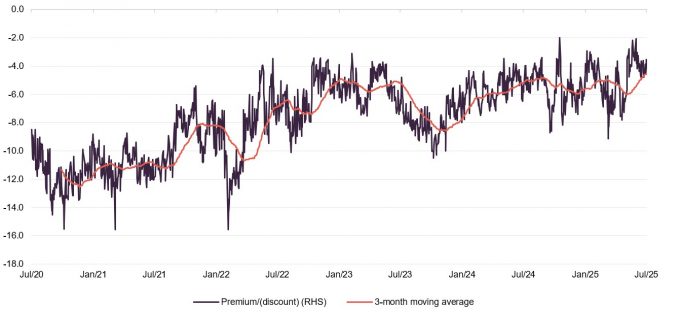
Source: Morningstar, Marten & Co
Over the 12 months ended 31 July 2025, PCGH’s discount moved within a range of 9.1% to 2.0% and averaged 5.2%. At 19 August 2025, PCGH was trading on a discount of 3.2%.
PCGH’s narrow discount reflects its strong track long-term record. It has also been helped by anticipation of a potential liquidity event (an opportunity for investors to sell shares back to the trust or realise value) as we approach its scheduled liquidation vote (see below).
Fund profile
PCGH aims to generate capital growth through investments in a global portfolio of healthcare stocks that is diversified by geography, industry subsector and investment size.
More information is available on the trust’s website polarcapitalglobalhealthcaretrust.co.uk
PCGH started life in 2010 as Polar Capital Global Healthcare Growth and Income Trust with an issue of ordinary shares and subscription shares. The subscription shares were exercised in full in July 2014 and this distorts the trust’s NAV returns for that early period. In June 2017, the trust was reconstructed and adopted its current name. About 26.3m shares were bought back and 27.8m shares issued around that time. The trust also took on gearing in the form of zero dividend preference shares (shares that pay no dividends but guarantee a fixed amount back at maturity).
PCGH has a fixed life, but this might be extended
Unless shareholders instruct otherwise, the board is obligated to put forward a liquidation vote for the trust at the first AGM to be held after 1 March 2025. The board has started work with its advisors to potentially bring forward proposals for a corporate reorganisation in the second half of 2025.
The board will consider all options, and if there is appetite for a continuation of the company, alternative resolutions may be put to shareholders ahead of the 2026 AGM, removing the requirement to put forward a liquidation resolution.
The team has considerable real-world experience of the pharma and biotech industry
PCGH’s investment manager and AIFM is Polar Capital LLP. The lead managers on the trust are James Douglas and Gareth Powell. The management team has considerable real-world experience of the pharma and biotech industry, which should help inform their investment decisions.
PCGH’s performance is benchmarked against the total return of the MSCI ACWI Health Care Index (in sterling).
SWOT and bull vs. bear analysis
Figure 24: SWOT analysis
| Strengths | Weaknesses |
|---|---|
| Good long-term track record | An unpredictable policy environment is hard to navigate |
| Good record of discount management | |
| Opportunities | Threats |
| Sector is oversold – stocks are cheap | A continued surge in biotech could affect relative returns, so could a big uplift in US pharma |
| The fundamentals of the sector are strong |
Figure 25: Bull versus bear case
| Bull | Bear | |
|---|---|---|
| Performance | Great long-term track record | Biotech underweight versus peers could hurt perception if rally persists |
| Outlook | Avalanche of adverse headlines has left sector cheap – only way is up? | US healthcare policy inflicts lasting damage on the sector, permanently lower drug prices, for example |
| Discount | Likely upcoming exit opportunity should keep discount tight | If Bellevue disappears, PCGH could look expensive relative to peers |
Previous publications
Readers interested in further information about PCGH may wish to read our earlier notes, Healthy returns and a rosy outlook – which was published on 5 March 2024 – and Vital signs are good – which was published on 14 November 2024.
IMPORTANT INFORMATION
Marten & Co (which is authorised and regulated by the Financial Conduct Authority) was paid to produce this note on Polar Capital Global Healthcare Trust Plc.
This note is for information purposes only and is not intended to encourage the reader to deal in the security or securities mentioned within it. Marten & Co is not authorised to give advice to retail clients. The research does not have regard to the specific investment objectives financial situation and needs of any specific person who may receive it.
The analysts who prepared this note are not constrained from dealing ahead of it but, in practice, and in accordance with our internal code of good conduct, will refrain from doing so for the period from which they first obtained the information necessary to prepare the note until one month after the note’s publication. Nevertheless, they may have an interest in any of the securities mentioned within this note.
This note has been compiled from publicly available information. This note is not directed at any person in any jurisdiction where (by reason of that person’s nationality, residence or otherwise) the publication or availability of this note is prohibited.
Accuracy of Content: Whilst Marten & Co uses reasonable efforts to obtain information from sources which we believe to be reliable and to ensure that the information in this note is up to date and accurate, we make no representation or warranty that the information contained in this note is accurate, reliable or complete. The information contained in this note is provided by Marten & Co for personal use and information purposes generally. You are solely liable for any use you may make of this information. The information is inherently subject to change without notice and may become outdated. You, therefore, should verify any information obtained from this note before you use it.
No Advice: Nothing contained in this note constitutes or should be construed to constitute investment, legal, tax or other advice.
No Representation or Warranty: No representation, warranty or guarantee of any kind, express or implied is given by Marten & Co in respect of any information contained on this note.
Exclusion of Liability: To the fullest extent allowed by law, Marten & Co shall not be liable for any direct or indirect losses, damages, costs or expenses incurred or suffered by you arising out or in connection with the access to, use of or reliance on any information contained on this note. In no circumstance shall Marten & Co and its employees have any liability for consequential or special damages.
Governing Law and Jurisdiction: These terms and conditions and all matters connected with them, are governed by the laws of England and Wales and shall be subject to the exclusive jurisdiction of the English courts. If you access this note from outside the UK, you are responsible for ensuring compliance with any local laws relating to access.
No information contained in this note shall form the basis of, or be relied upon in connection with, any offer or commitment whatsoever in any jurisdiction.
Investment Performance Information: Please remember that past performance is not necessarily a guide to the future and that the value of shares and the income from them can go down as well as up. Exchange rates may also cause the value of underlying overseas investments to go down as well as up. Marten & Co may write on companies that use gearing in a number of forms that can increase volatility and, in some cases, to a complete loss of an investment.