Looking oversold
Rights and Issues Investment Trust (RIII) is battling a number of headwinds. UK small caps face a lacklustre UK economy, a looming budget that is creating market uncertainty, and seemingly indifferent domestic and international investors. To this we can add a large shareholder who appears to be actively frustrating efforts by RIII’s board to improve the lot of investors. This has led to a widening of RIII’s discount, which makes it amongst the worst-performing of all UK small-cap trusts over the past 12 months.
The upshot of this is that RIII looks cheap relative to peers and its history, and so does its portfolio. The upside, if things turn around, could be dramatic.
Concentrated exposure to UK small- and mid-caps
RIII’s objective is to exceed the FTSE All Share total return over the long term, while managing risk. RIII invests in equities with an emphasis on small- and mid-cap companies. UK smaller companies include both listed securities and those admitted to trading on the Alternative Investment Market (AIM).
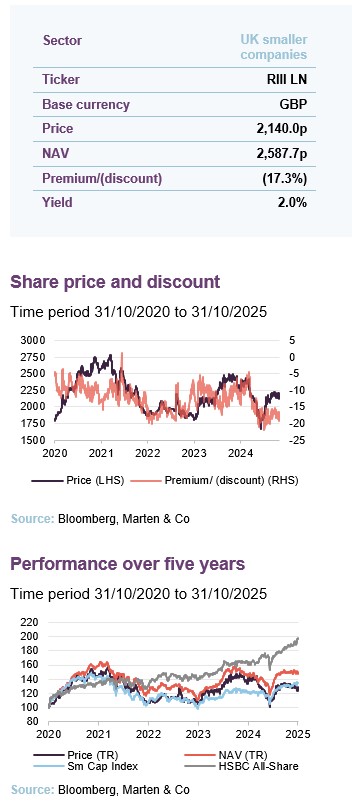
| Year ended | Share price total return (%) | NAV total return (%) | Small cap benchmark1 TR (%) | HSBC FTSE All-Share TR1 (%) |
|---|---|---|---|---|
| 31/10/2021 | 44.7 | 59.1 | 42.7 | 34.6 |
| 31/10/2022 | (26.2) | (22.6) | (25.1) | (2.6) |
| 31/10/2023 | (0.8) | (8.5) | (5.8) | 6.3 |
| 31/10/2024 | 34.9 | 28.4 | 20.3 | 15.4 |
| 31/10/2025 | (11.2) | 2.1 | 11.0 | 22.6 |
Fund profile
Rights and Issues Investment Trust (RIII) aims to generate a total return that exceeds its benchmark index, the FTSE All Share, over the long term while managing risk. The company invests in equities with an emphasis on UK smaller companies, which will normally constitute at least 80% of its investment portfolio. For the purposes of RIII’s portfolio construction, “UK smaller companies” is deemed to include both listed securities and those admitted to trading on the Alternative Investment Market (AIM). The benchmark does not influence portfolio construction.
More information is available on the manager’s website
For the purposes of this note, we have used the HSBC FTSE All-Share Index Class C Accumulation as a proxy for the FTSE All-Share and added a comparison to the Deutsche Numis Smaller Companies ex Investment Companies plus AIM Index, which we believe is more representative of the stocks in RIII’s portfolio.
RIII’s AIFM has delegated investment management of the trust to Jupiter Asset Management Limited. Dan Nickols and Matt Cable took over responsibility for the trust in October 2022. Dan retired at the end of July 2024 and Matt became lead manager, supported by Tim Service.
Investment process
A collegiate approach
Most of the team are both portfolio managers and sector analysts meaning that they work collegiately, inputting into each other’s portfolios. The team is tasked with researching and investing in UK-listed businesses outside the FTSE 100. Stock ideas are put forward to the wider team for consideration and are discussed in weekly team meetings, with ideas challenged in an open forum.
Driven by fundamental analysis
As is discussed in greater detail in the stock selection section below, the manager’s investment process incorporates a mixture of top-down and bottom-up considerations, and is driven by extensive fundamental analysis of potential portfolio candidates.
Concentrated high-conviction portfolio
20 to 30 high conviction best ideas
RIII has a concentrated portfolio that comprises 20 to 30 stocks, representing the team’s highest-conviction ideas (the other funds that the team manages tend to have about 60 positions).
While discussing portfolio concentration, it is worth noting that the Jupiter team operates with a self-imposed 20% maximum position in a single investment, and the creation of any position size greater than 10% automatically triggers an internal approval process. However, in constructing RIII’s portfolio, position sizes are driven primarily by the manager’s level of conviction in a stock, while taking into account the factors such as market cap and liquidity.
Focusing on the small and mid-cap segments
RIII’s portfolio is focused on SMID stocks as its manager feels that it has more of a competitive edge in this less-researched segment.
The stock selection process
The investment process is a mixture of both bottom-up and top-down considerations
RIII’s portfolio is managed using a mixture of bottom-up and top-down inputs. In the top-down element of the process, the team considers macroeconomic factors, industry trends and the like to identify sectors and themes that it wishes to allocate to. However, when it comes to selecting stocks within these preferred areas, the process is driven by bottom-up fundamental analysis of companies. However, the team emphasises that there is no one-size-fits-all approach to small-cap investing; companies’ idiosyncrasies prevent a cookie-cutter approach to analysis.
The quality of company management is important. The Jupiter team observes that the key decision makers within a SMID company can have a significant impact (the more complex structures frequently seen within larger companies can blunt this). Analysis of a business’s financials and its strategic direction are also very important.
Understand a company’s business model, its financial structure and the sustainability of its earnings
Through its analysis, Jupiter seeks to gain a thorough understanding of a company’s business model, its financial structure, and the sustainability of its earnings. Sustainability can come in different forms – market leaders with strong balance sheets should be better positioned to ride out economic storms, for example, but adaptable management can also create opportunity out of adversity.
The team seeks to identify positive surprise opportunities by interrogating sell-side forecasts that are genuinely representative of where market consensus views sit. Finding instances where companies are under-forecast can offer scope to add value by being positioned ahead of forecast upgrades that are not anticipated by the wider market. The team typically uses a short, two-year time horizon, and prefers simple metrics (such as P/E) when valuing a company. However, it emphasises that this is not always appropriate, and it is important to take a balanced and flexible approach in all aspects of the investment process.
Investments being considered for inclusion within the portfolio are assigned into three broad categories based on their potential for growth, rerating, or profit upgrades. These categories are not mutually exclusive, however, and ideally a company can demonstrate qualities of all three categories. It is worth noting that the team’s research output is applied to a range of funds and RIII, with its closed-end structure, is a strong fit with the range.
ESG
Jupiter believes that it has an important role to play in the allocation of capital, both as active owners and long-term stewards of the assets in which it invests on behalf of clients. Analysis of ESG issues is embedded within the investment process and this is not an area that it feels it can or should outsource to third parties.
Investee companies should exhibit high standards of corporate governance, and where the managers feel that they are falling short in this area, the team will engage with companies.
With respect to environmental factors, the manager supports the Task Force on Climate Related Financial Disclosures (TCFD) and encourages companies to provide accurate and timely disclosure in line with the four thematic pillars of the TCFD framework.
The manager believes in quality over quantity when it comes to engagement. It must be focused and have well-defined targets, objectives, and outcomes.
When considering ESG aspects as part of its investment process, the manager can call upon Jupiter’s in-house stewardship and data science teams, and the SMID team’s own dedicated ESG investment director. The data science team maintains a proprietary desktop tool – the ESG hub – which allows the investment teams to apply multi-factor ESG screening to their investment universe and to build custom reports.
Utilising RIII’s closed end structure
Closed-end structure allows for more illiquid positions, but the trust does not use gearing
The team feels that the investment trust structure complements the open-ended funds that it manages. For example, RIII is better able to hold larger positions in less-liquid stocks, increasing the ability to find attractive but mispriced companies. However, the team does not feel that it is appropriate to use leverage as part of its investment approach and will not seek to add value through borrowings or the use of derivatives.
Market background
Given the UK market’s bias to large cap value stocks, it did relatively well as interest rates were rising through 2022. However, when the AI story took off, investors’ increasing fixation on US mega-cap AI plays left the UK market trailing. In early 2025, the DeepSeek shock to the AI story did trigger some investors to rotate out of the US. However, the UK market’s relative recovery has ebbed away in recent months.
Figure 1: UK market relative to the world market
Figure 2: UK SMID stocks relative to the UK market
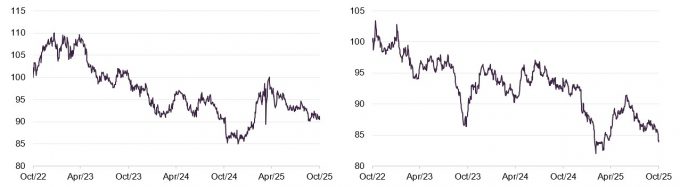
Source: Bloomberg, MSCI UK relative to MSCI All Countries World Index in sterling
Source: Bloomberg, Deutsche Numis ex Investment Companies plus AIM Index relative to MSCI UK Index
A large part of the problem has been domestic investor flows out of the UK market into global or US index-trackers. Those investor flows have weighed heavily on small- and mid-cap stocks, as Figure 2 illustrates.
The UK’s inflation outlook is less positive than when we last wrote on RIII, reaching 3.8% in September, just shy of January 2024’s figure of 4%. This is above the Bank of England’s current target of 2%, and hence it is unsurprising that interest rates remain elevated at 4%. It is possible that rates will be cut in the BoE’s November meeting. However, September’s inflation figure was lower than expected, making it more likely that the BoE might make a change early next year. It is also worth noting that since the new government has been in power, the national minimum wage and national living wage has increased considerably.
Wages have grown more than inflation, benefitting purchasing power for UK consumers; average employees’ total earnings grew by 5% from June to August. Despite this, consumer sentiment is less positive on inflation concerns and the anticipation of the government’s upcoming Autumn budget. Potentially market-boosting ideas, such as a curtailment of cash ISA allowances in favour of some requirement to favour domestic equities, are being strongly resisted by those with vested interests such as building societies and platforms (who would rather not make changes to their systems).
Relatively cheap UK stocks are attracting the attention of corporate and private equity buyers. M&A has had a big influence on returns.
It is important to remember that macroeconomic considerations are not the primary driver of portfolio construction.
Asset allocation
Figure 3: RIII style skyline analysis as at 31 August 2025
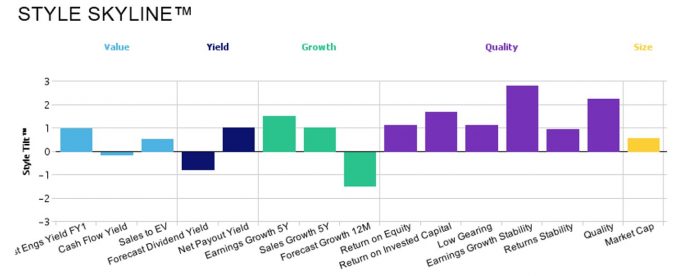
Source: Jupiter Asset Management
An analysis of the portfolio carried out by Style Analytics demonstrates that the manager has expressed a preference for quality within the portfolio. Matt says that he is keen to maintain this over the long term without sacrificing the portfolio’s bias to value (the two are not mutually exclusive).
In fact, the analysis is revealing in that it suggests that the portfolio is biased to value, growth, and quality – we think that this demonstrates just how undervalued the UK small-cap market is given that good-quality, growing companies of the sort found in RIII’s portfolio are also cheap.
The trust’s allocation to industrials remains its largest, although its exposure to financials grew with M&A activity.
As of 30 September 2025 (the last data available), the top 10 holdings accounted for 53.4% of the trust, down from 55.9% at the end of 2024.
Portfolio changes
RIII’s sector exposures have changed quite a bit since we last wrote on the trust (using data as at the end of December 2024). These changes are driven by the manager’s stock selection decisions rather than any targeting of a weighting to a particular sector.
The exposure to telecoms has fallen markedly as Gamma Communications left the portfolio (see below) and RIII now has exposures to energy and utilities that were not a feature of the portfolio at the end of 2024.
The cash weighting is a slightly higher than previously.
Figure 4: RIII sector allocation at 30 September 2025
Figure 5: RIII sector allocation at 31 December 2024
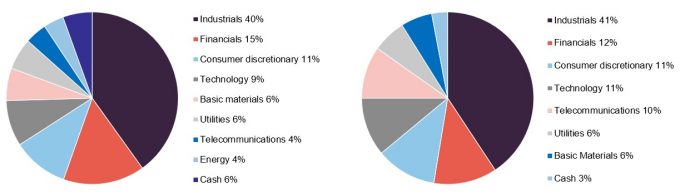
Source: Jupiter Asset Management
Source: Jupiter Asset Management
Top 10 holdings
Figure 6: 10 largest holdings at 30 September 2025
| Holding | Industry | Percentage of NAV 30/09/2025 (%) | Percentage of NAV 31/12/2024 (%) | Change (%) |
|---|---|---|---|---|
| Hill and Smith | Industrials | 6.1 | 6.0 | 0.1 |
| OSB Group | Financials | 6.1 | 4.6 | 1.5 |
| Telecom Plus | Communication services | 5.9 | 5.9 | – |
| JTC | Financials | 5.8 | 5.2 | 0.6 |
| Colefax Group | Consumer cyclical | 5.7 | 5.2 | 0.5 |
| IMI | Industrials | 5.3 | 6.0 | (0.7) |
| Eleco | Communication services | 4.7 | 5.2 | (0.5) |
| Macfarlane Group | Consumer cyclical | 4.7 | 6.2 | (1.5) |
| VP | Industrials | 4.6 | 6.2 | (1.6) |
| Jet2 | Consumer cyclical | 4.5 | 5.1 | (0.6) |
| Total | 53.4 | 55.9 |
Since we last published, OSB Group, JTC and IMI have all moved up into the top 10. Exits from the top list include Renold, Gamma Communications, formerly its second-largest holding, and Treatt.
OSB Group
Figure 7: OSB Group
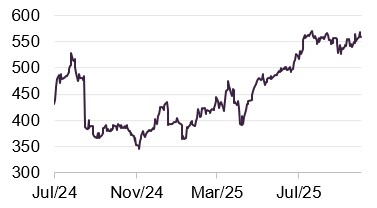
Source: Bloomberg
OSB Group (osb.co.uk) is a specialist mortgage lender, focusing on areas including buy to let, commercial and semi commercial and development finance. It operates through eight brands, including Kent Reliance and Charter Savings Bank, which OSB uses to fund a large part of its lending. The company holds £23.8bn in statutory retail deposits and diversifies its finances through MREL qualifying debt and funding schemes through the Bank of England. OSB’s wholly owned subsidiary, OSB India, also provides credit assessment and case management services.
Interest rate rises since 2021 have weighed on mortgage volumes and fuelled increased competition among specialist lenders. OSB’s share price was subject to sell-offs in 2023 and 2024 following profit warnings due to underwhelming forecasts. However, since then the company has demonstrated a relative return to form. OSB’s management cautioned in August that it will keep its current guidance but expressed that it was moving in the right direction, with its shares up 42% in a year.
The company has recently focused on its higher-yielding areas such as commercial, asset finance and development finance. A decision to prioritise returns rather than growth in in its mortgage book has been instrumental in this relative turnaround. It should also be noted that OSB has been adding to its £100m share buyback programme, due to be completed in March 2026.
IMI
Figure 8: IMI
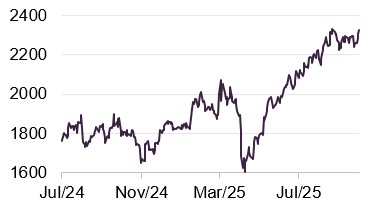
Source: Bloomberg
IMI (imiplc.com) is an engineering company that specialises in fluid and motion control, providing customised solutions for clients in sectors such as life sciences and industrial automation. It operates in over 50 countries, employs around 11,000 people and is a constituent of the FTSE 100.
In its recent half-year results, IMI reconfirmed its guidance, demonstrating strong momentum in revenues and dividend growth. Particularly positive performance was seen in the area of process automation, which saw its order book rise by 5% and its aftermarket organic order intake rise by 10%. For context, aftermarket sales are a core revenue stream for the company and, as of the end of last year, represented around 45% of overall sales.
At the end of 2024, IMI’s process automation arm was bolstered with the €25m acquisition of Netherlands based TWTG. TWTG provides hardware and software to help industries in sectors like energy and petrochemicals monitor assets for safety, efficiency, and predictive maintenance through real-time data and analytics. IMI’s management believes that there are multiple synergies between the companies as well as potential benefits for its aftermarket growth.
For RIII, IMI provides diversified growth across a range of sectors, in addition to stable dividend growth, indicated by an interim dividend increase of 10%. As discussed, its aftermarket sales demonstrate a reliable runway, backed up by the company’s 11% CAGR in the last six years. The company has also completed a £200m share buyback programme.
JTC
Figure 9: JTC
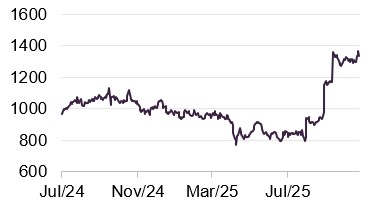
Source: Bloomberg
JTC (jtcgroup.com) is a financial services company that provides operational and strategic assistance, including wealth management and fund administration to industries such as private equity and venture capital. The company has over $160bn of fund assets under administration, 16 funds under depositary and $67bn depositary assets. The company has experienced significant growth in the US, with revenues in 2024 rising by 49%, as the country now accounts for over 30% of JTC’s sales. During the first half of 2025, JTC’s revenues were up 17.3% from the first half of last year.
In July, shares hit an all-time high following the rejection of a non-binding cash offer from private equity firm Permira. A share price rise of 17% was partly driven by a reaction to Permira’s valuation of JTC at £2bn. Since then, continued interest from Permira and another PE firm Warburg Pincus has seen JTC’s share price remain elevated, increasing over 51% in the last three months. As of 12 September, JTC has received four offers from Permira, with a decision required by 24 October.
JTC has segmented its strategy into multiple “eras”, which are essentially multiyear business plans. From January 2024, JTC has been in its “Cosmos” era, which is scheduled to run until 2027. The core focus of this period is to double the size of company, which would be the third time since JTC went public in 2018. Management believes this can be realised on the back of its strong organic performance, but also by exploiting increasing M&A opportunities
Other holdings
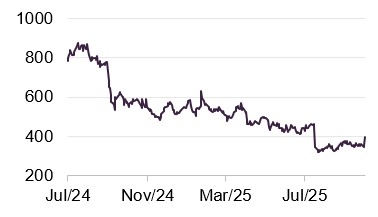
Gamma Communications
Figure 10: Gamma Communications
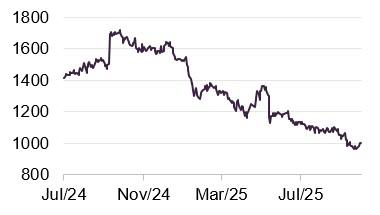
Source: Bloomberg
Gamma Communications (gammagroup.co) is a telecommunications company that focuses on unified communications as a service (UCaaS). This involves operating different communication pathways such as voice technology and messaging through one standalone platform. When we last published, Gamma was RIII’s second largest holding, yet it no longer features in its top 10. Since then, the company has consistently de-rated, with its share price down 40% this year. It may be that investors may have reacted less positively than expected to Gamma’s move from the AIM to listing on the main market.
Despite its woes in the UK, Matt highlights its better performance in Germany, where it recently acquired STARFACE from an all-cash offer of £165m. Gamma’s German business represents about 20% of the wider company’s profits. Matt views STARFACE as a major player in the German telecommunications market and a challenger to the two largest incumbents, Deutsche Telekom and Vodaphone.
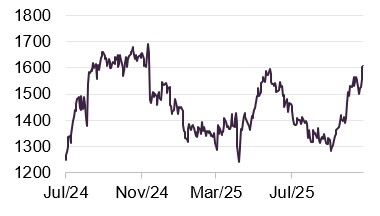
Ashtead Technology
Figure 11: Ashtead Technology
Source: Bloomberg
Ashtead Technology (ashtead-technology.com)) is a specialist subsea equipment rental and services provider for the offshore energy sector. It has over 650 employees and operates globally from 13 offshore facilities. It has three core service lines: survey and robotics, mechanical solutions, and asset integrity. The company provides custom solutions and assists in the installation, maintenance, repair and decommissioning of equipment.
Matt highlights that since Ashtead’s IPO in late 2021, the company has shown strong early growth. The company plans to move from AIM to the main market, partly to avoid pressure from the effect of IHT increases on 18% of its capital. With the announcement of its intention to move to the main market on 26 August, Ashtead’s shares jumped 12.8%. Additionally, in the same update, management indicated positive revenue growth, citing the particularly strong performance in both oil, gas and renewable markets.
The integration of Seatronics and J2 Subsea, completed in November 2024, has been another positive step, expanding the group’s survey and robotics rental assets by around 30%. Matt also sees scope for further bolt-on acquisitions.
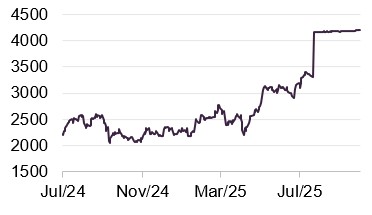
Keller Group
Figure 12: Keller Group
Source: Bloomberg
Keller Group (www.keller.com) describes itself as a leading specialist geotechnical contractor. It provides ground engineering solutions that make construction possible on challenging sites. Operating in more than 40 countries, it uses techniques such as piling, grouting, and ground improvement to stabilise soil and manage ground risk, helping clients build safer, more resilient foundations. Its work spans small local projects through to major infrastructure developments, including bridges, railways, ports, and wind farms. Keller also focuses on reducing the carbon footprint, cost, and material intensity of its projects. The group operates across five continents and is a constituent of the FTSE 250..
A long-established business, Keller has seen periods of share price volatility over its history. Under former CEO Mike Speakman, operational improvements helped drive consistent earnings upgrades over a five-year period. However, following his departure, the company faced market downgrades, reflecting both cyclical elements and the leadership transition. In the UK, Keller trading conditions have been more challenging, however, although management notes that this market accounts for only 2-3% of group revenues.
As of early August, Keller had completed a £25m tranche of its multiyear share buyback programme, with a further £25m expected by year end. Its near debt-free balance sheet supports strong cash generation of around £100m annually. Matt notes that at current valuation levels, buybacks are highly accretive and could deliver meaningful EPS growth even if profits remain flat. He and the team view Keller as a strong fit for RIII’s long-term value-driven investment approach.
Alpha Group International
Figure 13: Alpha Group International
Source: Bloomberg
Alpha Group International (alphagroup.com) is a financial services company that offers foreign exchange risk management services for its corporate clients, which are mainly investment managers. It describes itself as “half fintech, half consultancy”, operates in over 50 markets and is a constituent of the FTSE 250 Index.
The company agreed to an all-cash acquisition by Corpay for £1.8bn in July, with the announcement of the sale leading to a 25.6% jump in its share price. Alpha’s key position among alternative accounts providers for investment managers was a major attraction for Corpay, along with the company’s FX segments, which have benefited from geopolitically-linked currency volatility.
Performance
Figure 14: RIII NAV total return performance versus HSBC FTSE All-Share and Deutsche Numis ex Investment Companies plus AIM over five years ending 31 October 2025
Source: Bloomberg, Marten & Co. NB, As before, we have substituted the HSBC FTSE All-Share Fund Class C for the trust’s benchmark
As Figure 14 shows, the last 12 months has been mixed for RIII’s performance. Pressure on the company’s share price in the first six months can be partly attributed to the rise in bond yields. Higher inflation and increased government spending led to higher gilts, which had a profound effect on growth-orientated UK small caps. As mentioned previously, from January, RIII’s share price started a gradual decline until April. This coincided with a 10-year bond yield of 4.84% on 6 January, which remained elevated for much of the year. Despite this, RII’s share price has risen 20% from its low point in April (around the time of Trump’s tariff announcements).
Figure 15: Total return cumulative performance over various time periods to 31 October 2025
| 3 months(%) | 6 months(%) | 1 year(%) | 3 years(%) | 5 years(%) | |
|---|---|---|---|---|---|
| RIII share price | (4.5) | 14.1 | (11.2) | 18.8 | 26.8 |
| RIII NAV | (1.8) | 11.8 | 2.1 | 19.9 | 47.7 |
| Deutsche Numis ex IC plus AIM | 2.5 | 14.5 | 11.0 | 25.7 | 34.3 |
| HSBC FTSE All-Share | 6.3 | 16.3 | 22.6 | 50.4 | 97.2 |
| Peer group1 median NAV | 0.0 | 11.7 | 4.4 | 28.5 | 45.0 |
Peer group
We have put together a peer group for RIII that is drawn from the AIC’s UK smaller companies sector but excludes companies with very small market caps, Marwyn (which has an unusual investment approach), and the split capital trust, Aberforth Geared Value & Income.
Figure 16: Peer group snapshot as at 3 November 2025
| Premium/(discount) (%) | Dividend yield (%) | Ongoing charges ratio (%) | Market cap (£m) | |
|---|---|---|---|---|
| Rights and Issues | (17.3) | 2.0 | 0.90 | 102 |
| Aberforth UK Smaller Companies | (11.1) | 2.8 | 0.78 | 1,240 |
| Abrdn UK Smaller Companies Growth | (8.8) | 2.6 | 0.85 | 286 |
| Artemis Future Leaders | (12.2) | 3.9 | 1.03 | 116 |
| BlackRock Smaller Companies | (12.8) | 3.3 | 0.80 | 535 |
| BlackRock Throgmorton | (10.0) | 3.0 | 0.56 | 458 |
| Crystal Amber | (17.1) | 7.4 | 1.26 | 94 |
| Henderson Smaller Companies | (11.2) | 3.3 | 0.45 | 519 |
| JPMorgan UK Small Cap Growth & Inc | (10.2) | 4.7 | 0.76 | 406 |
| Montanaro UK Smaller Companies | (8.4) | 6.6 | 0.91 | 126 |
| Odyssean | (2.2) | 0.0 | 1.47 | 225 |
| Oryx International Growth | (30.7) | 0.0 | – | 183 |
| River UK Micro Cap | (18.3) | 0.0 | 1.72 | 69 |
| Rockwood Strategic | 2.2 | 0.0 | 1.83 | 142 |
| Strategic Equity Capital | (9.1) | 1.1 | 1.26 | 167 |
| Peer group median | (11.1) | 2.8 | 0.9 | 183 |
| RIII rank | 13/15 | 10/15 | 7/15 | 13/15 |
There are smaller UK trusts than RIII, including some that we left out of the peer group, but RIII is on the small side within the sector. The discount is extremely wide – only Oryx, which is effectively controlled by its manager and is therefore “bid-proof” trades on a wider discount. RIII’s discount control issues are discussed below.
The wide discount boosts the dividend yield, but this is not particularly high. The company’s expenses are competitive, especially given RIII’s size.
Figure 17: Peer group NAV total return performance over periods to end October 2025
| 3 months(%) | 6 months(%) | 1 year(%) | 3 years(%) | 5 years (%) | |
|---|---|---|---|---|---|
| Rights and Issues | (1.8) | 11.8 | 2.1 | 19.9 | 47.7 |
| Aberforth UK Smaller Companies | (1.9) | 14.6 | 8.8 | 41.6 | 102.0 |
| Abrdn UK Smaller Companies Growth | (1.6) | 8.3 | 3.9 | 27.0 | 6.9 |
| Artemis Future LKeaders | (1.6) | 8.1 | (7.1) | 3.0 | 9.8 |
| BlackRock Throgmorton | 2.3 | 11.7 | 3.6 | 30.0 | 21.7 |
| Crystal Amber | 0.0 | 0.0 | 69.2 | 85.6 | 175.5 |
| Henderson Smaller Companies | 1.6 | 13.5 | 4.9 | 24.8 | 22.5 |
| JPMorgan UK Small Cap Growth & Inc | 0.1 | 9.0 | 9.2 | 37.7 | 42.4 |
| Montanaro UK Smaller Companies | (0.8) | 4.9 | (0.4) | 18.6 | 6.2 |
| Odyssean | 3.4 | 28.4 | 8.4 | 13.1 | 58.7 |
| Oryx International Growth | 0.9 | 17.5 | 8.6 | 37.5 | 48.0 |
| River UK Microcap | 5.3 | 25.3 | 21.6 | 43.6 | 69.4 |
| Rockwood Strategic | 2.3 | 11.7 | 3.6 | 30.0 | 21.7 |
| Strategic Equity Capital | (1.8) | 11.8 | 2.1 | 19.9 | 47.7 |
| Peer group median | 0.0 | 11.7 | 4.4 | 28.5 | 45.0 |
| RIII rank | 12/15 | 6/15 | 11/15 | 10/15 | 6/15 |
Within the peer group, RIII’s NAV returns are second or third quartile within the peer group over most time periods.
Dividend – biannual payments
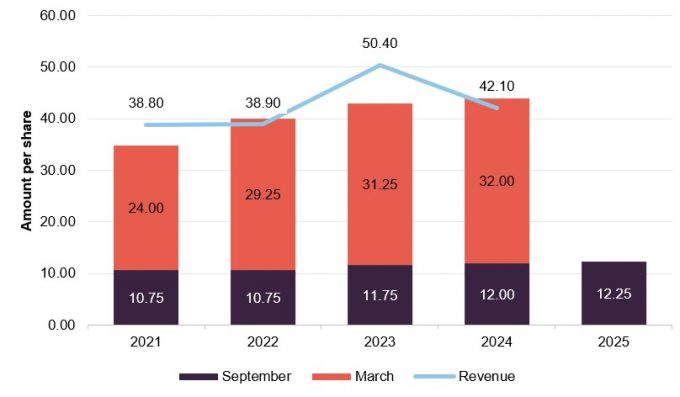
RIII’s accounting year ends on 31 December. It pays an interim dividend in September and final dividend in March. The board continues to operate a progressive dividend policy. RIII’s interim payment for the 2025 financial year was 12.25p per share, up from 12.00p per share for the prior year.
As was the case last year, the board has demonstrated that it is prepared to dip into RIII’s revenue reserves to maintain its progressive dividend policy where necessary. At the end of 2024, RIII’s revenue reserve per share stood at 0.55p.
Figure 18: RIII five-year dividend history
Source: Rights and Issues Investment Trust
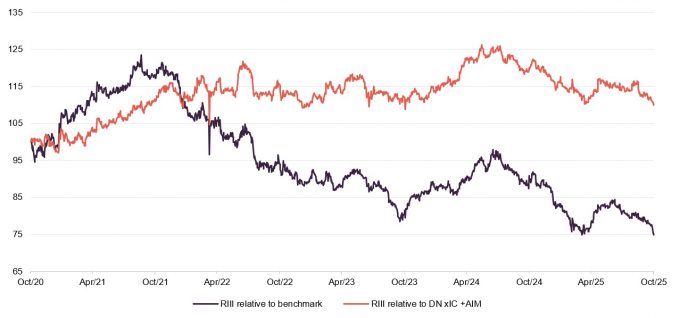
Premium/(discount)
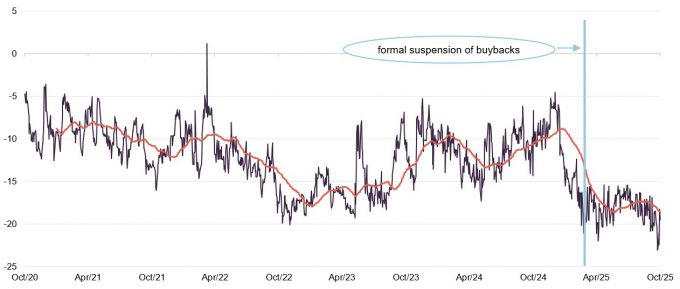
Figure 19: RIII premium/discount over five years to 31 October 2025
Source: Bloomberg
Over the past 12 months, RIII’s shares have traded on an average discount of 15.6%, reaching a high of 23.1% and low of 4.5%. As of publishing, the discount stood at 17.3%.
Share buy backs blocked
In March, the company announced that it had suspended its share buyback programme, following opposition from a major shareholder. A resolution to approve buybacks was withdrawn from the agenda of the AGM. At the time, the board said it “believes that the share buyback authority is fundamental to the company’s discount management policy and notes that the approval of the resolution was recommended by shareholder voting guidance agencies. The board therefore proposes to consult with shareholders to address any concerns that have influenced their voting. Following these consultations, a general meeting will be convened to seek shareholder approval of a new share buyback authority”. No such meeting has been convened.
Share split abandoned
We also note that proposals to split the shares – to improve liquidity and make it easier for small investors to buy shares as part of a savings plan or reinvest dividends – were also rejected by some shareholders and abandoned. This is a shame as another issue, related to RIII’s size and lack of liquidity, is a wide bid-ask spread.
Vulnerable to a bid?
With a potentially improving inflation outlook and the compelling valuation opportunity of UK small caps, we believe the discount presents an attractive entry point for investors. However, we would also note that the company’s small size and wide discount makes it vulnerable to a bid approach.
Fees and costs
RIII’s fees remain highly competitive
Given the higher management fee, we would expect RIII’s ongoing charges ratio to be higher again in 2026. However, Jupiter will apply a 0.8% cap on all operating expenses, which should help to keep RIII amongst the most competitive in its peer group.
The only other expenses of note for the year ended 31 December 2024 were the non-executive directors’ fees which were increased following a remuneration committee review. From 1 January 2025, fees were increased for the chair of the Audit, Risk and Compliance Committee by £1,635, for the chairman by £1,900 and by £1,425 for each of the other non-executive directors.
Capital structure and life
As at 3 November 2025, RIII has 4,780,643 shares in issue. Following the withdrawal of Resolution 10 in March 2025, RIII’s share buyback programme was suspended.
RIII’s year end is 31 December and its AGMs are typically held in March.
During 2024, the board considered a potential share split, but after consultation with shareholders, decided that the potential costs would outweigh any benefits for shareholders or the trust’s liquidity.
Major shareholders
Figure 20: RIII shareholders as at 24 October 2025
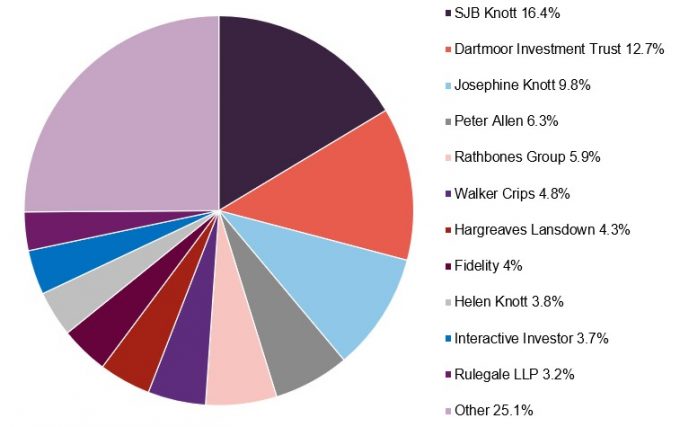
Source: Bloomberg
Gearing
The company has not historically used any form of gearing, nor does the Jupiter team intend to in the future. The manager highlights the already-high level of volatility associated with SMID investing compared to other strategies.
Board
RIII has four directors, all of whom are non-executive and need to be re-elected at each AGM. Three are considered to be independent, with Simon Knott not deemed independent by virtue of his previous position as investment director. All other directors have had no material connection other than as directors of the company. The board delegates all investment matters to the investment manager but retains all decisions concerning unquoted investments. Previous chairman David Best retired from his role on 31st August 2023 and was replaced on the board by Dr Andrew Hosty on the same day.
One observation that we would make is that only two of the four directors have made an investment in the company. We would like to see a greater alignment of interest between the board and shareholders.
Figure 21: Directors’ length of service, fees and shareholding
| Role | Appointed | Length of service (years) | Fees | Shareholding | |
|---|---|---|---|---|---|
| Dr Andrew Hosty | Chairman | 01/07/2017 | 8.2 | 39,900 | 498 |
| Helen Vaughan | Chair of the audit, risk and compliance committee | 01/01/2023 | 2.8 | 34,385 | – |
| Jonathan Roper | Chairman of nomination sand remuneration committee | 05/04/2016 | 9.5 | 29,925 | – |
| Simon Knott | Director | 03/10/2022 | 3.0 | 29,925 | 785,062 |
Helen Vaughan (chair of the audit, risk and compliance committee)
Helen is a Chartered Accountant and a certified independent fund director. She has over 30 years of investment management experience. As the chief operating officer for the J O Hambro Capital Management Group, Helen oversaw the transformation of its operating model to one which supported rapid growth and also significantly reduced operational risk to the business. She retired from this company in September 2019. Prior to this, Helen was director of business development at Credit Suisse Asset Management, and before that, head of investment operations at SLC Asset Management and head of client accounting at Framlington Group Limited.
Jonathan Roper (chairman of the nomination and remuneration committee)
Jonathan is a solicitor and, until his retirement from practice, was a partner in Eversheds Sutherland (formerly Eversheds LLP). He has more than 35 years’ experience of commercial practice in the City, advising primarily on public and private company mergers and acquisitions, joint ventures and equity and other financing arrangements for UK and overseas clients, including many in the financial services sector, and often at a strategic board level. Until recently, Jonathan was a member of the Council of the London School of Hygiene & Tropical Medicine and chair of its Audit & Risk Committee.
Dr Andrew Hosty (chairman)
Andrew is a Chartered Engineer and Fellow of the Royal Academy of Engineers. He is an international business leader with over 20 years of non-executive board experience and 30 years of executive and management experience, spanning private equity, UK Plc and global blue-chip corporates. From 2016 to 2018 Andrew was the CEO of the Sir Henry Royce Institute, the UK’s national institute for advanced materials research and innovation. Andrew was chief operating officer of Morgan Advanced Materials and served on the Plc board as an executive director from 2010 to 2016. These experiences and his current work with other operating companies mean that he can contribute to a range of business matters over a wide spectrum of end markets.
Simon Knott (director)
Simon served as investment director of the company from 1983, focusing on UK smaller companies. Following the appointment of Jupiter as investment manager on 3 October 2022, Simon retired as investment director but remains a non-executive director of the company.
SWOT and bull vs. bear analysis
| Strengths | Weaknesses |
|---|---|
| Long-term (five-year) outperformance of small-cap index | Relatively small size |
| Progressive dividend history | Wide discount |
| Relatively low running costs | Low free float and a wide bid/ask spread |
| Opportunities | Threats |
| UK small cap is cheap relative to large cap and to international peers, should re-rate at some point | Large shareholder continues to block board’s shareholder-friendly agenda |
| Potential for discount closing at some point |
| Bull | Bear | |
|---|---|---|
| Performance | Long-term track record of solid returns | Discount widening is impacting on returns to shareholders |
| Outlook | Market-friendly measures in budget could be a catalyst for a re-rating of UK small caps, any re-rating could feed on itself in an upward spiral | Budget unknowns still weigh on sentiment towards the UK and international investors will be watching government finances |
| Discount | Looks excessively wide, represents significant potential upside if a solution can be found | Large shareholder seems determined to frustrate board’s shareholder-friendly ideas |
Previous publications
Readers interested in further information about RIII may wish to read our previous notes (details are provided in Figure 24 below). You can read the notes by clicking on them in Figure 24 or by visiting our website.
| Title | Note type | Publication date |
|---|---|---|
| Under new management, same high conviction approach | Initiation | 18 April 2023 |
| Old dog, new tricks | Update | 19 December 2023 |
| Lights and tunnels | Annual overview | 20 August 2024 |
| Normal programming to resume | Update | 4 February 2025 |
IMPORTANT INFORMATION
This marketing communication has been prepared for Rights and Issues Investment Trust Plc by Marten & Co (which is authorised and regulated by the Financial Conduct Authority) and is non-independent research as defined under Article 36 of the Commission Delegated Regulation (EU) 2017/565 of 25 April 2016 supplementing the Markets in Financial Instruments Directive (MIFID). It is intended for use by investment professionals as defined in article 19 (5) of the Financial Services Act 2000 (Financial Promotion) Order 2005. Marten & Co is not authorised to give advice to retail clients and, if you are not a professional investor, or in any other way are prohibited or restricted from receiving this information, you should disregard it. The note does not have regard to the specific investment objectives, financial situation and needs of any specific person who may receive it.
The note has not been prepared in accordance with legal requirements designed to promote the independence of investment research and as such is considered to be a marketing communication. The analysts who prepared this note are not constrained from dealing ahead of it, but in practice, and in accordance with our internal code of good conduct, will refrain from doing so for the period from which they first obtained the information necessary to prepare the note until one month after the note’s publication. Nevertheless, they may have an interest in any of the securities mentioned within this note.
This note has been compiled from publicly available information. This note is not directed at any person in any jurisdiction where (by reason of that person’s nationality, residence or otherwise) the publication or availability of this note is prohibited.
Accuracy of Content: Whilst Marten & Co uses reasonable efforts to obtain information from sources which we believe to be reliable and to ensure that the information in this note is up to date and accurate, we make no representation or warranty that the information contained in this note is accurate, reliable or complete. The information contained in this note is provided by Marten & Co for personal use and information purposes generally. You are solely liable for any use you may make of this information. The information is inherently subject to change without notice and may become outdated. You, therefore, should verify any information obtained from this note before you use it.
No Advice: Nothing contained in this note constitutes or should be construed to constitute investment, legal, tax or other advice.
No Representation or Warranty: No representation, warranty or guarantee of any kind, express or implied is given by Marten & Co in respect of any information contained on this note.
Exclusion of Liability: To the fullest extent allowed by law, Marten & Co shall not be liable for any direct or indirect losses, damages, costs or expenses incurred or suffered by you arising out or in connection with the access to, use of or reliance on any information contained on this note. In no circumstance shall Marten & Co and its employees have any liability for consequential or special damages.
Governing Law and Jurisdiction: These terms and conditions and all matters connected with them, are governed by the laws of England and Wales and shall be subject to the exclusive jurisdiction of the English courts. If you access this note from outside the UK, you are responsible for ensuring compliance with any local laws relating to access.
No information contained in this note shall form the basis of, or be relied upon in connection with, any offer or commitment whatsoever in any jurisdiction.
Investment Performance Information: Please remember that past performance is not necessarily a guide to the future and that the value of shares and the income from them can go down as well as up. Exchange rates may also cause the value of underlying overseas investments to go down as well as up. Marten & Co may write on companies that use gearing in a number of forms that can increase volatility and, in some cases, to a complete loss of an investment.