April
Monthly | Investment companies
Winners and losers in March 2025
The dominant performance by the Property – UK Healthcare sector was driven by a bid for Care REIT. Primary Health Properties (PHP) and Assura are not structured as investment companies but news that PHP was proposing a merger with Assura and now KKR’s recommended bid for Assura, are also supporting investor interest in the sector. Appearing on the best performing table for the third month running, the Property – UK Logistics sector was boosted by Blackstone’s bid for Warehouse REIT and Urban Logistics facing a requisition request from Achilles Investment Company.
Best performing sectors in March 2025 by total price return
| Median share price total return (%) |
Median NAV total return (%) |
Median discount 31/03/25 (%) |
Median sector market cap 31/03/25 (£m) | Number of companies in the sector | |
|---|---|---|---|---|---|
| Property – UK Healthcare | 22.5 | 0.2 | (17.1) | 509.5 | 2 |
| Property – UK Logistics | 12.5 | 0.6 | (18.3) | 604.6 | 3 |
| India/Indian Subcontinent | 7.3 | 5.6 | (11.9) | 406.6 | 4 |
| Infrastructure Securities | 3.2 | 4.6 | (14.4) | 110.4 | 2 |
| Debt – Structured Finance | 2.8 | (0.5) | (1.1) | 164.4 | 5 |
In a reversal of February’s all time market downturns, India’s Nifty 50 benchmark leapt by 6%, its highest monthly rise in fifteen months. This was encouraged by surprisingly positive expectations for the outcomes of upcoming tariffs, due to a February agreement with the US to resolve trade issues later in the year. Eventually, when Trump’s ‘Liberation Day’ came on 2 April, India decided not to impose retaliatory tariffs, as government officials were still expecting the country to meet its 6.3%–6.8% annual growth forecast. After five months of consecutive decline, valuations attracted foreign inflows, and returns were supported by the strengthening of the rupee against the dollar.
Returns in infrastructure securities were uplifted by Premier Miton Global Renewables’s plan to consider a wind up of the trust after another year of poor returns. It should also be said that investors have been expecting a rate cut from the Bank of England to soften the blow of US tariffs, which would be particularly beneficial to infrastructure investments. The same expectations may have strengthened sentiment for Debt – Structured Finance trusts. However, since the end of the month concern has been building about debt defaults which could impact instruments like collateralised loan obligations and fixed rate asset backed securities.
Worst performing sectors in March 2025 by total price return
| Median share price total return (%) |
Median NAV total return (%) |
Median discount 31/03/25 (%) |
Median sector market cap 31/03/25 (£m) | Number of companies in the sector | |
|---|---|---|---|---|---|
| Technology & Technology Innovation | (13.3) | (13.7) | (11.4) | 2,345.2 | 2 |
| North American Smaller Companies | (9.6) | (9.5) | (9.0) | 192.8 | 2 |
| Biotechnology & Healthcare | (9.0) | (9.8) | (10.0) | 302.5 | 6 |
| Environmental | (8.7) | (8.7) | (10.8) | 771.2 | 3 |
| Global Smaller Companies | (8.5 | (7.5) | (11.4) | 718.2 | 5 |
Technology funds were hit by the largest monthly decline for ‘Magnificent 7’ stocks on record. Since the emergence of DeepSeek in January, these tech giants have suffered major losses, with Tesla and Nvidia shares falling 35% and 20% respectively over Q1. More recently, the lack of confidence in these stocks may have less to do with foreign AI competition but rather, changing sentiment towards US equities. The S&P500 and Nasdaq Composite indices, led by large cap tech stocks, had their biggest monthly losses since December 2022. The uncertainty surrounding the Trump administration’s approach to tariffs and defence saw investors flocking to other markets, particularly Europe. North American smaller companies were especially vulnerable to these downturns, as they tend to lack diversified supply chains and foreign assets. The Russell 2000 index, a benchmark for US small cap stocks, has suffered a 20% fall from its post-election peak. These headwinds affected smaller companies on a global scale, as even some IPOs of companies like Klarna and StubHub were pushed back.
Biotechnology and healthcare trusts have been impacted by the Robert F Kennedy-led reshaping of the FDA (the US’s food and health department), which most recently involved the forced resignation of Peter Marks, the department’s chief vaccine official. Vaccine development companies like Novavax and BioNTech saw their share prices slide between 6%–8% after the announcement.
Developments that have affected environmental stocks include the US Securities and Exchange Commission’s plans to cease its legal defence of regulation that obliges companies to disclose greenhouse gas emissions and risks to the climate. This has come with a slowing support for ESG initiatives in the US, signified by the recent withdrawal of major banking groups Citigroup and Morgan Stanley among others, from the UN backed net zero banking alliance. Impax Environmental Markets’ announcement of its annual results reflected the struggles of the sector.
Best performing investment companies
No stranger to the best performing table in times of political uncertainty, Golden Prospect Precious Metals’ NAV was driven by a record price for gold, which surpassed $3,000 per ounce on 14 March. Anticipation of major tariffs was the principal reason for the price hike, which eventually reached a new all-time high once the Trump administration laid out its plans on 2 April.
Seraphim Space’s NAV rise was prompted by the increase in value for portfolio companies ICEYE and Skylo after new funding rounds, with the latter raising $158m. Sentiment for space investment has improved, with Skylo recently partnering with the US telecom firm Verizon to initiate satellite enabled mobile messaging in the US.
As discussed, India’s markets experienced a rebound after previous poor monthly performances. Financials accounted for two thirds of all March’s foreign inflows, amounting to $2.06bn. Equities such as ICICI Bank and HDFC Bank showed positive share price movements, both of which are holdings of abrdn New India, Ashoka India Equity and JPMorgan Indian.
Marwyn Value Investors’ NAV will have been uplifted following holding InvestAcc Group’s agreement to purchase of AJ Bell’s SIPP and SSAS businesses for around £25m.
BBGI Global Infrastructure announced a positive set of results for 2024 ahead of its takeover by Canadian investors.
Best performing trusts in total NAV (LHS) and share price (RHS) terms over March 2025
| Fund | Sector | (%) | Fund | Sector | (%) |
|---|---|---|---|---|---|
| Golden Prospect Precious Metal | Commodities & Natural Resources | 16.9 | DP Aircraft I | Leasing | 78.9 |
| Seraphim Space Investment Trust | Growth Capital | 7.5 | Care REIT | Property – UK Healthcare | 38.4 |
| Premier Miton Glb Renewables Trust | Infrastructure Securities | 7.0 | Harmony Energy Income Trust | Renewable Energy Infrastructure | 35.1 |
| abrdn New India Investment Trust | India/Indian Subcontinent | 6.9 | Life Science REIT | Property – UK Commercial | 33.9 |
| Ashoka India Equity Investment | India/Indian Subcontinent | 5.7 | Gresham House Energy Storage | Renewable Energy Infrastructure | 33.3 |
| JPMorgan Indian | India/Indian Subcontinent | 5.4 | Warehouse REIT | Property – UK Logistics | 31.6 |
| BlackRock Latin American | Latin America | 4.1 | Schroders Capital Global Innov Trust | Growth Capital | 26.1 |
| India Capital Growth | India/Indian Subcontinent | 4.0 | Golden Prospect Precious Metal | Commodities & Natural Resources | 22.0 |
| Marwyn Value Investors | UK Smaller Companies | 3.3 | Gore Street Energy Storage Fund | Renewable Energy Infrastructure | 21.1 |
| BBGI Global Infrastructure | Infrastructure | 3.0 | LMS Capital | Private Equity | 14.9 |
Price growth for DP Aircraft I was induced by 12-year leasing agreements with LOT Polish Airlines for two Boeing aircraft, which are expected to generate over $168m in rental payments over their lease period.
The agreed sale of Care REIT to US listed home provider CareTrust for £448m was the catalyst for the trust’s share price jump, with the recommended cash offer for the company distributing 108p per share, which represents a 36% premium to the one-month volume weighted average price of 79.4p. Similarly, Harmony Energy Income was spurred by the acceptance of a cash offer of £199.9m from Drax Bidco, representing 35% to HEIT’s share price of 65.2p on 14 March. Also in the renewable energy infrastructure sector, the interest in Gore Street Energy Storage Fund may have emerged from the successful energisation of its remaining in-construction assets, Dogfish and Enderby.
Another share price elevated by a cash offer was that of Warehouse REIT (WHR), with the offer from Blackstone and Sixth Street Partners, an improved version of which was eventually accepted by WHR.
Investors will have looked to take advantage of the potential sale or managed wind down of Life Science REIT, due to the trust announcing that it would put itself up for sale after the conclusion of its strategic review. In Schroders Capital Global Innovation’s case, its wind down has begun.
LMS Capital’s announcement of its managed realisation was met with a positive investor response, seeing its share price surge by 16%. The company’s decision was due to its decline in NAV and losses across several legacy assets.
Worst performing investment companies
Geiger Counter’s falls in NAV are down to the downturn of uranium spot prices, which in March fell to their lowest level in eighteen months. Despite the declarations from the US presidency to ‘unleash’ nuclear capabilities, geopolitical uncertainty and tariff threats have affected uranium prices.
As discussed, biotechnology and healthcare trusts have suffered from the sector’s significant headwinds. Both International Biotechnology and Biotech Growth have holdings in Sarepta Therapeutics, which had a nosedive in its share price following the death of a patient treated with its Elevidys drug. Biotech Growth may have been especially affected, as 5% of its portfolio is comprised of Sarepta stock. Small cap biotech has been particularly weak. The Russell 2000 Biotechnology Index dropped approximately 6.8% over the month.
Polar Capital Technology (PCT) and Allianz Technology Trust (ATT) were rocked by the investor flight from US large cap stocks, which as discussed is led by the ‘Magnificent 7’. Allianz Technology Trust has a nearly 10% allocation to Apple, which had a 7.5% price fall over the month. Both PCT and ATT were exposed to Nvidia’s woes but Manchester & London, a global sector trust with a focus on AI, will have been hit the hardest by its substantial 37.6% weighting towards the stock at the start of the month. However, it also had some short positions that likely offset this. Baillie Gifford US Growth, Scottish Mortgage and Martin Currie Global Portfolio also have exposure to Nvidia, and also to Amazon and Meta Platforms, which had price drops of 10.8% and 12% respectfully.
Worst performing trusts in total NAV (LHS) and share price (RHS) terms over March 2025
| Fund | Sector | (%) | Fund | Sector | (%) |
|---|---|---|---|---|---|
| Geiger Counter | Commodities & Natural Resources | (18.5) | Schiehallion Fund | Growth Capital | (24.3) |
| International Biotechnology | Biotechnology & Healthcare | (14.7) | US Solar Fund | Renewable Energy Infrastructure | (17.7) |
| Polar Capital Technology | Technology & Technology Innovation | (13.8) | Manchester & London | Global | (15.9) |
| Allianz Technology Trust | Technology & Technology Innovation | (13.5) | abrdn Property Income Trust | Property – UK Commercial | (15.3) |
| Biotech Growth | Biotechnology & Healthcare | (11.2) | Geiger Counter | Commodities & Natural Resources | (14.9) |
| Scottish Mortgage | Global | (10.4) | Polar Capital Technology | Technology & Technology Innovation | (14.2) |
| BlackRock Greater Europe | Europe | (10.4) | Life Settlement Assets A | Insurance & Reinsurance Strategies | (13.0) |
| Baillie Gifford US Growth | North America | (10.4) | RTW Biotech Opportunities | Biotechnology & Healthcare | (12.6) |
| Bellevue Healthcare | Biotechnology & Healthcare | (10.3) | Allianz Technology Trust | Technology & Technology Innovation | (12.5) |
| Martin Currie Global Portfolio | Global | (9.9) | Ecofin US Renewables Infrastructure | Renewable Energy Infrastructure | (12.2) |
Whilst Schiehallion Fund’s unquoted portfolio meant that its NAV was partly shielded from the downturn of US equities, it still topped the table of the largest share price falls. One holding is Northvolt (the Swedish electric vehicle battery maker) which has struggled against Chinese competition and filed for bankruptcy during March.
So far this year, US solar assets have faced uncertainty due to the White House’s approach to renewable energy. This has affected US Solar Fund’s share price, with negative sentiment being exacerbated by events like the recent bankruptcy of the large US solar firm, SunPower. Since the month end, US Solar has confirmed a big fall in its NAV.
Both abrdn Property Income Trust’s and Ecofin US Renewables Infrastructure’s (RNEW) price falls may have been a reaction to the progress of their managed wind downs. In RNEW’s case, its distributed generation portfolio was sold on 10 March for a 26% discount to 30 June valuation of $51.9m, to the dismay of investors.
Moves in discounts and premiums
More expensive (LHS) and cheaper (RHS) relative to NAV over March 2025
| Fund | Sector | Disc/ Prem 28/02/25 (%) |
Disc/ Prem 31/03/25 (%) |
Fund | Sector | Disc/ Prem 28/02/25 (%) |
Disc/ Prem 31/03/25 (%) |
|---|---|---|---|---|---|---|---|
| DP Aircraft I | Leasing | (68.0) | (41.3) | JPMorgan Emerg E, ME & Africa Sec | Global Emerging Markets | 362.9 | 327.2 |
| Harmony Energy Income Trust | Renewable Energy Infrastructure | (29.3) | (4.5) | Schiehallion Fund | Growth Capital | (10.8) | (29.9) |
| Care REIT | Property – UK Healthcare | (33.4) | (12.0) | abrdn Property Income Trust | Property – UK Commercial | (42.1) | (53.0) |
| Warehouse REIT | Property – UK Logistics | (35.8) | (16.1) | Manchester & London | Global | (15.4) | (25.2) |
| Life Science REIT | Property – UK Commercial | (56.6) | (41.2) | Downing Renewables & Infrastructure | Renewable Energy Infrastructure | (25.3) | (34.0) |
Apart from DP Aircraft I’s agreement to lease assets to LOT Polish Airlines, all other discounts that have narrowed in the table were due to either cash offers being received or accepted by trusts.
This is not the first time that JPMorgan Emerging has jumped from one end of the table to another, as the fund’s Russian assets are continually difficult to value amid geopolitical uncertainty. All other trusts aside from Downing Renewables and Infrastructure have already been discussed. Downing’s discount was widened on reactions to future power prices being forecast to return to normalised levels more rapidly than anticipated at the start of the year.
Money raised and returned
Money raised (LHS) and returned (RHS) over March 2025 in £m
| Fund | Sector | £m raised | Fund | Sector | £m returned |
|---|---|---|---|---|---|
| M&G Credit Income Investment | Debt – Loans & Bonds | 6.6 | Scottish Mortgage | Global | (121.8) |
| CVC Income & Growth GBP | Debt – Loans & Bonds | 5.4 | Pershing Square Holdings | North America | (40.6) |
| Henderson Far East Income | Asia Pacific Equity Income | 2.6 | Smithson Investment Trust | Global Smaller Companies | (37.6) |
| TwentyFour Select Monthly Income | Debt – Loans & Bonds | 2.5 | Monks | Global | (28.0) |
| Invesco Bond Income Plus | Debt – Loans & Bonds | 2.0 | BioPharma Credit | Debt – Direct Lending | (27.3) |
M&G Credit Income raised capital in response to growing demand for the trust, following positive results. Most of the trusts in the table recently issued or increased dividends, such as Invesco Bond Income Plus, which raised its shareholder payments despite recent underperformance, which the manager partly attributes to a difficult macroeconomic background.
Again, Scottish Mortgage leads the list, continuing its £1bn buyback programme. The other entrants have also made appearances in recent months. BioPharma Credit announced a decent set of results during the month and really does not deserve to be sitting on a discount and buying back stock.
Major news stories and QuotedData views over March 2025
Portfolio developments
- 3i Infrastructure income ahead of expectations, portfolio continues to perform
- RTW Biotech Opportunities reports strong 2024 and outlines bullish 2025 outlook
- VietNam Holding reports strong half(year results and optimism builds for 2025
- Temple Bar delivers another year of strong outperformance and proposes dividend uplift
- Foresight Environmental hails deal to expand its biofuels business
- Oakley Capital has been busy making new investments
- Challenging start to the year for Pacific Horizon as volatility rises
- HydrogenOne Capital Growth’s Elcogen announces SYRIUS Project in green steel
- RIT Capital back firing on all cylinders
- Stellar year for Tetragon Financial Group
- TRIG completes sale stake in German offshore wind farm
- Challenging start to the year for Pacific Horizon as volatility rises
- Golden Prospect doing well but lagging the gold price
- Pershing Square delivers solid 2024 returns despite market headwinds
Corporate news
- Foresight Environmental Infrastructure extends buyback programme to £30m
- Montanaro European announces three strategic initiatives
- Herald shareholders back continuation – Saba rebuffed again
- Oakley Capital Investments ends dividend and launches £20m annual buyback
- Lindsell Train Investment Trust trims LTL stake in staff deal
- NextEnergy Solar Fund consolidates RCF as capital recycling programme takes shape
- Alliance Witan publishes first set of results since merger
- Geiger Counter survives Saba attempt to kill it off
- Montanaro UK Smaller Companies announces surprise buyback, raising speculation of Saba exit
- CQS Natural Resources Growth and Income announces Saba has withdrawn second requisition notice
- abrdn goes full circle, rebranding itself as Aberdeen
- Murray International now a Dividend Hero
- Glencore backed Cobalt Holdings to list on LSE
- Foresight courts Harmony Energy Income with possible cash offer at 84p per share
Property news
QuotedData views
Visit quoteddata.com for more on these and other stories plus in-depth analysis on some funds, the tools to compare similar funds and basic information, key documents and regulatory news announcements on every investment company quoted in London.

Interviews
Have you been listening to our weekly news round-up shows? Every Friday at 11 am, we run through the more interesting bits of the week’s news, and we usually have a special guest or two answering questions about a particular investment company.
| Friday | The news show | Special Guest | Topic |
|---|---|---|---|
| 4 October | ROOF, KPC, RESI, TENT | Richard Brown | Castelnau Group |
| 11 October | UIL, JFJ, JSGI, ALW | James Armstrong | Bluefield Solar Opportunities |
| 18 October | HEIT, GABI | Katie Potts | Herald Investment Trust |
| 25 October | ALW, JFJ, ATS, ARR, UKW | Helen Steers | Pantheon International |
| 1 January | BPCR, RNEW | Job Curtis | City of London |
| 8 December | JARA, WKOF, ROOF, HGEN, FGEN, SUPR | Ian ‘Franco’ Francis | CQS New City High Yield |
| 15 December | BGCG, CHRY, AJOT | Sebastian Lyon | Personal Assets Trust |
| 22 December | BGLF, EWI, MINI | Alex Crooke | Bankers Investment Trust |
| 29 December | HEIT, GRID, CLDN | Weekly News Show Special | Investing for income |
| 6 December | KPC, GPM, HOME | David Smith | Henderson High Income |
| 13 December | RNEW, AGT, TMI | Craig Baker | Alliance Witan |
| 3 January | Review of 2024 | James Carthew & Andrew McHattie | Review of 2024 |
| 10 January | CYN, MINI, RTW | Alexander Darwall | European Opportunities |
| 17 January | ENRG, FGEN, MTU, BOOK | Gary Robinson | Baillie Gifford US Growth |
| 24 January | SWEF, TMI, CRT, BLND | Joe Bauernfreund | AVI Global Trust |
| 31 January | LBOW, ESCT, THRG, IEM, ORIT | Douglas Brodie | Edinburgh Worldwide |
| 7 February | RNEW, RESI, PSDL, RSE, PEY, CYN | Mark Boggett | Seraphim Space |
| 14 February | BASC, JGC, Saba | Prashant Khemka | Ashoka WhiteOak Emerging Markets Trust |
| 21 February | FSFL, AIC, HRI, AGR. HOME | Samantha FitzPatrick | Murray International |
| 28 February | MHN, BRAI, TRIG | Richard Hulf | HydrogenOne Capital |
| 7 March | Saba, VEIL, WHR, SUPR, SHED | Philip Kent | GCP Infrastructure |
| 14 March | MGCI, AGR, CRT, SHED, LABS | Nicola Takada | AVI Japan Opportunity Trustl |
| 21 March | TMPL, HEIT, SDV | Richard Stone | The AIC |
| 28 March | MTE, INPP, FJV, OCI | In the HotSeat Special | Ideas for your ISA |
| 4 April | FJV, AJOT, ENRG, EAT | Laura Foll & Denis Jackson | Law Debenture |
| Coming up | |||
| 11 April | Stephen Rosser | NextEnergy Capital | |
| 2 May | Prashant Khemka | Ashoka WhiteOak India |
Research
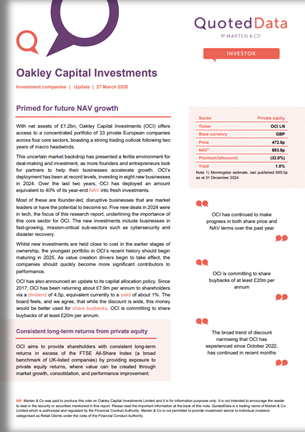
With net assets of £1.2bn, Oakley Capital Investments (OCI) offers access to a concentrated portfolio of 33 private European companies across four core sectors, boasting a strong trading outlook following two years of macro headwinds.
This uncertain market backdrop has presented a fertile environment for deal-making and investment, as more founders and entrepreneurs look for partners to help their businesses accelerate growth. OCI’s deployment has been at record levels, investing in eight new businesses in 2024. Over the last two years, OCI has deployed an amount equivalent to 40% of its year-end NAV into fresh investments.
Most of these are founder-led, disruptive businesses that are market leaders or have the potential to become so. Five new deals in 2024 were in tech, the focus of this research report, underlining the importance of this core sector for OCI. The new investments include businesses in fast(growing, mission(critical sub(sectors such as cybersecurity and disaster recovery.
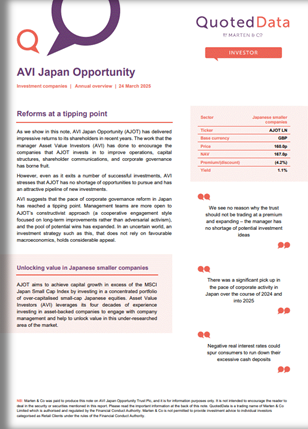
As we show in this note, AVI Japan Opportunity (AJOT) has delivered impressive returns to its shareholders in recent years. The work that the manager Asset Value Investors (AVI) has done to encourage the companies that AJOT invests in to improve operations, capital structures, shareholder communications, and corporate governance has borne fruit.
However, even as it exits a number of successful investments, AVI stresses that AJOT has no shortage of opportunities to pursue and has an attractive pipeline of new investments.
AVI suggests that the pace of corporate governance reform in Japan has reached a tipping point. Management teams are more open to AJOT’s constructivist approach (a cooperative engagement style focused on long-term improvements rather than adversarial activism), and the pool of potential wins has expanded. In an uncertain world, an investment strategy such as this, that does not rely on favourable macroeconomics, holds considerable appeal.
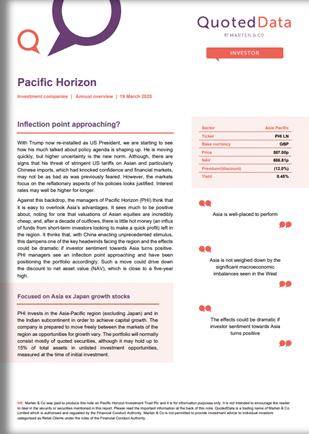
With Trump now re(installed as US President, we are starting to see how his much talked about policy agenda is shaping up. He is moving quickly, but higher uncertainty is the new norm. Although, there are signs that his threat of stringent US tariffs on Asian and particularly Chinese imports, which had knocked confidence and financial markets, may not be as bad as was previously feared. However, the markets focus on the reflationary aspects of his policies looks justified. Interest rates may well be higher for longer.
Against this backdrop, the managers of Pacific Horizon (PHI) think that it is easy to overlook Asia’s advantages. It sees much to be positive about, noting for one that valuations of Asian equities are incredibly cheap, and, after a decade of outflows, there is little hot money (an influx of funds from short(term investors looking to make a quick profit) left in the region. It thinks that, with China enacting unprecedented stimulus, this dampens one of the key headwinds facing the region and the effects could be dramatic if investor sentiment towards Asia turns positive.
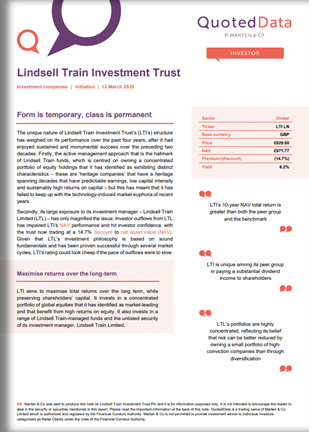
The unique nature of Lindsell Train Investment Trust’s (LTI’s) structure has weighed on its performance over the past four years, after it had enjoyed sustained and monumental success over the preceding two decades. Firstly, the active management approach that is the hallmark of Lindsell Train funds, which is centred on owning a concentrated portfolio of equity holdings that it has identified as exhibiting distinct characteristics – these are ‘heritage companies’ that have a heritage spanning decades that have predictable earnings, low capital intensity and sustainably high returns on capital – but this has meant that it has failed to keep up with the technology-induced market euphoria of recent years.
Secondly, its large exposure to its investment manager – Lindsell Train Limited (LTL) – has only magnified the issue. Investor outflows from LTL has impaired LTI’s NAV performance and hit investor confidence, with the trust now trading at a 14.7% discount to net asset value (NAV). Given that LTL’s investment philosophy is based on sound fundamentals and has been proven successful through several market cycles, LTI’s rating could look cheap if the pace of outflows were to slow.
After years of incrementally(positive but slow-moving reforms, we are now starting to see real momentum across Japan’s corporate landscape as companies embrace governance changes and capital efficiency improvements. Over the past 12 months, dividend growth has accelerated to its fastest pace in 20 years and buybacks have reached record highs, climbing well above previous averages. This dramatic shift towards more shareholder-friendly policies and a removal of traditional barriers to M&A has resulted in a wave of interest from international investors looking to capitalise on the deep discounts at which many Japanese corporates now trade to their intrinsic values.
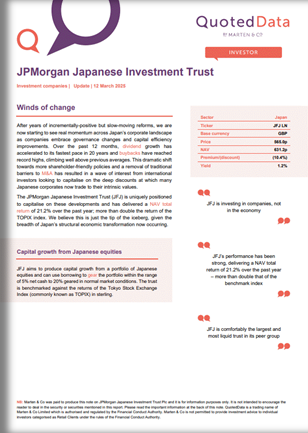
The JPMorgan Japanese Investment Trust (JFJ) is uniquely positioned to capitalise on these developments and has delivered a NAV total return of 21.2% over the past year; more than double the return of the TOPIX index. We believe this is just the tip of the iceberg, given the breadth of Japan’s structural economic transformation now occurring.
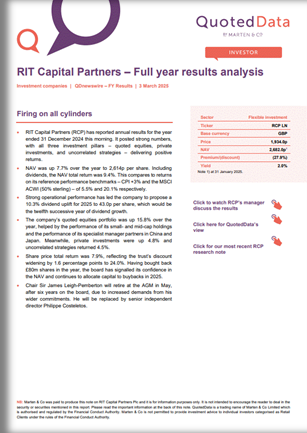
RIT Capital Partners (RCP) has reported annual results for the year ended 31 December 2024 this morning. It posted strong numbers, with all three investment pillars – quoted equities, private investments, and uncorrelated strategies – delivering positive returns.
NAV was up 7.7% over the year to 2,614p per share. Including dividends, the NAV total return was 9.4%. This compares to returns on its reference performance benchmarks – CPI +3% and the MSCI ACWI (50% sterling) – of 5.5% and 20.1% respectively.
Strong operational performance has led the company to propose a 10.3% dividend uplift for 2025 to 43.0p per share, which would be the twelfth successive year of dividend growth.
The company’s quoted equities portfolio was up 15.8% over the year, helped by the performance of its small( and mid(cap holdings and the performance of its specialist manager partners in China and Japan. Meanwhile, private investments were up 4.8% and uncorrelated strategies returned 4.5%.
Upcoming events
Here is a selection of what is coming up. Please refer to the Events section of our website for updates between now and when they are scheduled:
- Law Debenture Corporation AGM 2025
- CQS New City High Yield Fund shareholder presentation 2025
- River UK Micro Cap shareholder presentation 2025
- Bellevue Healthcare Trust AGM 2025
- Smithson Investment Trust AGM 2025
- Greencoat UK Wind AGM 2025
- Premier Miton Global Renewables AGM 2025
- Murray International Trust AGM 2025
- CVC Income & Growth (Euro) AGM 2025
- Care REIT EGM 2025
- Literacy Capital Shareholder presentation 2025
- F&C Investment Trust AGM 2025
- Weiss Korea Opportunity Fund EGM 2025
- BlackRock American Income AGM 2025
- Allianz Technology Trust AGM 2025
- Athelney Trust AGM 2025
- Premier Miton Global Renewables Shareholder presentation 2025
- Schroder Asian Total Return AGM 2025
- Schroder Asian Total Return Shareholder Presentation 2025
- Chelverton UK Dividend Trust EGM 2025
- CVC Income & Growth (Sterling) AGM 2025
- Harmony Energy Income Trust AGM 2025
- BBGI Global Infrastructure S.A. AGM 2025
Guide

Our independent guide to quoted investment companies is an invaluable tool for anyone who wants to brush up on their knowledge of the investment companies’ sector. Please register on www.quoteddata.com if you would like it emailed to you directly.
Appendix 1 – median performance by sector, ranked by 2025 year to date price total return
| YTD Rank |
Sector | Share price total return YTD (%) | NAV total return YTD (%) |
Discount 31/03/25 (%) |
Discount 28/02/25 (%) |
Change in discount (%) |
Median mkt cap 31/03/25 (£m) |
|---|---|---|---|---|---|---|---|
| 1 | Property – UK Logistics | 27.0 | 0.6 | (18.3) | (27.1) | 8.8 | 604.6 |
| 2 | Property – UK Healthcare | 23.7 | 1.4 | (17.1) | (30.0) | 12.9 | 509.5 |
| 3 | China / Greater China | 18.8 | 10.8 | (9.1) | (7.8) | (1.3) | 210.9 |
| 4 | Latin America | 11.6 | 11.7 | (11.1) | (7.1) | (4.0) | 90.1 |
| 5 | Europe | 7.1 | 3.3 | (7.3) | (9.2) | 1.9 | 520.2 |
| 6 | European Smaller Companies | 5.5 | 4.2 | (7.8) | (8.3) | 0.6 | 417.3 |
| 7 | Leasing | 5.0 | 0.3 | (33.5) | (33.4) | (0.1) | 149.2 |
| 8 | Debt – Structured Finance | 4.3 | (0.2) | (1.1) | (10.5) | 9.4 | 164.4 |
| 9 | UK Equity & Bond Income | 3.8 | 4.9 | (7.8) | (8.2) | 0.3 | 288.5 |
| 10 | Property – UK Residential | 3.0 | 1.1 | (40.7) | (40.8) | 0.1 | 173.0 |
| 11 | Global Equity Income | 2.7 | (0.2) | (2.4) | (2.2) | (0.2) | 336.1 |
| 12 | Infrastructure Securities | 2.3 | 4.8 | (14.4) | (13.5) | (0.8) | 110.4 |
| 13 | UK Equity Income | 2.1 | 0.9 | (5.4) | (6.5) | 1.1 | 372.7 |
| 14 | Global Emerging Markets | 2.1 | 0.4 | (11.9) | (9.9) | (2.0) | 278.2 |
| 15 | Debt – Loans & Bonds | 1.7 | 1.2 | 1.4 | 1.0 | 0.4 | 155.3 |
| 16 | Property – Debt | 0.9 | 1.3 | (15.1) | (14.7) | (0.4) | 27.2 |
| 17 | Infrastructure | 0.3 | 1.6 | (23.7) | (23.2) | (0.5) | 1,000.8 |
| 18 | Flexible Investment | 0.3 | (0.1) | (12.9) | (9.7) | (3.2) | 114.9 |
| 19 | UK All Companies | 0.0 | (5.6) | (9.1) | (8.3) | (0.8) | 261.2 |
| 20 | Property – UK Commercial | 0.0 | 1.7 | (22.5) | (23.8) | 1.2 | 158.3 |
| 21 | Commodities & Natural Resources | (0.1) | (0.4) | (15.1) | (9.8) | (5.2) | 55.3 |
| 22 | Property – Europe | (0.1) | 1.2 | (32.1) | (35.4) | 3.4 | 193.1 |
| 23 | Property – Rest of World | (0.8) | (1.5) | (69.7) | (73.2) | 3.5 | 15.3 |
| 24 | Debt – Direct Lending | (0.9) | 1.9 | (20.5) | (16.5) | (4.0) | 74.4 |
| 25 | Asia Pacific Smaller Companies | (1.0) | (5.7) | (12.1) | (13.2) | 1.1 | 339.7 |
| 26 | Asia Pacific Equity Income | (1.7) | (2.6) | (9.2) | (9.5) | 0.3 | 365.1 |
| 27 | Hedge Funds | (1.7) | (3.4) | (18.9) | (19.4) | 0.6 | 80.2 |
| 28 | Japanese Smaller Companies | (1.9) | 3.9 | (7.7) | (7.0) | (0.7) | 295.8 |
| 29 | Japan | (2.0) | (3.0) | (11.7) | (10.4) | (1.3) | 274.2 |
| 30 | North America | (2.2) | (1.0) | (9.6) | (9.0) | (0.6) | 505.2 |
| 31 | Private Equity | (2.6) | 0.4 | (35.8) | (32.8) | (3.0) | 569.6 |
| 32 | Growth Capital | (2.8) | (0.7) | (38.5) | (37.5) | (1.0) | 130.9 |
| 33 | Renewable Energy Infrastructure | (3.7) | 1.6 | (34.0) | (34.5) | 0.5 | 353.0 |
| YTD Rank |
Sector | Share price total return YTD (%) | NAV total return YTD (%) |
Discount 31/03/2025 (%) |
Discount 28/02/25 (%) |
Change in discount (%) |
Median mkt cap 31/03/25 (£m) |
|---|---|---|---|---|---|---|---|
| 34 | Asia Pacific | (4.6) | (5.3) | (11.8) | (12.5) | 0.7 | 471.9 |
| 35 | Global | (6.3) | (4.8) | (9.2) | (8.3) | (0.9) | 989.6 |
| 36 | Country Specialist | (7.7) | (5.8) | (14.1) | (14.9) | 0.8 | 339.6 |
| 37 | Global Smaller Companies | (7.7) | (7.0) | (11.4) | (10.5) | (0.9) | 676.1 |
| 38 | Financials & Financial Innovation | (8.3) | 2.0 | (26.3) | (24.4) | (2.0) | 369.7 |
| 39 | UK Smaller Companies | (8.4) | (7.4) | (11.2) | (10.3) | (0.9) | 99.7 |
| 40 | Environmental | (8.5) | (7.0) | (10.8) | (10.2) | (0.6) | 771.2 |
| 41 | India/Indian Subcontinent | (9.0) | (9.7) | (11.9) | (13.1) | 1.1 | 406.6 |
| 42 | Biotechnology & Healthcare | (12.7) | (9.7) | (10.0) | (12.3) | 2.3 | 302.5 |
| 43 | North American Smaller Companies | (13.4) | (10.5) | (9.0) | (8.7) | (0.3) | 192.8 |
| 44 | Insurance & Reinsurance Strategies | (13.5) | (3.0) | (28.9) | (20.2) | (8.6) | 57.4 |
| 45 | Technology & Technology Innovation | (16.9) | (14.8) | (11.4) | (11.7) | 0.4 | 2,345.2 |
MEDIAN |
(0.8) | (0.1) | (11.9) | (11.7) | (0.2) | 288.5 |
IMPORTANT INFORMATION
This note was prepared by Marten & Co (which is authorised and regulated by the Financial Conduct Authority).
This note is for information purposes only and is not intended to encourage the reader to deal in the security or securities mentioned within it. Marten & Co is not authorised to give advice to retail clients. The note does not have regard to the specific investment objectives, financial situation and needs of any specific person who may receive it.
Marten & Co may have or may be seeking a contractual relationship with any of the securities mentioned within the note for activities including the provision of sponsored research, investor access or fundraising services.
This note has been compiled from publicly available information. This note is not directed at any person in any jurisdiction where (by reason of that person’s nationality, residence or otherwise) the publication or availability of this note is prohibited.
Accuracy of Content: Whilst Marten & Co uses reasonable efforts to obtain information from sources which we believe to be reliable and to ensure that the information in this note is up to date and accurate, we make no representation or warranty that the information contained in this note is accurate, reliable or complete. The information contained in this note is provided by Marten & Co for personal use and information purposes generally. You are solely liable for any use you may make of this information. The information is inherently subject to change without notice and may become outdated. You, therefore, should verify any information obtained from this note before you use it.
No Advice: Nothing contained in this note constitutes or should be construed to constitute investment, legal, tax or other advice.
No Representation or Warranty: No representation, warranty or guarantee of any kind, express or implied is given by Marten & Co in respect of any information contained in this note.
Exclusion of Liability: To the fullest extent allowed by law, Marten & Co shall not be liable for any direct or indirect losses, damages, costs or expenses incurred or suffered by you arising out or in connection with the access to, use of or reliance on any information contained in this note. In no circumstance shall Marten & Co and its employees have any liability for consequential or special damages.
Governing Law and Jurisdiction: These terms and conditions and all matters connected with them, are governed by the laws of England and Wales and shall be subject to the exclusive jurisdiction of the English courts. If you access this note from outside the UK, you are responsible for ensuring compliance with any local laws relating to access.
No information contained in this note shall form the basis of, or be relied upon in connection with, any offer or commitment whatsoever in any jurisdiction.
Investment Performance Information: Please remember that past performance is not necessarily a guide to the future and that the value of shares and the income from them can go down as well as up. Exchange rates may also cause the value of underlying overseas investments to go down as well as up. Marten & Co may write on companies that use gearing in a number of forms that can increase volatility and, in some cases, to a complete loss of an investment.