
Cash pile grows as valuations climb
Global Opportunities Trust (GOT)’s NAV growth over 2025 was primarily driven by the contribution from its equity portfolio. Shareholders also benefitted from a narrowing of its discount.
The manager observed rising valuation multiples on many of the stocks in the portfolio and in the wider market, and decided to book profits and raise cash levels. The manager states that the portfolio is positioned to take advantage of a potential market setback.
The trust is no longer self-managed. This change could give it greater flexibility regarding the use of gearing and derivatives in the future. According to the manager, there are currently some opportunities in mid-cap companies with idiosyncratic valuation drivers and low economic sensitivity.
Attractive, real, long-term total returns
GOT aims to provide shareholders with an attractive real long-term total return by investing in globally in undervalued asset classes, without reference to the composition of any stock market index.
| 12 months ended | Share price total return (%) | NAV total return(%) | MSCI ACWI total return (%) | World Govt. Bond Index1 TR (%) |
|---|---|---|---|---|
| 31/12/2021 | 4.6 | 5.1 | 19.6 | 11.9 |
| 31/12/2022 | 9.8 | 15.9 | (8.7) | (3.7) |
| 31/12/2023 | (3.6) | 1.6 | 15.8 | 3.0 |
| 31/12/2024 | (2.4) | 4.1 | 19.8 | 6.9 |
| 31/12/2025 | 21.9 | 10.2 | 13.9 | 8.7 |
Source: Bloomberg, Marten & Co. Note 1) Bloomberg Global Aggregate Treasuries Index
Fund profile – no longer self-managed
More information is available on the trust’s website globalopportunitiestrust.com
GOT aims to provide shareholders with a real long-term total return by investing globally in asset classes that it considers undervalued, without reference to the composition of any stock market index.
GOT is a trust structured for investors seeking long-term absolute returns and not for those focused on short-term market movements. The portfolio appears to be based on value opportunities, though it does not follow a traditional value investment strategy. According to the manager, Goodhart is prepared to invest across various industries and at all stages of a company’s life cycle, including growth, emerging quality, quality, classic value, discounted assets, and special situations, and stock selection may reflect elements of each. The investment approach is described in detail in the initiation note, with further information available on page 6 of that document.
Until recently, GOT was a self-managed trust. With effect from 2 January 2026, GOT’s AIFM is Juniper Partners Limited. It has delegated responsibility for managing the portfolio to Goodhart Partners LLP (Goodhart). Goodhart’s fee is 0.50% of NAV per annum plus £30,000 which is allocated to marketing services. The board estimates that the ongoing running costs of the company will be about 1.11% per annum.
The switch away from being self-managed may give GOT greater flexibility regarding gearing and the use of derivative instruments within its portfolio for efficient portfolio management.
Goodhart was launched in 2009. Its investment team includes Dr Sandy Nairn, who prior to 2 January 2026 was the executive director of GOT responsible for managing its portfolio. He has resigned as a director of GOT and its board is now entirely nonexecutive and does not have any connection to the manager.
A rejection of benchmarks
Goodhart was named for “Goodhart’s law”, which states that when a measure becomes a target, it may cease to be a good measure.
The approach rejects investment strategies that focus primarily on beating index benchmarks, which the Goodhart team views as a perceived failure of much of the asset management industry. According to the Goodhart team, large asset managers have become focused on asset-gathering and may have lost focus on understanding how to manage money. The team also states that asset manager consolidation can result in smaller, less liquid opportunities being overlooked.
Manager’s view
Within GOT’s portfolio, defensive stocks selected for their resilient qualities appeared to perform well over 2025. GOT held a number of large-cap stocks with modest revenue growth and solid margins. These were expected to generate high single-digit returns each year, but the manager states that many of these were up by 50% or more in just six months. Given its value discipline, the manager decided to book profits on these positions, selling stocks such as Imperial Brands and Tesco. Some of these have continued to rise since, but GOT’s manager states that protecting the downside is more important than seeking higher returns.
GOT’s manager says that the search for replacement ideas has led it towards “resilient +” midcap stocks with business models that are not significantly exposed to the economic cycle. Examples within the portfolio include Rovi, Viscofan, and Bakkafrost (some of these are described on pages 7 and 8). The position sizes of these resilient + stocks are smaller, reflecting the additional risk that can be associated with investing in smaller companies. The manager believes that these stocks could be more defensive in falling markets and may even rise for idiosyncratic reasons.
Stocks such as construction materials business Breedon, which the manager believed was too exposed to the UK economy, and materials handling business Kalmar have been sold.
Whilst positions in defence and energy have been trimmed, the manager states that these are areas that may benefit from deteriorating geopolitics and has retained some exposure. GOT holds the large prime contractors rather than some of the more specialist defence companies, which the manager notes have already risen in price and may no longer appear as attractive. The manager believes that the increase in defence spending observed recently could benefit the prime contractors for some years, and that share prices may not yet reflect the potential profit growth.
GOT’s Japanese exposure, which as detailed in the initiation note is achieved through a position in AVI Japanese Special Situations, has been reduced following a period of performance that the manager believes has lowered the absolute upside potential from this area. However, there may be upside if Japanese investors move money back into the domestic equity market.
The manager is planning for a scenario in which GOT’s portfolio may rise in flat markets, while potentially experiencing approximately 20% of the downside in a falling market. The manager states that there is increasing concern about the prospect of falling markets, and as part of this, the weighting in cash and other assets has increased, as shown in the next section.
The manager has considered the potential for a bear market, rather than a short-term correction. The manager notes that a bear market has not occurred since the GFC, which may be outside the experience of many fund managers. According to GOT, in such scenarios, avoiding large cap, AI infrastructure stocks may not be sufficient as market leadership appears to change. GOT states that its liquidity could provide flexibility to respond to such situations.
The manager states that when markets decline, they are aware of the tendency for markets to rally and fall back multiple times before a recovery occurs. GOT’s team includes both value and growth style investors, which the manager believes provides a breadth of opportunity. The manager indicates that a setback could create opportunities to buy higher-growth mid-cap companies, potentially those that may use AI to challenge incumbents.
Asset allocation
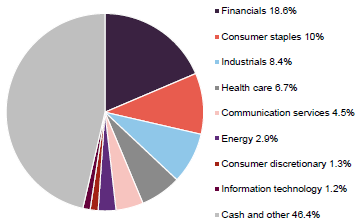
Figure 1: GOT portfolio split by sector as at 31 December 2025
Source: Global Opportunities Trust
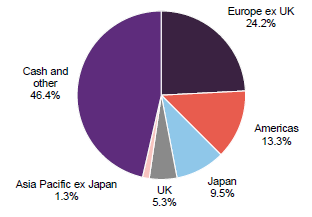
Figure 2: GOT portfolio split by region as at 31 December 2025
Source: Global Opportunities Trust
There have been changes to sector weightings since the end of May 2025. GOT’s exposure to financials and industrials has decreased (from 22.6% to 18.6% and 15.6% to 8.4%, respectively), and the allocation to cash and other has increased from 35.4% to 46.4%.
On a geographic basis, the main change has been a reduction in UK exposure and an increase in cash and other.
Top 10 holdings
Since the last publication, using data as at the end of May 2025, Lloyds Banking Group, Alibaba, Jet2, Total Energies, and Qinetiq are no longer in the top 10 holdings and have been replaced by Carlsberg, GQG Partners, Terveystalo, Philips, and Nestle. Lloyds’ share price increased by over 80% last year and the manager has sold the position completely. The position in Jet2 has been reduced; the manager states that it is still considered a low-priced stock with significant cash on the balance sheet. TotalEnergies and Qinetiq were also partially sold, which the manager states reflects a decision to reduce exposure to energy and defence sectors. The manager also realised some profits on GOT’s stake in Alibaba.
In total, there were 25 equity positions in the portfolio at the end of December 2025.
Figure 3: GOT 10 largest holdings as at 31 December 2025
| Country | Sector | % of net assets 31/12/25 | % of net assets 31/05/25 | Change(%) | |
|---|---|---|---|---|---|
| AVI Japanese Special Situations Fund | Japan | n/a | 9.5 | 12.7 | (3.2) |
| Volunteer Park Capital Fund | Luxembourg | n/a | 7.1 | 6.9 | 0.2 |
| Unilever | United Kingdom | Consumer staples | 2.8 | 3.3 | (0.5) |
| Orange | France | Communication services | 2.8 | 2.6 | 0.2 |
| Carlsberg | Denmark | Consumer staples | 2.1 | – | 2.1 |
| GQG Partners | United States | Financials | 2.0 | – | 2.0 |
| Dassault Aviation | France | Industrials | 1.9 | 3.3 | (1.4) |
| Terveystalo | Finland | Health care | 1.8 | 1.9 | (0.1) |
| Koninklijke Philips | Netherlands | Health care | 1.8 | 0.7 | 1.1 |
| Nestle | Switzerland | Consumer staples | 1.7 | 1.3 | 0.4 |
| Total | 33.5 |
Source: Global Opportunities Trust
Carlsberg
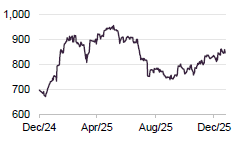
Figure 4: Carlsberg (DKK)
Source: Bloomberg
The Danish brewer Carlsberg (carlsberggroup.com) has a portfolio of more than 180 brands and sells its products in more than 100 countries. It has a medium-term goal of delivering 4%–6% organic revenue growth and rebuilding its gross margins with the aid of strict cost control. Over H1 2025, revenues from its premium beer brands grew by 5% and it achieved 6% growth in soft drinks (which now includes Britvic, following its acquisition at the start of 2025). That translated into 4.7% growth in its adjusted EPS over H1, and the company has said that it expects to extract further cost and revenue synergies from the Britvic deal.
GQG Partners
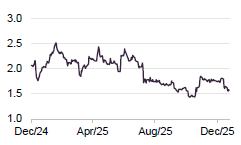
Figure 5: GQG Partners (AUD)
Source: Bloomberg
GQG Partners (gqg.com) is an asset management business headquartered in the US and listed in Australia. It manages one of Alliance Witan’s sub-portfolios.
Over the first half of 2025, money continued to flow into its funds (net inflows of $8bn). However, since then, GQG’s assets under management have decreased from $172.4bn to $163.9bn. This appears to have coincided with a decline in its share price, as Figure 5 shows, which GOT’s manager says provided it with a lower entry point.
The attraction for GOT appears to be GQG’s defensive stance, which has weighed on performance in the short term (its global equity strategy has lagged the MSCI ACWI over one-, three-, and five-year periods to end June), but may position it for future success if markets decline. GOT’s manager states that GQG is relatively underrepresented in the US mutual fund market, but believes that outperformance in a downturn could help drive substantial inflows. The free float is relatively small, which means that positive news could have a disproportionately positive effect on the share price, in its view.
Koninklijke Philips
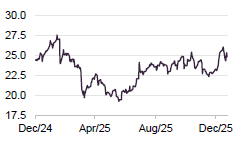
Figure 6: Koninklijke Philips (EUR)
Source: Bloomberg
Philips (philips.com) is a healthcare technology business. Its products include patient monitoring devices, ultrasound, imaging, diagnostics, MRI and CT scanners, and personal health products such as electric razors and toothbrushes. The company invests over 9% of revenues in R&D in 2024.
There are a number of factors that may contribute to increased healthcare spending, including ageing populations, growing demand from emerging markets, and innovation expanding the range of available therapies.
The company is targeting revenue growth in the low to mid-single digits, margin expansion from high single digits to low teens, and lower debt. Its Q3 figures showed 3% sales growth and 12.3% EBITDA margins.
Other new positions
Rovi
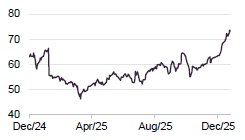
Figure 7: Rovi (EUR)
Source: Bloomberg
Laboratorios Farmaceuticos Rovi (rovi.es) is a Spanish biotech company with a focus on Heparin (an anticoagulant) and related products. It develops and markets its own products and also operates a contract development and manufacturing business (CDMO), collaborating with other pharmaceutical firms. Most recently, it has agreed to manufacture a new drug, currently in clinical development, in Roche’s metabolic and cardiovascular portfolio. In November 2025, Rovi stated that it expects its operating revenue to increase by between a high single-digit and low double-digit percentage compared to 2025. The manager comments that part of the attraction is the prospect of Rovi earning higher returns on recent capital expenditures as it uses more of the capacity at its plants.
Rovi was a 1.6% position in the portfolio at the end of December 2025.
Viscofan
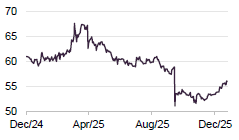
Figure 8: Viscofan (EUR)
Source: Bloomberg
Viscofan (viscofan.com) is a Spanish manufacturer of sausage casings, with production plants worldwide. Its Q3 2025 figures showed like-for-like year-on-year revenue growth of 5.5% and 7.3% growth in EBITDA.
In October 2025, the share price was impacted by allegations of environmental problems at the company’s US plant in Danville, Illinois. The company responded saying that the accusers’ claims were misleading. The pull-back in the share price provided GOT with an opportunity to buy stock at a level the manager considers attractive.
GOT’s manager believes that Viscofan is well-placed as one of its US competitors is private-equity-funded and has not received significant investment. Viscofan was a 1.5% position in the portfolio at the end of December 2025.
Performance
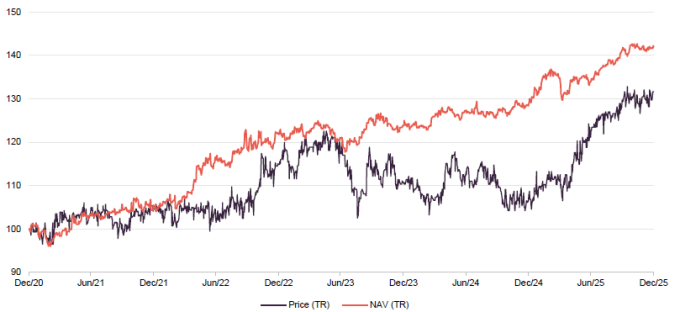
Figure 9: GOT share price and NAV performance over five years ended 31 December 2025
Source: Bloomberg, Marten & Co
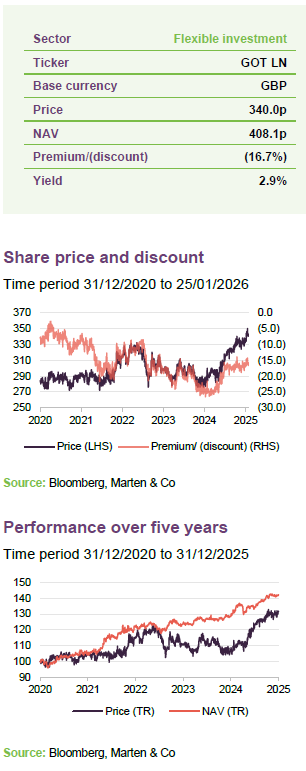
As Figure 9 shows, the NAV appears to continue to make steady progress and the share price has been starting to catch up since about April/May last year. As with the initiation note, a comparison with some indices is included in the following table. However, the manager states that they do not invest with benchmarks in mind.
Figure 10: GOT cumulative total returns over time periods ended 31 December 2025
| 3 months (%) | 6 months (%) | 1 year (%) | 3 years(%) | 5 years(%) | 10 years(%) | |
|---|---|---|---|---|---|---|
| GOT share price | 1.5 | 8.7 | 21.9 | 14.6 | 31.7 | 76.2 |
| GOT NAV | 0.6 | 6.0 | 10.2 | 16.6 | 42.0 | 103.1 |
| MSCI ACWI | 3.3 | 13.3 | 13.9 | 58.0 | 72.5 | 231.9 |
| Bloomberg Global Aggregate Treasuries Index | 2.5 | 5.9 | 8.7 | 19.7 | 29.0 | 3.9 |
| UK CPI1 | 0.4 | 0.6 | 3.1 | 10.4 | 28.0 | 39.4 |
Source: Bloomberg, Marten & Co. Note 1) UK CPI is to end November 2025
GOT’s defensive positioning suggests that it may not keep pace with equity indices during periods of rising markets. Given this, the one-year figures appear favourable. GOT has delivered absolute real returns to shareholders over the short, medium, and long term despite heightened inflation in recent years.
As part of our analysis, we looked at GOT’s returns in up and down months over the period since the investment policy was formally changed in December 2021. In months when the MSCI ACWI index was falling, GOT’s NAV rose by 1.0% on average, versus an average fall in the index of 2.6%. In months where the index was rising, GOT’s average return was 0.5%, which compares to 2.9% for the index. GOT’s returns in these periods may indicate defensive characteristics.
Contributions to returns over 2025
Figure 11: Positive contributions to returns
| Stock | (%) | ||
|---|---|---|---|
| Alibaba | 1.9 | ||
| Lloyds Banking | 1.3 | ||
| Danieli | 1.2 | ||
| Orange | 1.2 | ||
| Dassault Aviation | 1.0 |
Source: Goodhart partners
Figure 12: Negative contributions to returns
| Stock | (%) | ||
|---|---|---|---|
| Azelis | (0.9) | ||
| Bakkafrost | (0.4) | ||
| Breedon Group | (0.3) | ||
| Jet2 | (0.2) | ||
| Whitbread | (0.1) |
Source: Goodhart partners
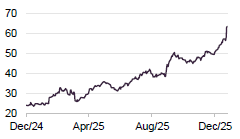
Figure 13: Danieli (EUR)
Source: Bloomberg
Danieli
Last year Danieli (danieli.com) moved into GOT’s top 10, which appears to be linked to share price performance following several contract wins, as shown in Figure 13. The family-controlled company manufactures machinery used in steel-making and the production of steel products. According to the manager, Danieli has benefited from efforts to reduce the industry’s carbon footprint, and its products may be more efficient than legacy plant. The customer base is global and includes many of the leading industry participants. The manager has taken some profits; Danieli was a 1.4% position in the portfolio at the end of December 2025.
Premium/(discount)
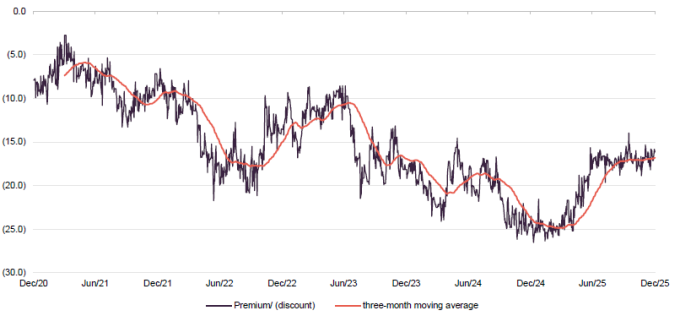
Figure 14: GOT premium/(discount) over five years ended 31 December 2025
Source: Bloomberg, Marten & Co
Over the 12 months ended 31 December 2025, GOT’s discount moved within a range of 26.5% to 14.0% and averaged 20.1%. As at 26 January 2026, GOT’s shares were trading on a discount of 16.7%.
GOT’s discount narrowed over H2 2025; a time when investors appeared to become more nervous about market valuations and the macroeconomic picture. Given GOT’s track record of limiting its participation in falling markets, there could be potential for further discount narrowing if this trend towards greater uncertainty continues, although the reverse could also occur.
GOT has share buyback powers but is not using them. The board has said that it is keen to narrow the discount and grow the company. However, given the size of the trust, the board is concerned that share buybacks could reduce liquidity and exacerbate the discount. Instead, the board’s focus is on raising the profile of the trust and the investment approach.
Previous publications
Our initiation note – Designed to navigate a world in flux – was published on 25 June 2025.
| IMPORTANT INFORMATION | ||
|---|---|---|
| Marten & Co (which is authorised and regulated by the Financial Conduct Authority) was paid to produce this note on Global Opportunities Trust Plc. This note is for information purposes only and is not intended to encourage the reader to deal in the security or securities mentioned within it. Marten & Co is not authorised to give advice to retail clients. The research does not have | regard to the specific investment objectives financial situation and needs of any specific person who may receive it. The analysts who prepared this note are not constrained from dealing ahead of it but, in practice, and in accordance with our internal code of good conduct, will refrain from doing so for the period from which they first obtained the information necessary to prepare the note until one month after the note’s publication. | Nevertheless, they may have an interest in any of the securities mentioned within this note. This note has been compiled from publicly available information. This note is not directed at any person in any jurisdiction where (by reason of that person’s nationality, residence or otherwise) the publication or availability of this note is prohibited. |
Accuracy of Content: Whilst Marten & Co uses reasonable efforts to obtain information from sources which we believe to be reliable and to ensure that the information in this note is up to date and accurate, we make no representation or warranty that the information contained in this note is accurate, reliable or complete. The information contained in this note is provided by Marten & Co for personal use and information purposes generally. You are solely liable for any use you may make of this information. The information is inherently subject to change without notice and may become outdated. You, therefore, should verify any information obtained from this note before you use it.
No Advice: Nothing contained in this note constitutes or should be construed to constitute investment, legal, tax or other advice.
No Representation or Warranty: No representation, warranty or guarantee of any kind, express or implied is given by Marten & Co in respect of any information contained on this note.
Exclusion of Liability: To the fullest extent allowed by law, Marten & Co shall not be liable for any direct or indirect losses, damages, costs or expenses incurred or suffered by you arising out or in connection with the access to, use of or reliance on any information contained on this note. In no circumstance shall Marten & Co and its employees have any liability for consequential or special damages.
Governing Law and Jurisdiction: These terms and conditions and all matters connected with them, are governed by the laws of England and Wales and shall be subject to the exclusive jurisdiction of the English courts. If you access this note from outside the UK, you are responsible for ensuring compliance with any local laws relating to access.
No information contained in this note shall form the basis of, or be relied upon in connection with, any offer or commitment whatsoever in any jurisdiction.
Investment Performance Information: Please remember that past performance is not necessarily a guide to the future and that the value of shares and the income from them can go down as well as up. Exchange rates may also cause the value of underlying overseas investments to go down as well as up. Marten & Co may write on companies that use gearing in a number of forms that can increase volatility and, in some cases, to a complete loss of an investment.
| QuotedData is a trading name of Marten & Co, which is authorised and regulated by the Financial Conduct Authority. 50 Gresham Street, London EC2V 7AY 0203 691 9430 www.QuotedData.com Registered in England & Wales number 07981621, 2nd Floor Heathmans House, 19 Heathmans Road, London SW6 4TJ |
|---|