
More than meets the eye?
Alliance Witan (ALW) has faced performance challenges at a time when global equity returns have become increasingly concentrated in a narrow group of large US AI-related stocks. Its diversified portfolio has not captured the full extent of the rally, while the combined positioning of its underlying managers appears to have left the trust less sensitive to rising markets than Willis Towers Watson (WTW) intended.
However, ALW’s portfolio companies have recorded higher fundamental growth than its benchmark (see page 6). This suggests that future returns may not need to rely solely on a change in market sentiment and associated valuation multiple expansion, but could potentially come from continued growth in the businesses themselves.
WTW has reshaped the portfolio at manager level (see page 9), reducing allocations where it considered defensive positioning to be too pronounced and increasing exposure to managers it considers better placed to participate in stronger markets.
Global stock-picking portfolio
Alliance Witan aims to be a core equity holding for investors that seeks to deliver a real return (after adjusting for inflation) over the long term through a combination of capital growth and a rising dividend. It invests primarily in global equities across a range of industries and sectors via a ‘manager of managers’ approach. This is intended to reduce the risk associated with investors selecting a single manager or one particular style that can move in and out of favour.
Share price and discount
Performance over five years
Time period 30/09/2021 to 30/09/2026
| Year ended | Share price total return (%) | NAV total return (%) | MSCI ACWI total return (%) |
|---|---|---|---|
| 30/09/22 | (7.0) | (7.5) | (4.2) |
| 30/09/23 | 15.4 | 16.0 | 10.5 |
| 30/09/24 | 17.5 | 17.4 | 19.9 |
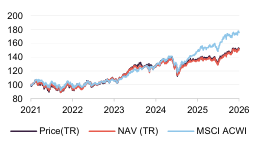
| 30/09/25 | 8.1 | 7.2 | 16.8 |
| 30/09/26 | 12.1 | 11.3 | 18.3 |
Fund profile
“a core equity holding for investors that delivers a real return over the long term”
Alliance Witan Trust (ALW) aims to be a core investment for retail investors, professionally advised private clients and institutions and to deliver a real return over the long term through a combination of capital growth and a rising dividend.
Manager Willis Towers Watson (WTW) has selected 11 stock pickers. Each of these manages a global portfolio of up to 20 stocks they consider their best ideas. In addition, GQG Partners also manages a more diversified emerging markets portfolio, with up to 60 stocks alongside its global portfolio.
WTW blends these into a portfolio, allocating capital in a way that seeks to balance ALW’s exposures across geographies, sectors and styles, while emphasising the potential impact of stock selection on the trust’s returns.
WTW’s global chief investment strategist, Craig Baker, chairs ALW’s investment committee, which also includes co-portfolio managers Stuart Gray and Mark Davis. They are supported by WTW’s specialist portfolio management, equity manager research and operational due diligence teams.
For performance measurement purposes, the trust is benchmarked against the MSCI All Country World Index in sterling terms (MSCI ACWI), but index weightings appear to have no bearing on stock selection decisions.
ALW (as Alliance Trust) has a history dating back to 1888. The “manager of managers” approach under WTW was adopted with effect from 1 April 2017. ALW is an AIC Dividend Hero, having increased its dividend in each of its last 59 financial years.
Market backdrop – strong markets, narrow leadership?
US equities remain close to record highs while potentially facing potential risks
Global equity markets have continued to rise during 2026, amid seemingly persistent inflationary pressures, higher bond yields and renewed geopolitical uncertainty. Even with a rise in oil prices that have followed the outbreak of the war in Iran, and long-dated US Treasury yields climbing to levels not seen for more than two decades, US equities have remained close to record highs.
But returns have been concentrated in a small number of US large cap AI-related names
However, behind the headline gains in markets, returns have often been concentrated in a relatively small number of companies associated with artificial intelligence (AI). This was apparent during the first half of the year, when ALW’s benchmark, the MSCI ACWI index, returned 12.7%, compared with ALW’s NAV total return of 7.0%. The ALW board highlighted the unusually concentrated nature of the market as an important contributor to this underperformance, with ALW’s diversified portfolio not participating fully in all areas of AI-related momentum.
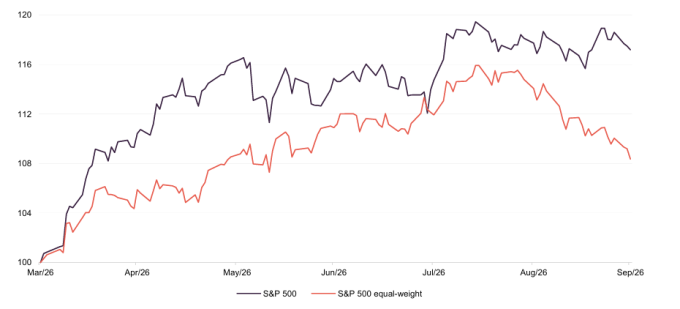
Within the US market, information technology’s year-to-date return to the end of September was 29.5%, ahead of most other sectors. In September, technology was one of only two US sectors to record a positive return during the month. The equal-weighted version of the S&P 500 fell even as the conventional, technology-heavy index appeared broadly resilient. This is illustrated in Figure 1, which shows the outperformance of the conventional index over the equal-weighted version over the past six months, as markets seemed to recover from their falls in the first quarter of the year.
Figure 1: US market six months to 30 September 2026, indices rebased to 100
Spending on AI infrastructure has continued to grow and companies supplying the computing power, semiconductors and data infrastructure required to support it appear to have experienced particularly strong demand. Other areas, such as power, may also have benefitted, but the effect appears less visible than it is for the technology sector.
This increased market concentration appears to have been challenging for ALW. The trust has exposure to companies that may benefit from AI – Microsoft, NVIDIA and Taiwan Semiconductor Manufacturing were all among its largest holdings at the end of August (see page 10) – but its approach has not sought to replicate the increasingly concentrated exposure of the index.
LW’s potential edge: opportunities beyond the market leaders?
WTW believes the market currently shows unusually wide divergence in valuations
WTW believes that beyond the headline strength of technology, the market is becoming increasingly differentiated, with unusually wide divergence in valuations and expectations potentially creating several distinct sources of return. WTW believes that some of the companies most closely associated with AI may continue to justify their valuations through rapid earnings growth, while others could struggle, with signs that investors are increasingly asking whether the levels of investment will be able to generate an adequate return. At the same time, businesses outside the immediate AI spotlight may have more scope to exceed expectations because expectations are lower.
ALW managers see three broad areas of AI opportunity
AI itself could become a broader source of returns, and ALW’s managers have identified three areas of opportunity. The first relates to the enablers – semiconductors, power generation and data centres – where the managers believe demand could remain strong if AI adoption continues to spread. ALW’s managers view AI as a potential next general-purpose technology and, while there may be pauses in demand while businesses assess their AI needs, and the return they are making on those investments, they believe adoption remains at an early stage and these structural trends could continue.
The second is companies that use AI to change their own economics. ALW’s managers say that adoption remains at a relatively early stage and, as businesses redesign workflows rather than simply adding AI tools to existing processes, there may be scope for lower costs, higher productivity and wider margins. There may also be demand for things that can’t currently be done or even envisaged, but could become possible with developments in AI.
The third opportunity comes from businesses where the market may have overestimated the potential for AI disruption. Companies with proprietary datasets, embedded customer relationships, brands or physical networks may be hard to displace in practice, and could themselves use AI to strengthen their businesses. Several ALW managers are looking for businesses where share prices appear to have derated amid expectations of substantial disruption from AI, but where they believe that the underlying franchise is considerably more resilient than the market currently appears to expect. One example is S&P Global, cited by ALW manager EdgePoint, where, according to EdgePoint, proprietary data provides protection against replication by an AI model, as it cannot be scraped off the internet.
The attention devoted to a relatively small number of mega-cap stocks appears to have left many smaller and mid-sized businesses comparatively overlooked. Another ALW manager, Vulcan, argues that some high-quality companies in this part of the market are trading at unusually depressed valuations because they sit outside the dominant AI narrative. One example is Equifax, a data, analytics and technology company, where, according to Vulcan, concerns about AI disruption have weighed on the shares despite the company’s extensive proprietary financial data and strong competitive position. Another is Ryan Specialty, a specialist insurance broker whose shares Vulcan believes have been unfairly penalised by a downturn in commercial property insurance pricing.
Meanwhile, GQG sees investment spending – both related to AI and more generally – broadening into industrials, utilities and financials, with earnings growth beginning to accelerate in areas beyond the technology giants.
ALW says its holdings are cheaper than the index despite having a higher ROE
Earlier this year, WTW calculated that its holdings were around 15% cheaper than the benchmark on conventional valuation measures, while having a 35% higher return on equity, 15% higher return on invested capital and around 30% less debt.
WTW also reported that the underlying fundamentals of ALW’s holdings had grown faster than those of the index, while their relative valuation multiples had compressed. That is to say, according to WTW, some of the recent relative underperformance reflected the market paying an increasingly high price for the winners in the index rather than deterioration in the businesses ALW owns. Figure 2 illustrates this using WTW’s fundamental return attribution tool, which is its means of breaking down the portfolio’s share price return between fundamental return, i.e. the growth in the underlying businesses, and multiple return, i.e. the change in the valuation.
Figure 2: Fundamental growth return of ALW’s companies versus the index, annualised, to 30 June 2026
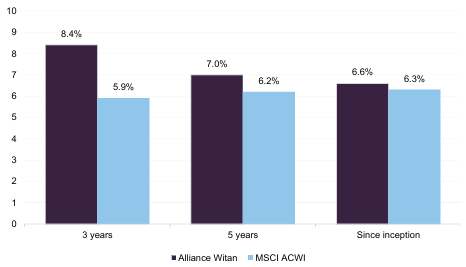
This combination of concentrated index leadership and dispersion between companies may give active stock selectors more to work with than a market in which everything is being valued similarly. If portfolio companies continue to increase earnings, cash flows and intrinsic value, share prices may ultimately reflect those increases even without a major change in market sentiment.
Further, if market leadership broadens, with investors becoming more selective about AI or companies receiving less investor attention providing evidence that disruption fears may have been overstated, some of the valuation gap could close as well.
Strategy review
WTW undertook a structured review of its investment approach
ALW’s continued underperformance prompted WTW, with the board’s support, to undertake a structured review of its investment approach. This covered underlying manager selection, their stock choices, portfolio construction and risk management, including the structure of the concentrated mandates given to each manager. The review examined whether the approach could be refined to improve shareholder outcomes in an increasingly concentrated market that appears to be influenced by momentum.
In September, WTW confirmed that the review was complete. Its conclusion was that ALW’s fundamental investment approach remained sound and could add significant value over the long term. However, it also suggested that market conditions had changed, with unusually high concentration in both individual stocks and investment themes becoming a defining feature. WTW also cited wider research suggesting that changes in market structure may have reduced market efficiency and increased the need for a broader investment toolkit.
WTW has introduced an additional risk model
One change already introduced is an additional risk model, intended to support WTW’s understanding of both absolute and benchmark-relative exposures. However, WTW has yet to specify what other additional tools or freedoms are being considered.
Asset allocation
WTW says that ALW’s asset allocation primarily reflects the stock selection decisions of its underlying managers. However, WTW retains discretion to adjust manager allocations with the aim of enhancing alpha generation or improving diversification. It says its standard practice is to allocate capital in a way that seeks to avoid any dominant stylistic biases within ALW’s portfolio, with the aim of keeping stock selection as the principal driver of performance
Figure 3: ALW asset allocation by region as at 31 August 2026
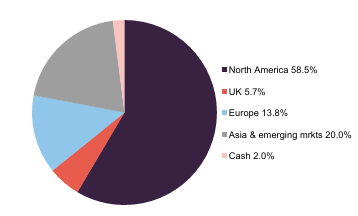
Figure 4: ALW stock portfolio asset allocation relative to benchmark as at 31 August 2026
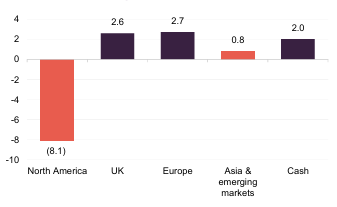
Since our last note in March (that used data as at 28 February 2026) the allocation to North America has risen slightly, although it remains a 8.1% underweight position against the benchmark. UK and Europe remain overweight positions, although in both cases by less than in February.
Looking at sector positioning, both the largest absolute weighting and the biggest overweight versus the benchmark remain financials. Information technology remains the largest underweight, and the size of this underweight has increased since the last note. The industrials and consumer discretionary weightings have both increased.
Figure 5: ALW asset allocation by sector as at 31 August 2026
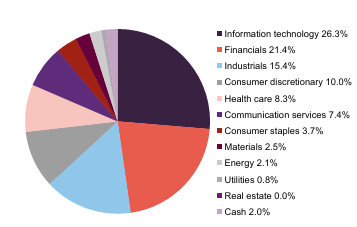
Figure 6: ALW stock portfolio asset allocation by sector relative to benchmark as at 31 August 2026
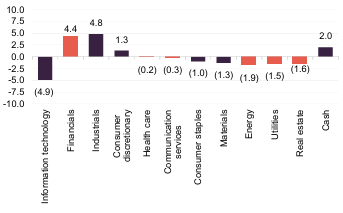
ALW’s portfolio had a 72% active share as ompared to 73% at end February).
The managers
Figure 7: Portfolio split by underlying manager 31 August 2026
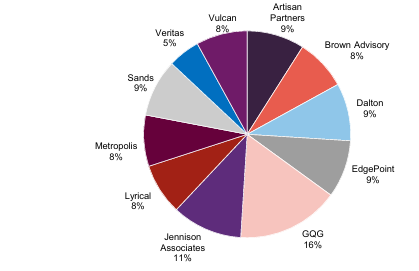
WTW says it looks beyond recent returns when selecting managers, focusing on whether it believes their skill and investment process could deliver sustained results. Its assessment considers how each manager identifies opportunities, constructs portfolios and controls risk.
There have been no sub-managers added or removed so far in 2026. However, WTW says that it has adjusted the allocations with the aim of countering the portfolio’s tilt towards lower-beta stocks.
Figure 8: Change in quarterly manager allocation to end June 2026
| 31 March 2025(%) | 30 June 2025(%) | 30 September 2025(%) | 31 December 2025(%) | 31 March 2026(%) | 30 June 2026(%) | |
|---|---|---|---|---|---|---|
| GQG (combined portfolio) | 19 | 19 | 17 | 17 | 18 | 16 |
| Sands | 5 | 5 | 6 | 6 | 6 | 9 |
| Lyrical | 6 | 7 | 7 | 7 | 8 | 9 |
| SGA | 10 | 11 | – | – | – | – |
| Veritas | 15 | 14 | 12 | 11 | 8 | 5 |
| Vulcan | 7 | 7 | 8 | 8 | 8 | 7 |
| Metropolis | 10 | 10 | 11 | 11 | 10 | 8 |
| Dalton | 6 | 6 | 6 | 6 | 7 | 8 |
| ARGA | 8 | 8 | – | – | – | – |
| Jennison Associates | 6 | 6 | 7 | 7 | 8 | 13 |
| EdgePoint | 8 | 7 | 8 | 8 | 9 | 8 |
| Artisan Partners | – | – | 8 | 9 | 9 | 9 |
| Brown Advisory | – | – | 10 | 10 | 9 | 8 |
Reducing Veritas, GQG and Metropolis
During 2025, the underlying managers’ stock choices – particularly GQG’s move towards more defensive companies – left ALW more underweight US large-cap technology and more exposed to established businesses that the stock pickers considered lower-risk and undervalued. WTW say that the combined effect was seemingly to have increased ALW’s underweight to US mega-cap technology and tilt the portfolio towards more defensive businesses, potentially limiting its participation in a market rally that appeared to be driven by the technology giants.
WTW responded by reducing allocations to Veritas, GQG and Metropolis. WTW believes this illustrates how individual managers’ investment decisions may collectively create a portfolio bias that it needs to address. By adjusting the capital allocated to each manager, WTW has attempted to moderate these aggregate exposures while leaving individual stock choices in the underlying managers’ hands.
Increasing Jennison, Sands, Lyrical and Vulcan
The capital released was used to increase allocations to Jennison, Sands, Lyrical and Vulcan. Although this was done to increase the portfolio’s sensitivity to market movements, the four managers appear to offer different sources of potential return.
Jennison appears to be the most growth-orientated of the four. It looks for what it considers to be market-leading companies with distinctive business models, strong competitive positions and growth rates that are accelerating or have reached an inflection point. The team is prepared to pay higher valuations where it believes growth can persist for a long period, but may sell when the investment case changes or it expects that growth to slow.
Sands is also a growth investor, but its emphasis appears to be more focused on long-term structural change. It seeks businesses that, in its view, are innovative and capable of sustaining above-average growth over many years, often because they are disrupting an existing industry, developing new products or expanding into large new markets. Its approach appears less dependent on identifying shorter-term changes in growth rates than Jennison’s and more focused on the durability of a company’s long-term opportunity.
Lyrical seems to provide a different exposure. Its US-focused value strategy starts by looking among the cheapest stocks in its investable universe, before trying to distinguish businesses it considers undervalued from companies whose low valuations it considers justified. It favours companies that it believes combine low valuations with reasonable quality and prospects for earnings growth. This offers ALW exposure to the potential re-rating of US businesses that Lyrical considers overlooked. This should be different sort of exposure that does not rely primarily on the market’s more highly valued growth companies.
Vulcan appears to sit somewhere between traditional value and quality investing. It looks for businesses that it considers to have durable competitive advantages, dependable free cash flow and relatively stable underlying values, then waits for their shares to trade at a discount it considers sufficient. Protecting against permanent losses of capital is central to its philosophy. As Vulcan tends to invest heavily in larger US companies, increasing its allocation also appears to have given WTW another way of raising ALW’s exposure to the US market while maintaining a valuation-focused approach.
Taken together, the changes suggest that WTW’s response to the performance issue was broader than just adding exposure to growth stocks or the AI theme. It has said that its intention was to increase the portfolio’s sensitivity to a rising market through managers spanning different approaches, while aiming to retain stock selection as as the principal driver of returns.
Top 10 holdings
ALW’s largest positions tend to be those that more than one of the underlying managers has picked for the portfolio. Two companies have moved out of the top 10 since we last published: Unilever and Philip Morris, which have been replaced by SAP and HCA Healthcare. The top 10 has become somewhat more concentrated in recent months, now representing just over a quarter of the total portfolio.
Figure 9: ALW’s 10 largest holdings as at 31 August 2026
| Holding | Sector | Country | 31 August 2026 (%) | 31 January 2026 (%) | Percentage point change |
|---|---|---|---|---|---|
| Microsoft | Information technology | United States | 4.1 | 3.4 | 0.7 |
| Taiwan Semiconductor | Information technology | Taiwan | 3.8 | 2.2 | 1.6 |
| Alphabet | Communication services | United States | 3.3 | 3.1 | 0.2 |
| Amazon | Consumer discretionary | United States | 3.0 | 2.3 | 0.7 |
| NVIDIA | Information technology | United States | 2.8 | 1.3 | 1.5 |
| Mastercard | Financials | United States | 2.6 | 1.9 | 0.7 |
| Samsung Electronics | Information technology | South Korea | 2.0 | 1.3 | 0.7 |
| Visa | Financials | United States | 1.6 | 1.5 | 0.1 |
| SAP | Information technology | Germany | 1.6 | 0.4 | 1.2 |
| HCA Healthcare | Health care | United States | 1.2 | 1.0 | 0.2 |
| Total of top 10 | 26.0 | 19.6 |
Performance
ALW appears to have held up well in 2022 and 2023 but then struggled
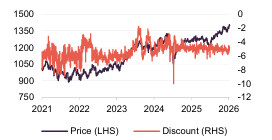
ALW appears to have held up relatively well during the market weakness of 2022 and recorded stronger performance in 2023, but its relative performance lagged from February 2024 while the rally in global equities became increasingly concentrated in a handful of US mega-cap technology stocks. It appears that this environment may have presented challenges for ALW’s diversified, multi-manager approach, with the portfolio unable to keep pace with an index that appears to be increasingly influenced by this relatively narrow group of companies. ALW’s short-term performance has seemingly improved recently – six-month returns are in line with the benchmark, with three-month returns ahead.
Figure 10: ALW NAV total return performance relative to benchmark over five years to 30 September 2026
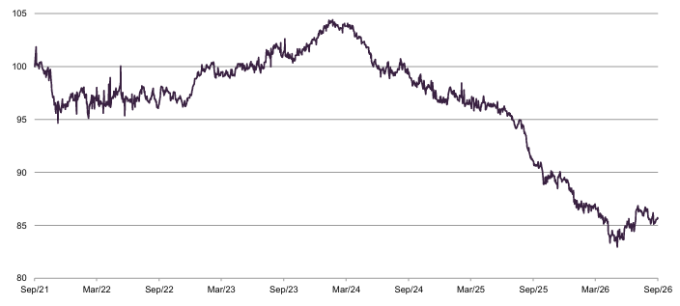
The rise in AI mega-cap stocks may help explain the peer group’s underperformance against the MSCI ACWI over five years. Figure 11 shows that ALW has performed ahead of its peers over this period.
Figure 11: Cumulative total return performance over periods ending 30 September 2026
| 3 months (%) | 6 months (%) | 1 year (%) | 3 years (%) | 5 years (%) | |
|---|---|---|---|---|---|
| ALW share price | 3.2 | 17.0 | 12.1 | 42.4 | 52.7 |
| ALW NAV | 2.6 | 16.4 | 11.3 | 40.1 | 50.3 |
| MSCI ACWI | 1.5 | 18.2 | 18.3 | 65.7 | 75.5 |
| Peer group median NAV1 | 2.3 | 16.1 | 11.3 | 48.6 | 36.9 |
| Peer group median share price | 3.2 | 16.2 | 11.9 | 55.5 | 36.6 |
Dividend
ALW pays quarterly dividends and is an AIC Dividend Hero
ALW’s total dividend for 2025 was 28.32p per share, a 6.1% increase on the previous year. The first two quarterly dividends for 2026 have both been set at 7.33p per share, compared with 7.08p for the corresponding payments in 2025, which suggests the trust is on course for a 60th consecutive annual dividend increase. The trust is designated as an AIC Dividend Hero.
ALW appears to be on course for its 60th consecutive annual dividend increase
The board believes that ALW should not, however, be viewed primarily as an income fund. Its objective is to deliver total returns through a combination of capital growth and a rising dividend, and the board expects the yield to remain around the 2% level.
Portfolio income does not currently cover the full distribution: revenue earnings were 18.5p per share in 2025 against the 28.32p dividend, with the difference made up from reserves. ALW had approximately £5.2bn of distributable reserves as at 30 June 2026, and the board has said it regards the current dividend policy as sustainable.
Premium/(discount)
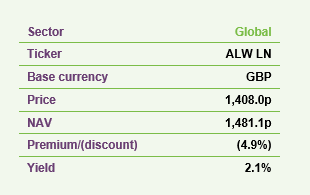
OveOver the 12 months ended 30 September 2026, ALW’s discount moved within a range of 6.4% to 4.1% and averaged 5.0%. As at 12 October 2026, ALW was trading at a 4.9% discount.
Figure 12: ALW premium/(discount) over five years to 30 September 2026
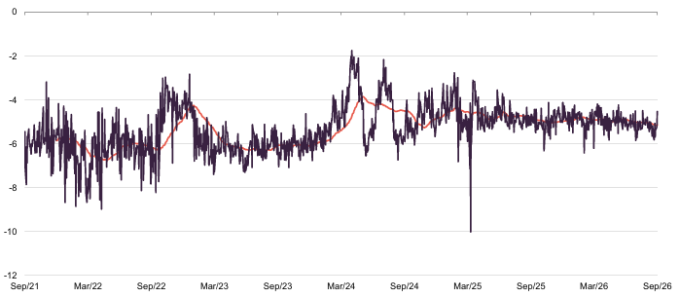
ALW’s board seeks to maintain a relatively stable discount, with 5% regarded as the level beyond which it would normally intervene through share buybacks. Although the latest annual report describes the objective more broadly as keeping the shares trading close to NAV, chair Dean Buckley reaffirmed the importance of the 5% level at the April 2026 AGM.
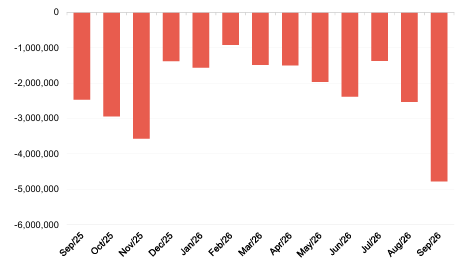
Figure 13 shows that buybacks declined in December from the levels earlier in 2025, and then remained at similar levels for some months. The figure for this September was higher.
Figure 13: ALW shares repurchased by month to 30 September 2026
Each year, the board asks shareholders for permission to buy back up to 14.99% of ALW’s issued ordinary share capital. Shares that are repurchased are held in treasur
Previous publications
Readers interested in further information about ALW may wish to read our previous notes (details are provided in Figure 14 below). You can read the notes by clicking on them in Figure 14 or by visiting our website.
Figure 14: QuotedData’s previously published notes on ALW
| Title | Note type | Published |
|---|---|---|
| A trust for all seasons | Initiation | 25 November 2020 |
| The fruits of diversification | Update | 04 August 2021 |
| Stability in troubled waters | Update | 17 November 2022 |
| Coming into its own | Annual overview | 16 November 2023 |
| A new powerhouse | Update | 19 September 2024 |
| A new giant for a new market reality | Annual overview | 12 August 2025 |
| Returns based more in reality than hope | Update | 12 March 2026 |
IMPORTANT INFORMATION
Marten & Co (which is authorised and regulated by the Financial Conduct Authority) was paid to produce this note on Alliance Witan Plc by Marten & Co,.
This note is for information purposes only and is not intended to encourage the reader to deal in the security or securities mentioned within it.Marten & Co is not authorised to give advice to retail clients. The research does not have regard to the specific investment objectives financial situation and needs of any specific person who may receive it.
The analysts who prepared this note are not constrained from dealing ahead of it but, in practice, and in accordance with our internal code of good conduct, will refrain from doing so for the period from which they first obtained the information necessary to prepare the note until one month after the note’s publication.
Nevertheless, they may have an interest in any of the securities mentioned within this note.
This note has been compiled from publicly available information. This note is not directed at any person in any jurisdiction where (by reason of that person’s nationality, residence or otherwise) the publication or availability of this note is prohibited.
Accuracy of Content: Whilst Marten & Co uses reasonable efforts to obtain information from sources which we believe to be reliable and to ensure that the information in this note is up to date and accurate, we make no representation or warranty that the information contained in this note is accurate, reliable or complete. The information contained in this note is provided by Marten & Co for personal use and information purposes generally. You are solely liable for any use you may make of this information. The information is inherently subject to change without notice and may become outdated. You, therefore, should verify any information obtained from this note before you use it.
No Advice: Nothing contained in this note constitutes or should be construed to constitute investment, legal, tax or other advice.
No Representation or Warranty: No representation, warranty or guarantee of any kind, express or implied is given by Marten & Co in respect of any information contained on this note.
Exclusion of Liability: To the fullest extent allowed by law, Marten & Co shall not be liable for any direct or indirect losses, damages, costs or expenses incurred or suffered by you arising out or in connection with the access to, use of or reliance on any information contained on this note. In no circumstance shall Marten & Co and its employees have any liability for consequential or special damages.
Governing Law and Jurisdiction: These terms and conditions and all matters connected with them, are governed by the laws of England and Wales and shall be subject to the exclusive jurisdiction of the English courts. If you access this note from outside the UK, you are responsible for ensuring compliance with any local laws relating to access.
No information contained in this note shall form the basis of, or be relied upon in connection with, any offer or commitment whatsoever in any jurisdiction.
Investment Performance Information: Please remember that past performance is not necessarily a guide to the future and that the value of shares and the income from them can go down as well as up. Exchange rates may also cause the value of underlying overseas investments to go down as well as up. Marten & Co may write on companies that use gearing in a number of forms that can increase volatility and, in some cases, to a complete loss of an investment.