
Returns based more in reality than hope
Alliance Witan (ALW) has released its 2025 annual results, showing returns below its benchmark, the MSCI All Countries World Index (MSCI ACWI). This note looks at the reasons for this underperformance. ALW’s manager, Willis Towers Watson (WTW), says markets are now too focused on short-term trends and momentum, with valuations rising for unprofitable companies based on hope, rather than strong business fundamentals. In contrast, ALW’s companies generally have stronger results than the wider market.
Since our last update, WTW has made two changes to the manager line-up, replacing SGA with Brown Advisory and Artisan with ARGA. We outline the reasons for these changes and the implications for ALW’s portfolio.
Recent weeks have brought new challenges for markets. WTW believes ALW’s diversified portfolio and focus on risk management will help it outperform when markets return to normal.
Global stock-picking portfolio
Alliance Witan aims to be a core equity holding for investors that delivers a real return (after adjusting for inflation) over the long term through a combination of capital growth and a rising dividend. It invests primarily in global equities across a range of industries and sectors via a “manager of managers” approach. This is intended to reduce the risk often taken by investors selecting a single “star” manager or one particular style that can move in and out of favour.
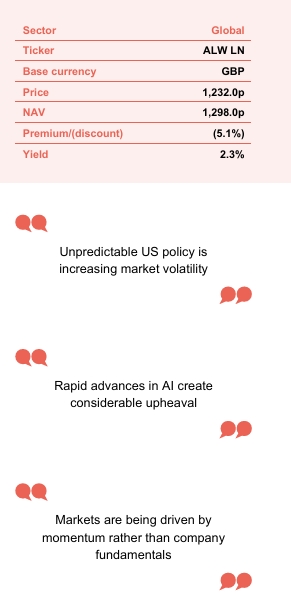
At a glance
Share price and discount
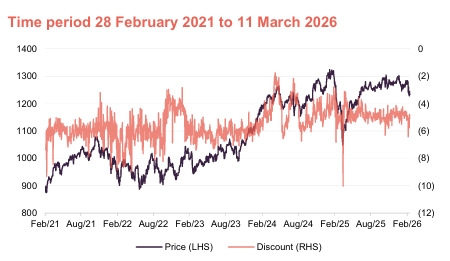
Over the 12 months ended 28 February 2026, ALW’s share price discount to net asset value (NAV) moved within a range of 10.0% to 3.0% and averaged 4.9%. As 11 March 2026, ALW was trading at a 5.1% discount.
ALW’s board aims to maintain a stable discount. To achieve this, the trust deploys share buybacks when necessary.
Performance over five years
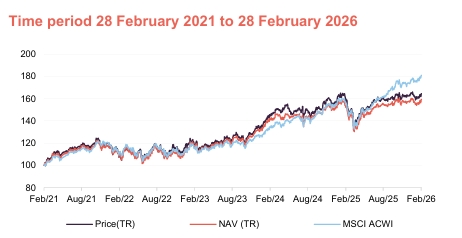
Relative to its performance benchmark, ALW’s good run of returns over 2022 and 2023 faltered in 2024, and its six-month numbers are particularly weak.
However, the rise of the AI mega caps has distorted index returns and WTW feels that markets have been driven more by momentum than fundamentals, and investors with short-term time horizons are dominating trading volumes.
| Year ended | Share price total return (%) | NAV total return (%) | MSCI All Countries World Index total return (%) |
|---|---|---|---|
| 28/02/2022 | 11.9 | 10.9 | 12.3 |
| 28/02/2023 | 6.3 | 4.5 | 1.7 |
| 29/02/2024 | 21.7 | 22.4 | 17.9 |
| 28/02/2025 | 9.1 | 7.9 | 15.6 |
| 28/02/2026 | 4.2 | 4.0 | 16.3 |
Fund profile
“a core equity holding for investors that delivers a real return over the long term”
Alliance Witan Trust (ALW) aims to be a core investment for retail investors, private clients, and institutions, seeking long-term real returns through capital growth and a rising dividend.
Manager Willis Towers Watson (WTW) has selected 11 specialist stock pickers, each running a global portfolio of 10–20 top ideas. GQG Partners also manages a more diversified emerging market portfolio with around 60 stocks, alongside its global portfolio. WTW combines these portfolios to balance ALW’s exposure across regions, sectors, and investment styles, with the aim that stock selection drives returns.
Craig Baker, WTW’s chief investment strategist, leads ALW’s portfolio and chairs the investment committee, which includes Stuart Gray and Mark Davis. They are supported by eight portfolio management associates and a global research team of about 160.
The trust uses the MSCI All Countries World Index (MSCI ACWI) in sterling as its benchmark, though index weightings do not influence stock selection.
ALW, formerly Alliance Trust, dates back to 1888. The current “manager of managers” model began in April 2017. ALW is an AIC Dividend Hero, having raised its dividend for 59 consecutive years.
Long-term performance driven by fundamentals
Figure 1: Analysis of the components of ALW’s returns versus its performance benchmark
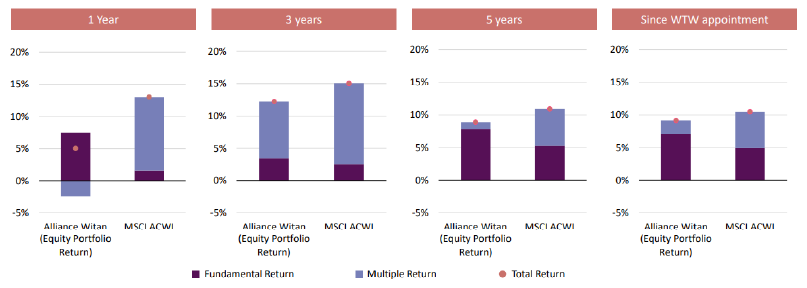
ALW’s returns are based far more in reality than hope than those of the wider market
ALW included Figure 1 in its annual results to show how its returns and those of its benchmark are split between gains from business fundamentals (like revenues and profits) and gains from changes in valuation multiples. The chart suggests ALW’s returns are more grounded in actual business performance than those of the broader market.
Market backdrop
Unpredictable US policy is increasing market volatility
The macroeconomic outlook is increasingly uncertain, and this is increasing market volatility. Much of this emanates from the White House, whether it be the twists and turns of tariff policies, the One Big Beautiful Bill and the ever-expanding deficit, wavering support for Ukraine and NATO, military action in Venezuela and now Iran, plans to seize Greenland, threats against the Federal Reserve, backtracking on climate change, DOGE, or ICE … the list goes on.
Rapid advances in AI create considerable upheaval
Rapid progress in AI is also causing disruption, with large investments, higher energy costs, and challenges to many business models, especially in the Software-as-a-Service sector.
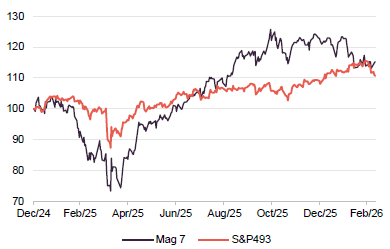
Earlier in 2025, markets were shaken by DeepSeek’s AI advances and “Liberation Day”. US mega-cap AI companies were initially hit but rebounded when Trump reversed his tariff plans. Figure 2 shows the impact on the Magnificent Seven compared to the rest of the S&P 500.
Figure 2: MSCI ACWI (in sterling) since 1 January 2025
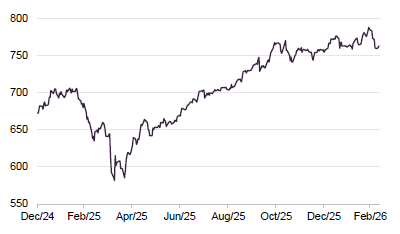
Figure 3: Mag 7 and S&P493
These developments, along with Trump’s calls for a weaker US dollar, have led investors to start diversifying away from the US.
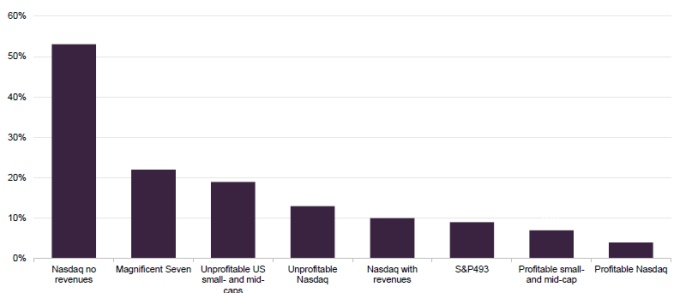
WTW notes that, despite increased market uncertainty which would usually lead investors to seek higher risk premiums, investors have instead shown risk-seeking behaviour. This is clear in Figure 13 on page 10 and has played a key role in ALW’s relative returns, at least until the recent conflict with Iran.
Asset allocation
ALW’s asset allocation mainly reflects the stock choices of its underlying managers, but Willis Towers Watson can adjust these allocations to boost returns or improve diversification. The aim is to avoid any strong style bias, ensuring stock selection remains the main performance driver. In Figures 5 and 7, ALW’s weightings have been adjusted to exclude cash in stock pickers’ portfolios for a fair comparison.
Figure 4: ALW asset allocation by region as at 28 February 2026
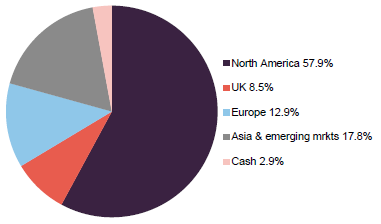
Figure 5: ALW stock portfolio asset allocation relative to benchmark as at 28 February 2026
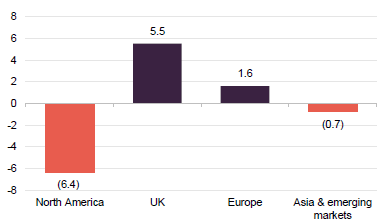
ALW remains underweight in North America compared to the MSCI ACWI, and overweight in the UK. This likely reflects the valuation gap between North American and UK companies. Since our last update, which used portfolio data as at 30 June 2025, ALW’s UK overweight has grown slightly, mainly at the expense of its exposure to Europe and Asia & emerging markets.
Figure 6: ALW asset allocation by sector as at 31 January 2026
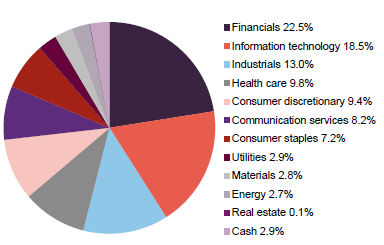
Figure 7: ALW stock portfolio asset allocation by sector relative to benchmark as at 31 January 2026
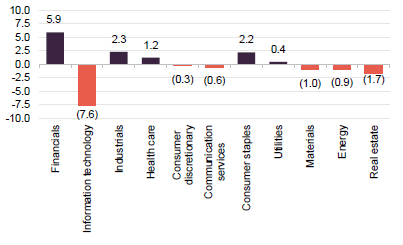
Sector-wise, ALW is most overweight in financials and underweight in information technology relative to MSCI ACWI. Since June 2025, ALW’s weightings to financials and consumer staples have increased, while its weightings in information technology and industrials have reduced.
ALW’s portfolio had a 73% active share at the end of February 2026, down slightly from 74% in June 2025. WTW’s analysis shows the portfolio has a beta of 0.80 compared to the benchmark.
The managers
Figure 8: Portfolio split by underlying manager 28 February 2026
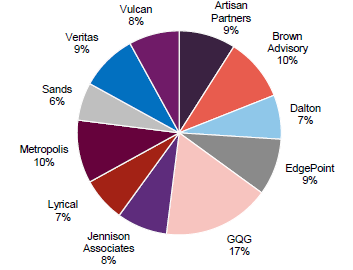
Since our last note, Artisan Partners and Brown Advisory have joined as sub-managers, replacing ARGA and SGA. WTW selects managers based on their skill, their ability to repeat past successes, and a thorough understanding of their investment philosophy, approach, process, and risk controls, rather than short-term performance.
Replacing SGA with Brown Advisory
SGA had been an underlying manager for ALW’s portfolio since 2017, contributing positively for several years but more recently holding back returns. WTW attributes this to both SGA’s investment style and some stock selection errors. SGA thrived under its original founders from the 1990s, but leadership has now passed to a new team. WTW notes that a change in leadership alone is not a reason to replace a manager, especially as the new team is experienced, but it did prompt a thorough review.
WTW ultimately decided that Brown Advisory, with a similar investment style, was a better fit. Brown Advisory is already known for managing Brown Advisory US Smaller Companies and recently acquired Marylebone Partners, manager of Majedie Investment Trust. The firm credits its success to “thoughtful investing,” meaning deep, fundamental research to fully understand the businesses and managers it invests in. It builds focused, low-turnover portfolios.
ALW now has access to Brown Advisory’s Global Leaders team, led by Mick Dillon and Bertie Thomson, supported by the wider firm’s considerable analytical resources. Mick joined in 2014 from HSBC, where he co-led Asian equities, and previously managed global and technology strategies in London. Bertie joined in 2015 after 13 years at Aberdeen Asset Management as a senior pan-European equity manager.
The team believes that high-quality companies with strong leadership, high returns on invested capital (at least 20%), and a focus on delivering for customers can generate strong shareholder returns. They aim to buy these companies at a discount and hold them for at least five years, investing globally for diversification.
A key part of their approach is understanding how businesses serve their customers, as they see customer satisfaction as central to success. Analysts regularly speak with customers to assess a firm’s competitive position. While quality-focused managers may pay a premium for strong businesses, Brown Advisory emphasises the need to avoid overpaying, even for quality.
Behavioural economics, including ideas such as risk aversion and loss aversion, guides how the team decides position sizes and when to buy or sell. They also work with a coach to improve decision-making and investment results.
In summary, the Brown Advisory team seeks high-quality businesses with strong returns, proven management, and entry prices that can deliver double-digit annual returns.
Replacing ARGA with Artisan Partners
ARGA was added to the manager line-up only recently, and usually firms stay in the portfolio longer. However, ongoing checks by the WTW team raised a concern (with no impact on ALW), leading to ARGA being replaced by Artisan Partners (Artisan).
Artisan has 11 investment teams and gives them freedom to make decisions without being tied to benchmarks or committees. Investment staff focus on picking stocks, supported by a business team, and are encouraged to invest their own money in the strategy, aligning their interests with clients.
ALW’s Artisan portfolio is managed by the Global Value Team, led by co-founder Dan O’Keefe and co-manager Michael McKinnon. Dan has 30 years’ experience using the same investment approach and previously worked at Harris Associates, BancAmerica Securities, and Morningstar. Michael joined in 2010, after roles at Legg Mason, Himalaya Capital, and Arthur Andersen.
All team members, including Dan and Michael, analyse stocks. WTW describes them as detail-focused, long-term investors who look for undervalued quality and growth potential.
Value investing can fall into the trap of buying cheap stocks that remain cheap, known as value traps. Artisan aims to avoid this by focusing on both a company’s growth prospects and its valuation. They look for strong, resilient businesses with good management, aligned with investors, and solid finances.
Top 10 holdings
ALW’s largest positions are often those that have been chosen by more than one underlying manager. Since our last report using data from June 2025, Meta Platforms, Netflix, Diageo, UnitedHealth Group, and ServiceNow have left the top 10. They have been replaced by Alphabet, Mastercard, Unilever, Philip Morris, and Samsung Electronics.
Figure 10: ALW’s 10 largest holdings as at 31 January 2026
| Holding | Sector | Country | 31 January 2026 (%) | 30 June 2025 (%) | Percentage point change |
|---|---|---|---|---|---|
| Microsoft | Information technology | United States | 3.4 | 5.0 | (1.6) |
| Alphabet | Communication services | United States | 3.1 | 1.3 | 1.8 |
| Amazon | Consumer discretionary | United States | 2.3 | 2.6 | (0.3) |
| Taiwan Semiconductor | Information technology | Taiwan | 2.2 | 1.9 | 0.3 |
| Mastercard | Financials | United States | 1.9 | 1.2 | 0.7 |
| Visa | Financials | United States | 1.5 | 1.8 | (0.3) |
| Unilever | Consumer staples | United Kingdom | 1.3 | 1.1 | 0.2 |
| Philip Morris | Consumer staples | United States | 1.3 | 1.2 | 0.1 |
| NVIDIA | Information technology | United States | 1.3 | 1.7 | (0.4) |
| Samsung Electronics | Information technology | South Korea | 1.3 | 0.7 | 0.6 |
| Total of top 10 | 19.6 | 20.3 |
Performance
Figure 11: ALW NAV total return performance relative to benchmark over five years to 28 February 2026
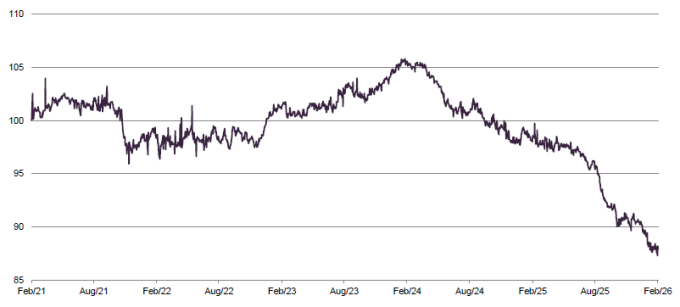
ALW performed well against its benchmark in 2022 and 2023, but this strong run ended in 2024, with particularly weak results over the past six months.
The strong performance of large AI companies has skewed index returns, causing the peer group to lag behind the MSCI ACWI over five years. However, ALW’s long-term results are still ahead of its peers.
Figure 12: Cumulative total return performance over periods ending 28 February 2026
| 3 months (%) | 6 months (%) | 1 year (%) | 3 years (%) | 5 years (%) | |
|---|---|---|---|---|---|
| ALW share price | 0.4 | 3.2 | 4.2 | 38.4 | 64.6 |
| ALW NAV | 0.5 | 3.0 | 4.0 | 37.4 | 59.2 |
| MSCI ACWI | 3.9 | 12.2 | 16.3 | 58.5 | 81.0 |
| Peer group median NAV1 | 2.9 | 6.5 | 12.1 | 42.5 | 52.9 |
| Peer group median share price | 4.6 | 5.6 | 14.1 | 44.4 | 45.3 |
WTW calls ALW’s recent underperformance against the MSCI ACWI “frustrating”. They believe this is mainly due to markets being driven by momentum rather than company fundamentals. Short-term investors are dominating trading, and retail investors are following current market trends in their view. Figure 13, sourced from Alliance Witan, shows this trend in the US market.
Figure 13: Signs of speculative behaviour in the US – average performance of companies in each category, returns over 2025 in USD
Drivers of ALW’s returns over 2025
As expected, stock selection drove ALW’s returns over 2025
Analysis of ALW’s 2025 returns from WTW shows that the underperformance of the benchmark was mainly due to poor stock selection, which reduced returns by 8.9 percentage points. Asset allocation had a small positive effect, adding 0.1%.
Dalton Investments was the top-performing manager, with Artisan also doing well. In contrast, GQG, Veritas, Jennison, Sands Capital, and Vulcan had weaker results.
On a stock level, ALW benefited from having less exposure to Apple (seen as lagging in AI and hit by tariffs), and more exposure to Ryanair (growing passenger numbers and share buybacks), Safran (benefiting from higher defence spending), TSMC (driven by AI demand for chips), and NRG Energy (boosted by AI’s demand for power). These five positions added 1.6% to relative returns.
The main negatives were higher holdings in Diageo (weak revenue) and ICON (weak results due to clinical trial delays and an accounting investigation), and lower holdings in NVIDIA, Broadcom, and Alphabet (all strong AI performers). Together, these five positions reduced ALW’s relative performance by 2.4%.
Premium/(discount)
Figure 14: ALW discount over five years
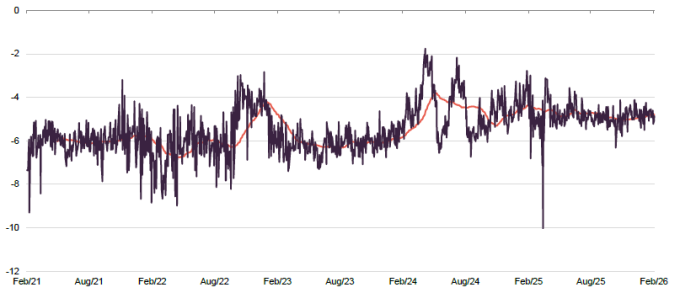
Over the 12 months to 28 February 2026, ALW’s discount to NAV ranged from 10.0% to 3.0%, averaging 4.9%. On 11 March 2026, the discount was 5.1%. The board aims to keep the discount stable, using share buybacks when needed.
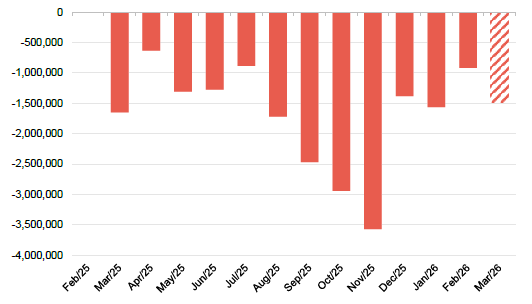
The discount has mostly stayed within a narrow range. However, Figure 14 shows a spike following sharp market falls after tariff announcements in April 2025. Figure 15 shows buybacks increased after this, peaking in November, before slowing again more recently.
Each year, the board seeks shareholder approval to buy back up to 14.99% of ALW’s ordinary shares. Any repurchased shares are held in treasury.
Figure 15: ALW shares repurchased by month to 11 March 2026
SWOT analysis
Figure 16: SWOT analysis for ALW
| Strengths | Weaknesses |
|---|---|
| Access to some of the world’s best managers and their best ideas | Avoiding style, sector, and regional biases could translate into underperformance when those factors are driving markets |
| One of the longest records of increasing dividends every year | Unlikely to keep pace in markets driven by a narrow group of stocks |
| Strict discount control, comparably deep liquidity, and low average running costs thanks to its size | Medium-term returns lag peers and benchmark |
| Opportunities | Threats |
| Balance of style, sector, and regional exposure means ALW should fare relatively well in periods where market leadership changes | Competition from passive index-tracking vehicles |
| Discount control policy makes it look more expensive than peers |
Bull vs bear case
Figure 17: Bull vs bear case for ALW
| Aspect | Bull case | Bear case |
|---|---|---|
| Performance | A more fundamentally-driven market could see a return to form | The AI trade accelerates, leaving ALW further behind |
| Dividends | Progressive dividend policy and multi-decade dividend hero status | None |
| Outlook | Current market volatility associated with the war in Iran may drive out more speculative investors to the benefit of ALW’s investment approach | AI disintermediation undermines the business case for stocks that were previously seen as quality plays |
| Discount | N/A – strict discount control is working | N/A – strict discount control is working |
Previous publications
Readers interested in further information about ALW may wish to read our previous notes (details are provided in Figure 18 below). You can read the notes by clicking on them in Figure 18 or by visiting our website.
Figure 18: QuotedData’s previously published notes on ALW
| Title | Note type | Published |
|---|---|---|
| A trust for all seasons | Initiation | 25 November 2020 |
| The fruits of diversification | Update | 04 August 2021 |
| Stability in troubled waters | Update | 17 November 2022 |
| Coming into its own | Annual overview | 16 November 2023 |
| A new powerhouse | Update | 19 September 2024 |
| A new giant for a new market reality | Annual overview | 12 August 2025 |
Important Information
Marten & Co (which is authorised and regulated by the Financial Conduct Authority) was paid to produce this note on Alliance Witan Plc.
This note is for information purposes only and is not intended to encourage the reader to deal in the security or securities mentioned within it. Marten & Co is not authorised to give advice to retail clients. The research does not have regard to the specific investment objectives financial situation and needs of any specific person who may receive it.
The analysts who prepared this note are not constrained from dealing ahead of it but, in practice, and in accordance with our internal code of good conduct, will refrain from doing so for the period from which they first obtained the information necessary to prepare the note until one month after the note’s publication. Nevertheless, they may have an interest in any of the securities mentioned within this note.
This note has been compiled from publicly available information. This note is not directed at any person in any jurisdiction where (by reason of that person’s nationality, residence or otherwise) the publication or availability of this note is prohibited.
Accuracy of Content: Whilst Marten & Co uses reasonable efforts to obtain information from sources which we believe to be reliable and to ensure that the information in this note is up to date and accurate, we make no representation or warranty that the information contained in this note is accurate, reliable or complete. The information contained in this note is provided by Marten & Co for personal use and information purposes generally. You are solely liable for any use you may make of this information. The information is inherently subject to change without notice and may become outdated. You, therefore, should verify any information obtained from this note before you use it.
No Advice: Nothing contained in this note constitutes or should be construed to constitute investment, legal, tax or other advice.
No Representation or Warranty: No representation, warranty or guarantee of any kind, express or implied is given by Marten & Co in respect of any information contained on this note.
Exclusion of Liability: To the fullest extent allowed by law, Marten & Co shall not be liable for any direct or indirect losses, damages, costs or expenses incurred or suffered by you arising out or in connection with the access to, use of or reliance on any information contained on this note. In no circumstance shall Marten & Co and its employees have any liability for consequential or special damages.
Governing Law and Jurisdiction: These terms and conditions and all matters connected with them, are governed by the laws of England and Wales and shall be subject to the exclusive jurisdiction of the English courts. If you access this note from outside the UK, you are responsible for ensuring compliance with any local laws relating to access.
No information contained in this note shall form the basis of, or be relied upon in connection with, any offer or commitment whatsoever in any jurisdiction.
Investment Performance Information: Please remember that past performance is not necessarily a guide to the future and that the value of shares and the income from them can go down as well as up. Exchange rates may also cause the value of underlying overseas investments to go down as well as up. Marten & Co may write on companies that use gearing in a number of forms that can increase volatility and, in some cases, to a complete loss of an investment.