
Returns based more in reality than hope
Alliance Witan (ALW) has just announced its annual results for 2025, over which its returns lagged those of its benchmark, the MSCI All Countries World Index (MSCI ACWI). In this note, we examine the reasons behind that underperformance. Chief amongst them, according to ALW’s manager Willis Towers Watson (WTW), is that markets have become too short-term-focused, momentum-driven, and detached from underlying fundamentals. On average, the results of ALW’s companies are much stronger than the wider market, but valuations of unprofitable and even revenue-less companies are rising on hope value.
WTW made two changes to the manager line-up since we last published, replacing SGA for Brown Advisory and Artisan for ARGA. We also explain the rationale and what this means for ALW’s portfolio.
The past few weeks have brought new challenges for markets. WTW believes that ALW’s diversified portfolio and emphasis on risk management positions it to outperform when markets normalise.
Global stock-picking portfolio
Alliance Witan aims to be a core equity holding for investors that delivers a real return (after adjusting for inflation) over the long term through a combination of capital growth and a rising dividend. It invests primarily in global equities across a range of industries and sectors via a “manager of managers” approach. This is intended to reduce the risk often taken by investors selecting a single “star” manager or one particular style that can move in and out of favour.
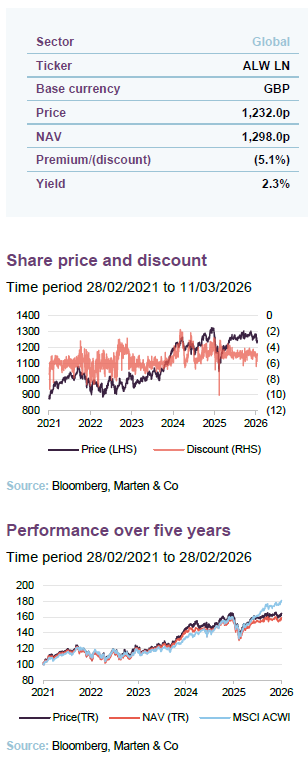
| Year ended | Share price total return (%) | NAV total return (%) | MSCI ACWI total return (%) |
|---|---|---|---|
| 28/02/2022 | 11.9 | 10.9 | 12.3 |
| 28/02/2023 | 6.3 | 4.5 | 1.7 |
| 29/02/2024 | 21.7 | 22.4 | 17.9 |
| 28/02/2025 | 9.1 | 7.9 | 15.6 |
| 28/02/2026 | 4.2 | 4.0 | 16.3 |
Fund profile
“a core equity holding for investors that delivers a real return over the long term”
Alliance Witan Trust (ALW) aims to be a core investment for retail investors, professionally advised private clients, and institutions, delivering a real return over the long term, through a combination of capital growth and a rising dividend.
Manager Willis Towers Watson (WTW) has carefully selected 11 expert stock pickers. Each of these manages a global portfolio of 10–20 of their best ideas. In addition, GQG Partners also manages a more diversified emerging market portfolio, with around 60 stocks alongside its global portfolio.
WTW blends these into a portfolio, allocating capital in a way that seeks to balance ALW’s exposures across geographies, sectors, and styles, while emphasising the impact of stock selection on the trust’s returns.
WTW’s chief investment strategist, Craig Baker, is the lead manager on ALW’s portfolio. He chairs the investment committee, which also includes Stuart Gray and Mark Davis. They are supported by eight portfolio management team associates working on ALW. In addition, they benefit from an extensive global research team of around 160 global research associates.
For performance measurement purposes, the trust is benchmarked against the MSCI All Countries World Index in sterling terms (MSCI ACWI), but index weightings have no bearing on stock selection decisions.
ALW (as Alliance Trust) has a long history dating back to 1888. The “manager of managers” approach under WTW was adopted with effect from 1 April 2017. ALW is an AIC Dividend Hero, having increased its dividend in each of its last 59 financial years.
Long-term performance driven by fundamentals
Figure 1: Analysis of the components of ALW’s returns versus its performance benchmark
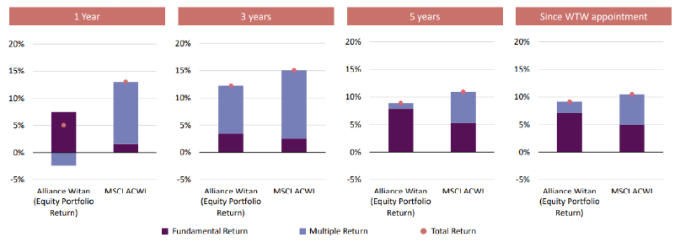
ALW’s returns are based far more in reality than hope than those of the wider market
ALW included the chart in Figure 1 in its annual results presentation. This aims to break down the returns of ALW and its benchmark into gains/losses driven by changes in fundamentals (revenues and profits, for example) and those driven by changes in valuation multiples. The analysis suggests that ALW’s returns are based far more in reality than hope than those of the wider market.
Market backdrop
Unpredictable US policy is increasing market volatility
The macroeconomic outlook is increasingly uncertain, and this is increasing market volatility. Much of this emanates from the White House, whether it be the twists and turns of tariff policies, the One Big Beautiful Bill and the ever-expanding deficit, wavering support for Ukraine and NATO, military action in Venezuela and now Iran, plans to seize Greenland, threats against the Federal Reserve, backtracking on climate change, DOGE, or ICE … the list goes on.
Rapid advances in AI create considerable upheaval
Added to this is considerable upheaval created by the rapid advances in AI. These include vast capital expenditure, rising power prices, and threats to the business models of a swathe of companies, but especially those in the Software-as-a-Service sector.
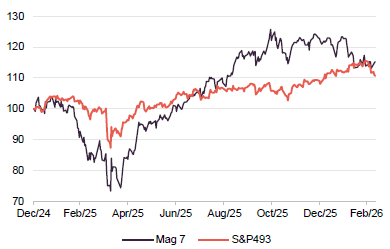
In the early part of 2025, as we discussed in our last note, markets were hit by the advances made by DeepSeek’s AI model and then “Liberation Day”. US mega-cap AI-related companies were hit by both events, but recovered sharply when Trump backtracked on his initial tariff proposals. That is evident in Figure 2, which contrasts the returns of the so-called Magnificent Seven and the other 493 constituents of the S&P500 Index.
Figure 2: MSCI ACWI (in sterling) since 1 January 2025
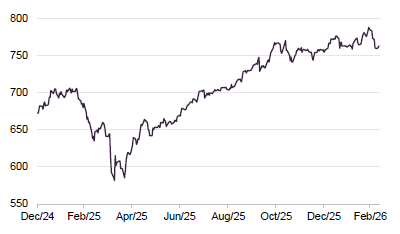
Figure 3: Mag 7 and S&P493
These events and Trump’s actions since – notably, his repeated assertion that he would like to see the dollar weaken – appear to have encouraged investors to start to diversify their portfolios away from the US.
WTW observes that a rational response to the increased uncertainty in markets would normally be for investors to demand a higher risk premium. However, at least up until the outbreak of war with Iran, investors have displayed risk-seeking behaviour. That is evident in Figure 13 on page 10, and has been a significant factor in ALW’s relative returns.
Asset allocation
ALW’s asset allocation is primarily determined by the stock selection decisions of its underlying managers. However, Willis Towers Watson retains discretion to adjust manager allocations to either enhance alpha generation or improve diversification. Its standard practice is to allocate capital in a way that avoids any dominant stylistic biases within ALW’s portfolio, positioning it so that stock selection should remain the principal driver of performance.
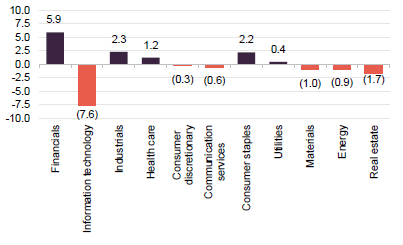
In Figures 5 and 7 we have adjusted ALW’s weightings to exclude cash held within stock pickers’ portfolios, so as to compare like with like.
Figure 4: ALW asset allocation by region as at 28 February 2026
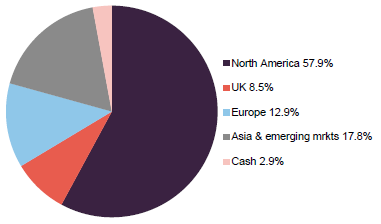
Figure 5: ALW stock portfolio asset allocation relative to benchmark as at 28 February 2026
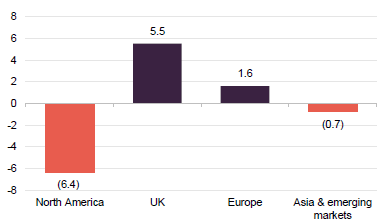
On a regional basis, ALW had a notable underweight exposure to North America relative to MSCI ACWI and overweight exposure the UK. This likely that this reflects the considerable valuation gap between companies in North America and those in the UK. Since we last published on ALW, using data as at 30 June 2025, ALW’s overweight to the UK has increased slightly, largely at the expense of its allocations to Europe and Asia & emerging markets.
Looking at ALW’s sectoral biases, the most notable overweight relative to MSCI ACWI is in financials and that corresponds to an underweight in information technology. The most significant shift since end June 2025 is an increase in the financials and consumer staples weightings at the expense of information technology and industrials.
Figure 6: ALW asset allocation by sector as at 31 January 2026
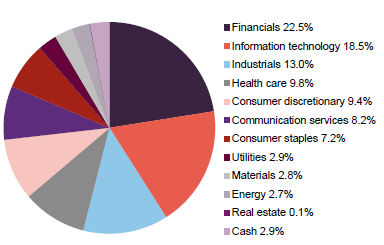
Figure 7: ALW stock portfolio asset allocation by sector relative to benchmark as at 31 January 2026
ALW’s portfolio had a 73% active share as of end February 2026 (74% at end June 2025), and based on WTW’s analysis, the portfolio has a beta of 0.80 to the benchmark.
The managers
Figure 8: Portfolio split by underlying manager 28 February 2026
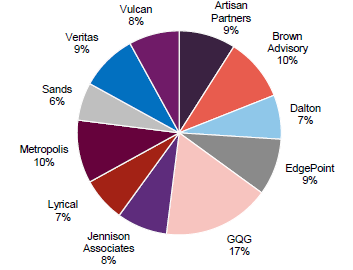
Since our last note, two sub-managers have been added: Artisan Partners and Brown Advisory. They replaced ARGA and SGA, respectively. WTW’s manager selection decisions are not influenced by short-term performance, but rather on an assessment of manager skill, repeatability of past success, and a deep understanding of investment philosophy, approach, process, and risk controls. Changes to the line-up reflect a change of WTW’s view on the manager’s ability to add value relative to peers.
Replacing SGA with Brown Advisory
SGA had been picking stocks for ALW’s portfolio since 2017. It made a useful contribution to ALW’s returns for many years but had been a drag on returns in recent years. WTW says that this partly reflects SGA’s investment style, but also some stock selection mistakes.
The firm prospered from the 1990s under the leadership of its three original founders, who have now handed over the baton to a new generation of investment managers. WTW says that a change of leadership at a firm is not necessarily a reason to replace a manager, and notes that the new managers also have long experience of markets. However, the change did require a careful review.
In the event, WTW concluded that Brown Advisory, which has a similar style, offered a better proposition.
Readers may already be familiar with Brown Advisory as the manager of Brown Advisory US Smaller Companies and its recent acquisition of Marylebone Partners, manager of Majedie Investment Trust.
Brown Advisory: thoughtful investors
The firm says that the secret to its success is “thoughtful investing”, which it describes as “a dedication to rigorous, fundamental research to gain a deep understanding of the businesses, issuers and managers in which we invest”. It aims to build low-turnover, concentrated portfolios.
ALW has secured access to the best ideas of Brown Advisory’s Global Leaders team, which is led by Mick Dillon and Bertie Thomson, but draws on the considerable analytical resources of the wider firm. Mick joined the firm in 2014 from HSBC in Hong Kong, where he co-headed Asian equities, and earlier worked in London managing global and technology strategies. Bertie joined the firm in 2015 after 13 years at Aberdeen Asset Management, where he was a senior investment manager in its pan-European equity team.
The team’s philosophy is that high-quality companies that deliver superior outcomes for their customers and have strong leadership positions and high (typically at least 20%) return on invested capital (ROIC) can generate outstanding shareholder returns for investors. It looks to purchase these companies at discounts to their intrinsic value and evaluates companies over at least a five-year view. Investing globally gives it the freedom to build diversified portfolios of companies that benefit from a wide variety of drivers.
The emphasis on understanding a business’s relationships with its customers stems from the belief that customers are the ultimate arbiters of who succeeds in the marketplace. The team therefore wants to find businesses that can offer unique solutions to meet a customer’s needs. To gain that insight, Brown Advisory analysts regularly speak directly to customers and gather feedback to better understand a firm’s competitive position.
Quality-focused investment managers will often pay a premium for businesses, justifying this on the basis of their growth prospects and the sustainability of their returns. However, the Brown Advisory team stresses the importance of not overpaying for quality.
Behavioural economics (thinking about things such as risk aversion and loss aversion) is used to help inform position sizes and the timing of purchases and sales; the team works with a coach (just as a sports team would) to help improve decision-making and investment outcomes.
In summary, then, the Brown Advisory team is looking for high-quality franchises, with numerically superior returns, management teams with good track records, and entry points at valuations that offer double-digit annualised returns.
Replacing ARGA with Artisan Partners
ARGA was a relatively recent addition to the manager line-up, and in most instances, firms would normally remain in the portfolio for longer. However, ongoing due diligence carried out by the WTW team raised a concern (which had no impact on ALW) and the decision was made to replace ARGA with Artisan Partners (Artisan).
Artisan has 11 distinct investment teams under its umbrella. It empowers its teams to make investment decisions free from constraints of benchmarks, bureaucracy, and the need secure approval by committees. With the support of a business management team, investment personnel are allowed to focus on their core role of picking stocks. Team members are encouraged to invest their own money in the strategy, to ensure that their interests are aligned with those of their clients.
ALW’s Artisan portfolio is being run by its Global Value Team. The six-strong team is led by its co-founder, Dan O’Keefe, and he is supported by co-manager Michael McKinnon. Before joining Artisan, Dan was an analyst at Harris Associates, BancAmerica Securities, and Morningstar. He has 30 years of experience of investing using the same philosophy that he applies to picking stocks for ALW. Michael joined the team in 2010, having previously worked at Legg Mason, Himalaya Capital, and Arthur Andersen.
Every member of the team, including Dan and Michael, is involved with analysing stocks. WTW says that they are detail-focused, long-term thinkers, looking for underappreciated quality and upside to intrinsic value.
A potential pitfall of value investing is that you buy cheap stocks that turn out to be cheap for very good reasons – so-called value traps. Artisan seeks to avoid this by focusing as much on a company’s growth potential as its valuation.
To achieve that, Artisan looks for strong, durable businesses that can thrive regardless of where we are in the economic cycle. These companies must be run by good-quality management teams that are aligned with investors, and they must be financially robust.
Top 10 holdings
ALW’s largest positions are often those that more than one of the underlying managers has picked for the portfolio. Five companies have moved out of the top 10 since we last published using data as at the end of June 2025. They are Meta Platforms, Netflix, Diageo, UnitedHealth Group, and ServiceNow.
Replacing them are Alphabet, Mastercard, Unilever, Philip Morris, and Samsung Electronics.
Figure 9: Manager style
| Holding | Sector | Country | 31 January 2026 (%) | 30 June 2025 (%) | Percentage point change |
|---|---|---|---|---|---|
| Microsoft | Information technology | United States | 3.4 | 5.0 | (1.6) |
| Alphabet | Communication services | United States | 3.1 | 1.3 | 1.8 |
| Amazon | Consumer discretionary | United States | 2.3 | 2.6 | (0.3) |
| Taiwan Semiconductor | Information technology | Taiwan | 2.2 | 1.9 | 0.3 |
| Mastercard | Financials | United States | 1.9 | 1.2 | 0.7 |
| Visa | Financials | United States | 1.5 | 1.8 | (0.3) |
| Unilever | Consumer staples | United Kingdom | 1.3 | 1.1 | 0.2 |
| Philip Morris | Consumer staples | United States | 1.3 | 1.2 | 0.1 |
| NVIDIA | Information technology | United States | 1.3 | 1.7 | (0.4) |
| Samsung Electronics | Information technology | South Korea | 1.3 | 0.7 | 0.6 |
| Total of top 10 | 19.6 | 20.3 |
Performance
Relative to its performance benchmark, ALW’s good run of returns over 2022 and 2023 faltered in 2024, and six-month numbers are particularly weak.
Figure 11: ALW NAV total return performance relative to benchmark over five years to 28 February 2026
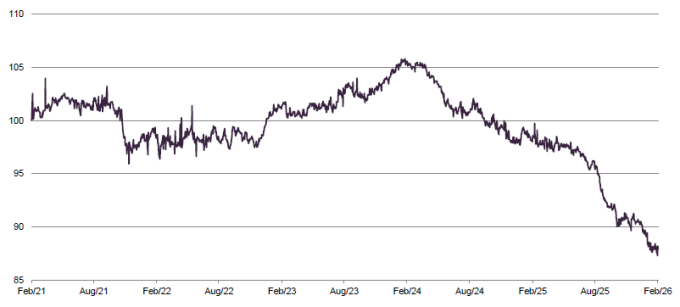
The rise of the AI mega caps has distorted index returns, which is the main reason why the peer group lags the MSCI ACWI so significantly over five years. However, ALW’s longer-term numbers are ahead of the peer group.
Figure 12: Cumulative total return performance over periods ending 28 February 2026
| 3 months (%) | 6 months (%) | 1 year (%) | 3 years (%) | 5 years (%) | |
|---|---|---|---|---|---|
| ALW share price | 0.4 | 3.2 | 4.2 | 38.4 | 64.6 |
| ALW NAV | 0.5 | 3.0 | 4.0 | 37.4 | 59.2 |
| MSCI ACWI | 3.9 | 12.2 | 16.3 | 58.5 | 81.0 |
| Peer group median NAV1 | 2.9 | 6.5 | 12.1 | 42.5 | 52.9 |
| Peer group median share price | 4.6 | 5.6 | 14.1 | 44.4 | 45.3 |
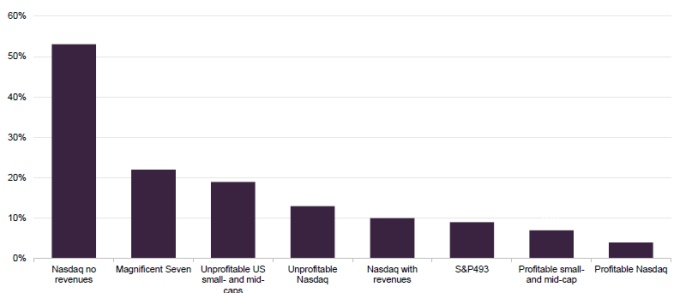
WTW describes ALW’s run of underperformance of MSCI ACWI over the past couple of years as “frustrating”. It feels that the best explanation for this is that markets have been driven more by momentum than fundamentals. Investors with short-term time horizons are dominating trading volumes, while retail investors have been chasing prevailing market trends.
Evidence of this in the US market can be seen in Figure 13, which we sourced from Alliance Witan.
Figure 13: Signs of speculative behaviour in the US – average performance of companies in each category, returns over 2025 in USD
Drivers of ALW’s returns over 2025
As expected, stock selection drove ALW’s returns over 2025
Analysis of ALW’s returns over 2025, supplied to us by WTW, shows that the main driver of its underperformance relative to the benchmark was stock selection, which detracted 8.9 percentage points. The impact of asset allocation was very marginally positive, adding 0.1%.
Among the underlying managers, Dalton Investments was the strongest performer, while Artisan also made a good start. However, WTW observes that GQG, Veritas, Jennison, Sands Capital, and Vulcan all had a less successful year.
On a stock basis, positive contributions to relative performance came from having an underweight exposure to Apple (which is seen as an AI laggard and impacted by tariffs), and overweights to Ryanair (which has been reporting good growth in passenger numbers helped by adding new routes, and has been buying back its stock), Safran (the aero engine maker is seen as a beneficiary of higher defence spending), TSMC (on AI’s insatiable demand for chips), and NRG Energy (on AI’s insatiable demand for power). Collectively, the positioning in these five stocks added 1.6% to ALW’s relative returns.
The main detractors from ALW’s returns were overweight exposures to Diageo (where revenue numbers have been weak) and ICON (a global clinical research organisation that reported weak numbers over 2025 on delays to clinical trials and has since announced an investigation into accounting irregularities) and underweights to NVIDIA, Broadcom, and Alphabet (all of which are beneficiaries of the AI trade). Collectively, these five positions subtracted 2.4% from ALW’s relative performance.
Premium/(discount)
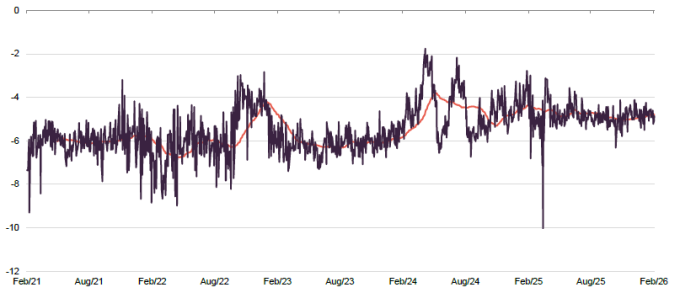
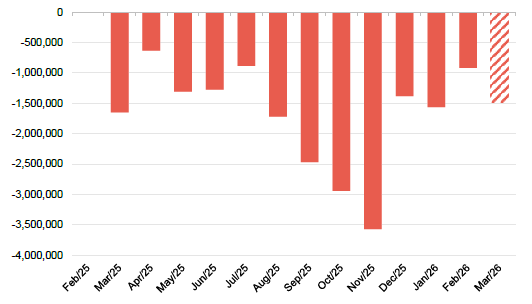
Over the 12 months ended 28 February 2026, ALW’s discount moved within a range of 10.0% to 3.0% and averaged 4.9%. As 11 March 2026, ALW was trading at a 5.1% discount.
ALW’s board aims to maintain a stable discount. To achieve this, the trust deploys share buybacks when necessary.
For the most part, the discount has moved within a tight range. However, Figure 14 shows a spike in the discount associated with the sharp falls in markets triggered by the tariff announcements in April 2025. As Figure 15 shows, the pace of buybacks picked up afterwards, peaking in November. More recently, these have moderated once again.
Figure 14: ALW discount over five years
Each year, the board asks shareholders for permission to buy back up to 14.99% of ALW’s issued ordinary share capital. Shares that are repurchased are held in treasury.
Figure 15: ALW shares repurchased by month to 11 March 2026
SWOT analysis
Figure 16: SWOT analysis for ALW
| Strengths | Weaknesses |
|---|---|
| Access to some of the world’s best managers and their best ideas | Avoiding style, sector, and regional biases could translate into underperformance when those factors are driving markets |
| One of the longest records of increasing dividends every year | Unlikely to keep pace in markets driven by a narrow group of stocks |
| Strict discount control, comparably deep liquidity, and low average running costs thanks to its size | Medium-term returns lag peers and benchmark |
| Opportunities | Threats |
| Balance of style, sector, and regional exposure means ALW should fare relatively well in periods where market leadership changes | Competition from passive index-tracking vehicles |
| Discount control policy makes it look more expensive than peers |
Bull vs bear case
Figure 17: Bull vs bear case for ALW
| Aspect | Bull case | Bear case |
|---|---|---|
| Performance | A more fundamentally-driven market could see a return to form | The AI trade accelerates, leaving ALW further behind |
| Dividends | Progressive dividend policy and multi-decade dividend hero status | None |
| Outlook | Current market volatility associated with the war in Iran may drive out more speculative investors to the benefit of ALW’s investment approach | AI disintermediation undermines the business case for stocks that were previously seen as quality plays |
| Discount | N/A – strict discount control is working | N/A – strict discount control is working |
Previous publications
Readers interested in further information about ALW may wish to read our previous notes (details are provided in Figure 18 below). You can read the notes by clicking on them in Figure 18 or by visiting our website.
Figure 18: QuotedData’s previously published notes on ALW
| Title | Note type | Published |
|---|---|---|
| A trust for all seasons | Initiation | 25 November 2020 |
| The fruits of diversification | Update | 04 August 2021 |
| Stability in troubled waters | Update | 17 November 2022 |
| Coming into its own | Annual overview | 16 November 2023 |
| A new powerhouse | Update | 19 September 2024 |
| A new giant for a new market reality | Annual overview | 12 August 2025 |
IMPORTANT INFORMATION
This marketing communication has been prepared for Alliance Witan Plc by Marten & Co (which is authorised and regulated by the Financial Conduct Authority) and is non-independent research as defined under Article 36 of the Commission Delegated Regulation (EU) 2017/565 of 25 April 2016 supplementing the Markets in Financial Instruments Directive (MIFID). It is intended for use by investment professionals as defined in article 19 (5) of the Financial Services Act 2000 (Financial Promotion) Order 2005. Marten & Co is not authorised to give advice to retail clients and, if you are not a professional investor, or in any other way are prohibited or restricted from receiving this information, you should disregard it. The note does not have regard to the specific investment objectives, financial situation and needs of any specific person who may receive it.
The note has not been prepared in accordance with legal requirements designed to promote the independence of investment research and as such is considered to be a marketing communication. The analysts who prepared this note are not constrained from dealing ahead of it, but in practice, and in accordance with our internal code of good conduct, will refrain from doing so for the period from which they first obtained the information necessary to prepare the note until one month after the note’s publication. Nevertheless, they may have an interest in any of the securities mentioned within this note.
This note has been compiled from publicly available information. This note is not directed at any person in any jurisdiction where (by reason of that person’s nationality, residence or otherwise) the publication or availability of this note is prohibited
Accuracy of Content: Whilst Marten & Co uses reasonable efforts to obtain information from sources which we believe to be reliable and to ensure that the information in this note is up to date and accurate, we make no representation or warranty that the information contained in this note is accurate, reliable or complete. The information contained in this note is provided by Marten & Co for personal use and information purposes generally. You are solely liable for any use you may make of this information. The information is inherently subject to change without notice and may become outdated. You, therefore, should verify any information obtained from this note before you use it.
No Advice: Nothing contained in this note constitutes or should be construed to constitute investment, legal, tax or other advice.
No Representation or Warranty: No representation, warranty or guarantee of any kind, express or implied is given by Marten & Co in respect of any information contained on this note.
Exclusion of Liability: To the fullest extent allowed by law, Marten & Co shall not be liable for any direct or indirect losses, damages, costs or expenses incurred or suffered by you arising out or in connection with the access to, use of or reliance on any information contained on this note. In no circumstance shall Marten & Co and its employees have any liability for consequential or special damages.
Governing Law and Jurisdiction: These terms and conditions and all matters connected with them, are governed by the laws of England and Wales and shall be subject to the exclusive jurisdiction of the English courts. If you access this note from outside the UK, you are responsible for ensuring compliance with any local laws relating to access.
No information contained in this note shall form the basis of, or be relied upon in connection with, any offer or commitment whatsoever in any jurisdiction.
Investment Performance Information: Please remember that past performance is not necessarily a guide to the future and that the value of shares and the income from them can go down as well as up. Exchange rates may also cause the value of underlying overseas investments to go down as well as up. Marten & Co may write on companies that use gearing in a number of forms that can increase volatility and, in some cases, to a complete loss of an investment.