
Tomorrow’s UK market leaders
The Mercantile Investment Trust (MRC) offers investors access to an actively managed portfolio of UK-listed mid- and small-cap (SMID) companies that its manager believes have the potential to become future market leaders. This could be a part of the market where a well-resourced, skilled manager adds value, as MRC’s long-term track record seems to suggest. MRC’s end-August factsheet shows that over the past 10 years, MRC has delivered an average annual outperformance of its benchmark of 2.66% – or a total share price return of 137% versus 85% for the index.
Negative sentiment towards the UK may influence valuations, despite the country being home to many growing businesses. However, relative to peers, UK stocks appear to trade at lower valuations and UK SMID stocks seems to be at lower valuations still. The UK government appears to be addressing the issue, and various initiatives are underway that seemingly have the intention of boosting ownership of UK stocks and deepening the pool of capital available to UK businesses. A shift in investors’ attitudes to UK equities could have an impact on MRC’s returns.
Long-term capital and dividend growth
MRC aims to deliver long-term capital growth from a portfolio of UK medium- and smaller-sized companies, and long-term dividend growth at least in line with inflation over a five-to-ten-year period. It uses long-term gearing with the aim of increasing its potential returns.
Share price and discount
Time period 30/09/2021 to 16/10/2026
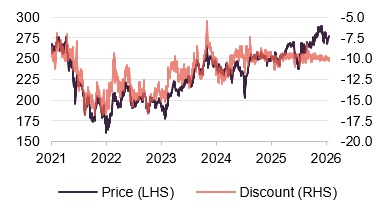
Performance over five years
Time period 30/09/2021 to 30/09/2026
| 12 months ended | Share price total return (%) | NAV total return (%) | MSCI UK SMID Index TR (%) | MSCI UK Index TR (%) |
|---|---|---|---|---|
| 30/09/2022 | (35.8) | (30.8) | (26.7) | 3.8 |
| 29/09/2023 | 23.0 | 19.4 | 17.4 | 14.2 |
| 30/09/2024 | 29.4 | 22.0 | 16.9 | 12.2 |
| 30/09/2025 | 6.7 | 5.7 | 9.0 | 17.2 |
| 30/09/2026 | 14.9 | 15.5 | 11.3 | 17.3 |
Fund profile
More information is available on the trust’s website: mercantileit.co.uk
Mercantile invests in mid- and small-cap UK businesses that its manager believes are high-quality, have strong growth prospects, could deliver growth ahead of market expectations and are attractively priced.
JPMorgan Funds Limited (JPMF) is MRC’s AIFM. It has delegated responsibility for the day-to-day management of the portfolio to JPMAM (UK) Limited (JPMAM). Guy Anderson and Manasij Hajra (from 1 November 2026) are the named co-managers on the trust.
MRC is benchmarked against the FTSE All-Share Index, excluding constituents of the FTSE 100 Index and investment trusts, with net dividends reinvested. For the purposes of this report, we have substituted this with the MSCI UK SMID Index, which appears to have a broadly similar return profile and overlapping constituents.
Market background
For many years, UK small- and mid-cap (SMID) stocks seemingly had a track record of outperformance of large caps. However, from late 2021 onwards, the prospect and then the reality of rising interest rates may have contributed to a period of underperformance that is yet to reverse.
Figure 1: MSCI UK SMID relative to MSCI UK
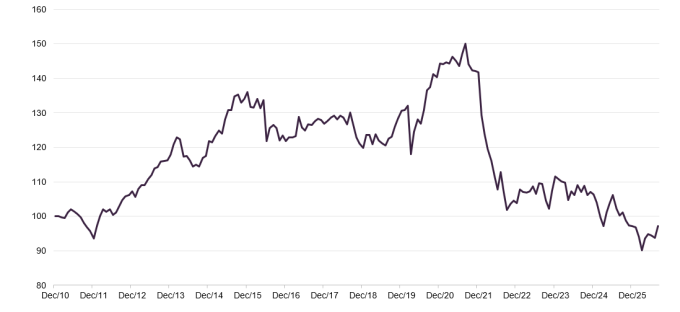
This may have left UK SMID stocks trading on lower valuation multiples than their large-cap equivalents, which is seemingly unusual given that SMID stocks are generally perceived as having a higher growth potential than large caps.
Figure 2: Valuation multiples across various markets
| P/E (current)(x) | P/E (FY26)(x) | P/E (FY 27)(x) | Price/book (FY26) (x) | EV/EBITDA (FY26) (%) | Dividend yield (FY26) (%) | |
|---|---|---|---|---|---|---|
| MSCI UK SMID | 12.88 | 11.51 | 10.66 | 2.15 | 8.28 | 3.32 |
| MSCI UK | 14.11 | 13.26 | 12.73 | 2.38 | 9.74 | 3.22 |
| MSCI Europe ex UK | 17.64 | 16.94 | 15.42 | 2.60 | 13.82 | 2.74 |
| MSCI USA | 23.76 | 21.38 | 18.77 | 5.70 | 17.80 | 1.04 |
| MSCI ACWI | 20.67 | 18.25 | 15.98 | 3.86 | 15.28 | 1.52 |
In addition, UK stocks appear cheaper than peers, as Figure 2 suggest. UK stocks have been underperforming peers for many years. Figure 2 suggests that this period of underperformance began around the same time as the announcement of a proposed referendum on Brexit, accelerated through the COVID period and has stabilised since.
Figure 3: MSCI UK relative to MSCI ACWI
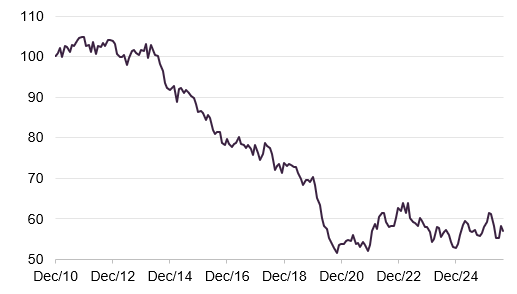
Figure 4: UK 10-year gilt yields
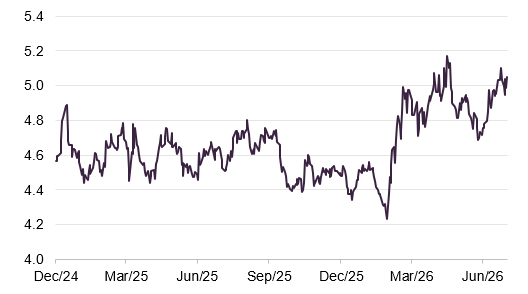
More recently, one influence on markets appears to have been the rise in energy costs associated with the outbreak of the Iran war. This may have contributed to concerns about the sustainability of UK government finances, which in turn may have put upward pressure on long-term gilt yields.
JPMAM notes that despite elevated inflation, there is still a small positive level of real wage growth in the UK economy. JPMAM observes that consumer confidence has been weak for some time, but that spending was resilient, at least until recently. There is still modest growth in UK GDP.
The managers state that their assessment of valuations and confidence in the outlook for stocks in the portfolio have encouraged them to maintain MRC’s gearing towards the upper end of its recent range. However, they note that the portfolio’s beta is lower than the market (the three-year beta was 0.93 at the end of July 2026), which they believe may offset some of the additional volatility that the gearing may introduce.
Investment approach
The trust’s foundational premise is that over the long term, mid and small caps may outperform large caps because, in its view, they could generate higher earnings growth and may be less well-researched
The investment approach is founded on the premise that over the long term, mid and small caps may outperform large caps because they can potentially generate higher earnings growth. MRC’s managers highlight that, by contrast with many large-cap companies, their universe of potential investments includes businesses that are operating in rapidly growing markets, are innovators or disruptors in their fields and possess flexible business models that can adapt rapidly to changing market conditions.
There is also less sell-side analyst coverage in this part of the market, which may contribute to greater asymmetries of information that could suit active management. In addition, there is seemingly a greater tendency for smaller companies to be acquired, which may provide additional alpha.
The team does use sell side research, but the main emphasis is internal. Meetings with company management teams are a core part of that – the team does 400-500 management meetings per annum, which the team believes gives the managers insight into the health of UK businesses.
MRC expects its portfolio to exhibit style aspects of quality, growth and value
The process is based on fundamental and bottom-up stock selection. The managers are looking for stocks that exhibit a combination of a few different characteristics. The managers believe these combine to provide exposure to quality, growth and value styles.
First of these is quality – MRC’s managers seek to invest in businesses they consider to be of sufficient quality. That requires an assessment of financial aspects such as profitability, returns on capital employed, and balance sheet strength, but also a more qualitative analysis of the strength of the management team. MRC’s managers believe management quality is increasingly important as you move down the market cap spectrum.
Meetings with management teams focus on areas such as the growth prospects for the business, planned capital expenditure and the likely returns on that. They may also help uncover information about the wider ecosystem of suppliers and customers.
Growing businesses with positive earnings momentum
The managers want to invest in growing businesses with positive earnings momentum. They look at their long-term prospects, with at least a three-to-five-year time horizon. The managers believe prospective investments should be capable of beating the market’s current expectations.
The third element is value. The managers consider a number of different valuation metrics, including P/Es and price to book, but, in their view, the most important is how much cash a business generates relative to price – the free cashflow yield.
The team monitors news across the UK market, discusses developments and how they might affect the portfolio in daily team meetings, and identifies areas that require further analysis and potential new stock ideas. There is also an ongoing process of portfolio manager-led or analyst-led fundamental research that seeks to identify emerging themes or changes in individual company circumstances.
The managers consider a range of new potential investment ideas, evaluate those, and factor these into a full portfolio review that happens over a roughly six-weekly cycle. The emphasis is on checking that for every stock (there are about 75 stocks in the portfolio), the investment case appears to remain valid; distinguishing between short-term “noise” and potentially more impactful news or change.
Aspects of ESG that the managers consider are financially material to the investment case are assessed to identify potential ESG-related headwinds or tailwinds that could have a significant impact on a company’s share price.
Top-down risk exposures are considered too. As well as weightings relative to the benchmark, look through geographic and sector positioning, style biases, and exposures to themes – AI being one currently.
On average, stocks in the portfolio have about a 1% active weight and the managers say they think about position sizes on an active basis, rather than an absolute basis. The smallest positions tend to be about 30 basis points (on the grounds that, in the managers’ view, anything much below that may have a limited impact on MRC’s performance) and the largest 3%-4%. The largest active positions seem to be in the 2.5%-3.5% range.
Position sizes also seem to reflect the liquidity in a stock. There is a minimum market cap of £100m that MRC would not go below, but in practice the smallest stocks are likely to have a market cap of about £300m.
MRC’s managers retain holdings that have increased in value
The managers feel that, as long as the valuation makes sense, it is important to run winners. That suggests that they may hold onto stocks that get promoted to the FTSE 100. However, when a stock does move into the large-cap index, its active weight relative to MRC’s benchmark seemingly increases, which might prompt the managers to reduce the size of the position.
All of the companies that MRC holds that are in the large-cap index started off life in the portfolio as mid caps, one – Games Workshop, which owns Warhammer – was originally a small cap and is now in the FTSE 100. MRC’s managers describe the customer base as very loyal – many are lifelong fans. The margins on the traditional business are high in MRC’s managers’ view, but they believe that Games Workshop has become much better at monetising its IP in recent years. This and international expansion may be contributing to sales growth. The managers suggest that there are some international markets where they are still only just scratching the surface. A tie-up with Amazon could produce some direct revenue, but could also help accelerate growth in the customer base.
There is no hard limit on large-cap exposure, but the managers aim to limit it at around 20%.
The managers state that they would not add to a stock that was already a FTSE 100 constituent. However, they may choose to make off-benchmark investments in AIM stocks (this has been at about 5% of the total over time).
Sell discipline
If the managers’ investment thesis is invalidated, stocks may be sold and the capital recycled into new opportunities. The managers believe that their analysis of past trading decisions supports this approach.
Asset allocation
MRC’s asset allocation appears to be influenced by the managers’ stock selection decisions.
Figure 5: MRC asset allocation by sector as at 31 August 2026
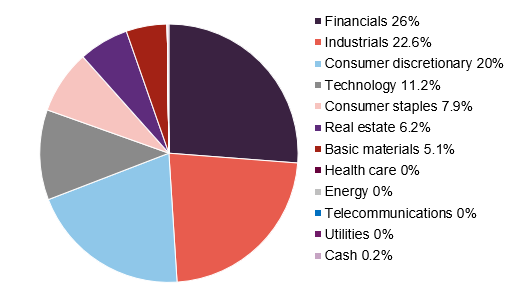
Figure 6: MRC asset allocation by sector as at 31 December 2025
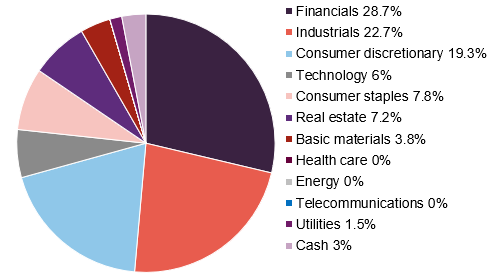
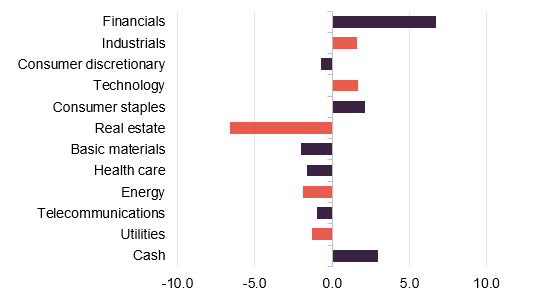
The managers observe that the technology sector’s weighting within the benchmark is low by international standards. However, this is one of the portfolio’s largest overweight positions, with holdings in companies such as Softcat and Computacenter.
Figure 7: MRC sector weights relative to benchmark as at 31 August 2026
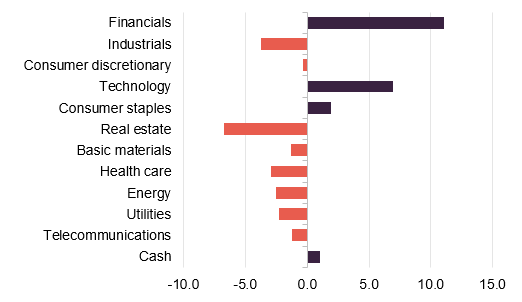
Figure 8: MRC sector weights relative to benchmark as at 31 December 2025
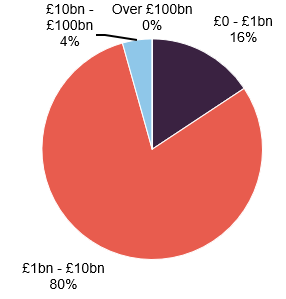
At the margin, MRC’s portfolio has seemingly moved down the market cap scale this year. Since the end of 2025, MRC appears to have a reduced exposure to stocks over £10bn market cap and an increased exposure to stocks of less than £1bn market cap.
Figure 9: MRC split by market cap at 31 August 2026
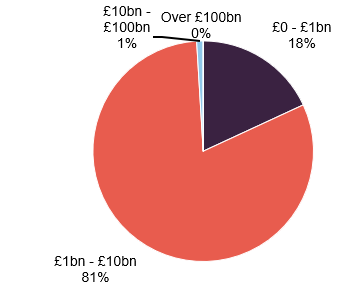
Figure 10: MRC split by market cap at 31 December 2025
MRC aims to represent an investment in UK listed companies that its manager considers among the most promising, but the managers say it is not a pure play on the domestic economy – an analysis of the portfolio at the end of April 2026 suggested that 52% of the revenue of the companies in the portfolio was derived from the UK (the equivalent for the FTSE100 was 24%).
Figure 11: MRC revenue split
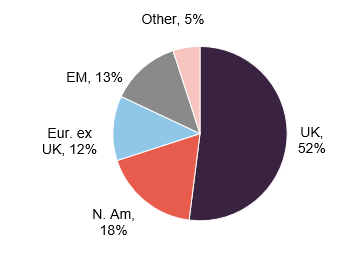
Figure 12: MRC versus benchmark as at 31 July 2026
| MRC (%) | Benchmark (%) | |
| ROIC | 14.5 | 10.8 |
| ROE | 14.3 | 11.4 |
| EPS breadth1 | 10.9 | 0.9 |
| EPS change | 1.6 | (0.8) |
| Forward earnings yield | 7.7 | 8.1 |
| Historical free cash flow yield | 7.8 | 7.9 |
Based on the analysis shown in Figure 12, MRC appears to have a bias to businesses earning higher returns on investment and faster earnings growth, but does not appear to be paying a premium to access these stocks.
Top 10 holdings
Around a third of MRC’s portfolio is invested in its 10 largest positions. Figure 13 compares the position at end August 2026 with that at MRC’s year end on 31 January. There has been little change to the composition of the top 10, although since the year end, Rotork (which was a 2.5% position on 31 January 2026, but was reduced over the early summer amid seeming concerns about slowing demand) has been bid for at a 73% premium to the prevailing share price and has left the portfolio. Computacenter, whose share price is up over 80% year to date, has moved up into the top 10.
Figure 13: MRC top 10 equity holdings at 31 August 2026
| Sector | % as at 31 August 2026 | % as at 31 January 2026 | Change (%) | |
|---|---|---|---|---|
| Softcat | Technology | 4.5 | 2.5 | 2.0 |
| ICG | Financials | 3.5 | 3.1 | 0.4 |
| Bellway | Consumer discretionary | 3.2 | 3.5 | (0.3) |
| Computacenter | Technology | 3.2 | 1.1 | 2.1 |
| Cranswick | Consumer staples | 3.2 | 3.3 | (0.1) |
| Hill & Smith | Basic materials | 3.2 | 2.4 | 0.8 |
| Balfour Beatty | Industrials | 3.1 | 3.2 | (0.1) |
| Serco | Industrials | 3.0 | 4.4 | (1.4) |
| Lion Finance | Financials | 2.7 | 2.7 | – |
| Plus500 | Financials | 2.6 | 3.8 | (1.2) |
| Total of top 10 | 32.2 |
Softcat
Figure 14: Softcat (GBp)
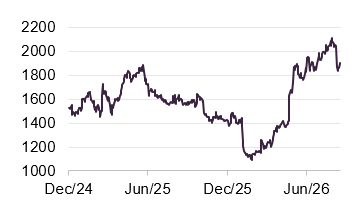
Softcat (softcat.com) is a sales channel for the larger technology OEMs to access SMEs. Its business is mostly in the UK, and it serves over 10,000 end customers. The managers say it has a highly cash-generative, asset-light business model and is valued at a discount to its historical rating.
This is a stock that MRC acquired at IPO in November 2015 and one that the managers feel still merits its place as the largest position today. The position was trimmed in 2021, added to in 2022 and trimmed again in 2024 after the rebound. More recently, the managers have been adding to the position once again amid price weakness.
JPMAM says Softcat has an excellent organic growth track record, which may be supported by a long-term secular trend of technology adoption. The managers feel it helps that the company has a strong selling culture with staff that are incentivised. JPMAM believes that Softcat can continue to achieve market share gains (from about a 5% market share today) in what is a fragmented industry – to that end, Softcat has broadened and deepened its technology expertise.
In May 2026, Softcat said it was expecting to see mid-teens growth in its underlying operating profit for its financial year that ended 31 July 2026, above earlier forecasts. It did flag an impact from memory shortages that it said was affecting order flows.
ICG
Figure 15: ICG (GBp)
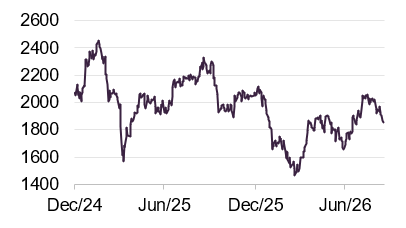
ICG (icgam.com) is a global alternative asset manager with $126bn of AUM at 30 June 2026 (of which, fee-earning AUM is $88bn, a figure that had grown by 10% over the previous year, and a CAGR of 12% over the previous five years). The business focuses on structured capital, private equity secondaries, private debt, credit, and real assets. MRC’s managers highlight that private credit has been attracting some negative publicity and believe that, for the asset class as a whole, much of this may be justified; they suggest that this may have contributed to a deterioration in sentiment towards ICG.
However, as was the case in 2021 when alternative asset managers appeared to be affected by concerns over the impact of rising interest rates, concerns that this would affect ICG’s ability to raise assets appear to have been overstated. JPMAM considers that ICG has continued to deliver good performance and raise its AUM ahead of expectations. Discussions with ICG’s management suggest that there are no issues of significance within its private credit portfolios. It may help that ICG does not have a particularly large presence in North America, which is where most of the concerns appear to be. JPMAM indicates that it is willing to weather this period of uncertainty.
Bellway
Figure 16: Bellway (GBp)
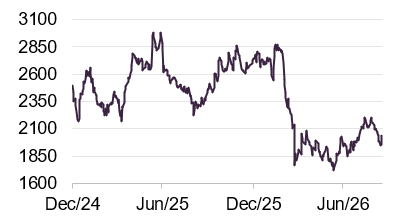
Bellway (bellwayplc.co.uk) is a house builder and this is a sector that MRC’s manager regards as facing challenges. The manager points out that housing market demand is weak, mortgage rates are elevated (and suggests that concerns that the Iran war could mean even higher rates may account for the fall in the share price evident in Figure 16), and house price inflation is running behind cost inflation – potentially squeezing margins.
However, JPMAM believes that Bellway has a very strong track record of capital allocation. The business has continued to invest, adding 8,578 plots to its landbank over the year to 31 July 2026. MRC’s managers flag that Bellway has a reasonably strong balance sheet (adjusted gearing was below 5% at end July) and is keen to improve its capital efficiency. This could mean increased returns to shareholders and improving returns on capital; the company intends to launch a £50m buyback later this year. They also highlight that Bellway’s shares are trading on a wide discount to their book value (about 30%), and that history suggests that taking a counter cyclical approach to investing in house builders may pay off.
Other stocks
Elsewhere in the portfolio, MRC has exposure to a number of UK industrial businesses, including an investment in Diploma, a distributor of a wide range of different industrial products. This is a business that has compounded sales and profits over the years, potentially supported by M&A as well as organic growth. MRC’s managers have a positive view of Johnny Thompson, Diploma’s CEO, who joined the company in 2019 and appears to have accelerated the M&A strategy.
MRC has also made more recent investments in industrial companies such as Renishaw, XP Power, and Volex, which MRC believes have been performing well, potentially benefiting in part from capex to support AI.
Performance
Figure 17: MRC NAV relative to MSCI UK SMID Index in total return terms over five years to 30 September 2026
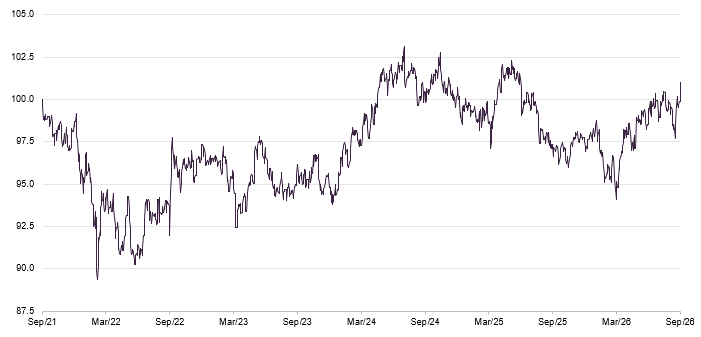
Figure 18: Total return performance over periods ending 30 September 2026
| 3 months(%) | 6 months(%) | 1 year(%) | 3 years(%) | 5 years(%) | |
|---|---|---|---|---|---|
| MRC share price | 5.7 | 21.5 | 14.9 | 58.8 | 25.3 |
| MRC NAV | 6.0 | 21.3 | 15.5 | 48.9 | 23.1 |
| MSCI UK SMID Index | 3.4 | 13.0 | 11.3 | 41.8 | 21.9 |
| Peer group median NAV1 | 6.0 | 17.3 | 12.0 | 45.8 | 23.1 |
| Peer group share price median | 5.7 | 20.3 | 13.1 | 56.7 | 25.3 |
The five-year numbers appear to reflect the market decline that accompanied the 2022 interest-rate hiking cycle. This may have had a disproportionate impact on SMID stocks, which may have weighed on MRC’s return, an effect that could have been amplified by its gearing. Since then, MRC’s returns relative to the MSCI UK SMID index have improved and it appears to have recovered the underperformance.
The managers say that M&A activity has been a significant influence on the trust’s relative performance this year. MRC had exposure to some but not all of this activity, lacking exposure to the bidding for Spectris last year, for example, and this year not holding easyJet.
Performance attribution
JPMAM has supplied us with some performance attribution statistics that cover the 12-month period ended 31 July 2026 and relate to returns relative to the trust’s benchmark.
Contributors
Figure 19: Relative performance positive attribution, 12 months to 31 July 2026
| Relative weight (%) | Stock return (%) | Impact (%) | |
|---|---|---|---|
| Balfour Beatty | 2.13 | 61.71 | 0.81 |
| Lion Finance Group | 1.91 | 58.98 | 0.75 |
| Softcat | 2.61 | 22.08 | 0.65 |
| Hill & Smith | 2.22 | 42.28 | 0.60 |
| Computacenter | 0.93 | 104.39 | 0.59 |
| Total | 3.40 |
Balfour Beatty has seen a rise in its share price, which may have been supported by a growing order book. The company is focused on UK energy transition and security, UK defence, UK transport, and US buildings, which it believes are areas benefitting from secular trends. The company recently upgraded its earnings guidance. Hill & Smith may have benefited from similar trends.
Lion Finance (formerly Bank of Georgia) is seeing growth in both its Georgian and Armenian businesses – in particular in its digital products – and may also be benefitting from expanding net interest margins.
Computacenter’s latest trading statement indicated that the company is expecting its first half profit to double year-on-year.
Detractors
Figure 20: Relative performance negative attribution, 12 months to 31 July 2026
| Relative weight (%) | Stock return (%) | Impact (%) | |
|---|---|---|---|
| 3i Group | 2.73 | (28.72) | (1.69) |
| Telecom Plus | 1.33 | (51.78) | (1.33) |
| ICG | 4.25 | (9.11) | (1.03) |
| Dunelm Group | 1.43 | (34.24) | (1.00) |
| Bellway | 2.64 | (17.70) | (0.88) |
| Total | (5.93) |
3i is a FTSE100 stock that MRC has held for many years. The private equity manager’s portfolio is dominated by Action, a European discount retailer. When concerns emerged over its pace of growth, especially in its French business, and the share price fell back. MRC’s managers decided to reduce the position.
Household utility services provider Telecom Plus may have been affected by increased customer churn, lower energy consumption over the 2025/26 winter period, and more competition for broadband customers. The stock is no longer held in the portfolio.
Retrospectively, ahead of last year’s budget, MRC’s portfolio appears to have been exposed to UK consumer spending and may have been affected by the government’s decision to raise taxation, which may have weighed on the likes of Dunelm and Bellway.
Peer group comparison
There are five trusts in the AIC’s UK all companies sector and these encompass a range of investment approaches. Some of these trusts have exposure to large caps, which as we discussed in the market background section, have been outperforming mid and small caps. MRC’s closest competitor is probably Schroder UK Mid Cap.
Figure 21: UK all companies peer group NAV total return performance over periods ending 30 September 2026
| 3 months(%) | 6 months(%) | 1 year(%) | 3 years(%) | 5 years(%) | |
|---|---|---|---|---|---|
| MRC | 6.0 | 21.3 | 15.5 | 48.9 | 23.1 |
| Aurora UK Alpha | 3.5 | 12.5 | 2.9 | 25.8 | 31.7 |
| Baillie Gifford UK Growth | 4.6 | 19.3 | 9.6 | 43.0 | 12.9 |
| Fidelity Special Values | 8.8 | 17.3 | 20.2 | 71.0 | 80.2 |
| Schroder UK Mid Cap | 9.9 | 16.4 | 12.0 | 45.8 | 18.2 |
| Peer group median | 6.0 | 17.3 | 12.0 | 45.8 | 23.1 |
| MRC rank | 3/5 | 1/5 | 2/5 | 2/5 | 3/5 |
A focus on quality and growth appears not to have been rewarded by markets in recent years and that is reflected in the peer group table where value-focused Fidelity Special Values has ranked first over longer time periods, especially since higher interest rates returned in 2022. The Fidelity trust also has a bias to large-cap stocks, which have outperformed SMID-cap stocks. Against that backdrop, MRC’s performance ranks second over most time periods.
Figure 22: UK all companies peer group, comparison as at 19 October 2026
| Market cap(£m) | Discount(%) | Dividend yield(%) | Ongoing charge(%) | |
|---|---|---|---|---|
| MRC | 1,715 | (10.3) | 2.9 | 0.49 |
| Aurora UK Alpha | 265 | (11.8) | 1.9 | 0.35 |
| Baillie Gifford UK Growth | 218 | (9.8) | 2.8 | 0.76 |
| Fidelity Special Values | 1,553 | (0.2) | 2.0 | 0.68 |
| Schroder UK Mid Cap | 164 | (6.4) | 2.9 | 0.92 |
| Peer group median | 265 | (9.8) | 2.8 | 0.68 |
| MRC rank | 1/5 | 4/5 | 1/5 | 2/5 |
MRC is the largest trust in the peer group and this, together with its management fee, may be reflected in its lower average running costs. Aurora UK Alpha’s are lower, but it operates with no base management fee and a performance fee.
Fidelity Special Values has sustained a tighter discount, and at times a premium. That may reflect its improved track record in recent years. MRC’s improved performance could also translate into an improved rating.
None of these trusts is managed to produce a high dividend yield; MRC’s is at the top end of the range.
Dividend
One of MRC’s stated aims is to grow its dividend at least in line with inflation over a five-to-ten-year period – over the 10 years to the end of January 2026, MRC grew its dividend by 90.7%, which compares to a 40.2% increase in CPI over this period.
MRC has achieved an 8.3% CAGR in its dividend over 32 years
MRC has achieved an 8.3% CAGR in its dividend over 32 years. MRC has at least maintained its dividend since 1992 and has now increased its dividend every year for the last 13 years, and is classified as an “AIC next generation dividend hero”.
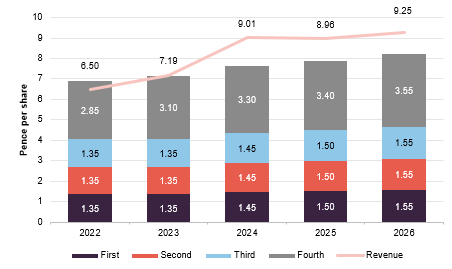
MRC declares dividends quarterly, which are paid in August, November, February, and May. The usual pattern has been to declare three equal dividends plus a larger fourth dividend.
Figure 23: MRC ordinary dividends (pence per share)
At the end of January 2026, MRC had revenue reserves totalling £104.3m, equivalent to almost 16.6p per share. The company offers a dividend reinvestment plan.
Premium/(discount)
Figure 24: MRC premium/(discount) over five years ending 30 September 2026
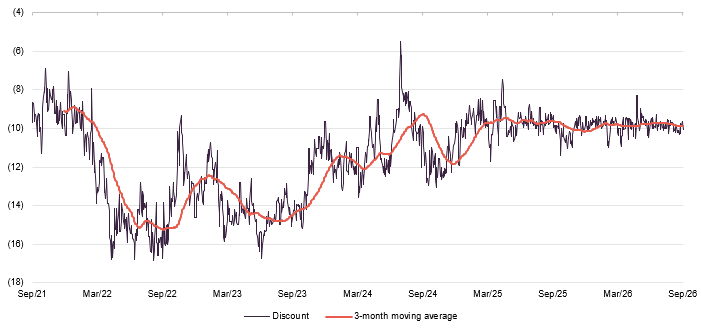
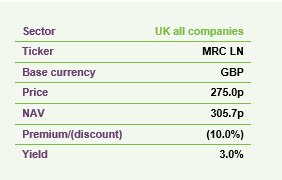
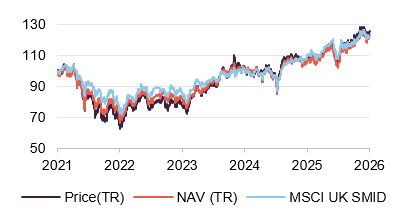
Over the year ending 30 September 2026, MRC’s shares traded within a discount range of 11.4% to 8.3%, with an average discount of 9.9%. As of 16 October 2026, MRC’s shares were trading at a discount of 10.3%.
Many trusts seemingly experienced a widening discount as interest rates started to rise over 2022 and MRC was no exception. Political uncertainty in the UK – which perhaps peaked with the Truss/Kwarteng “Mini” budget in September 2022 – may have further weakened demand for UK equities and MRC. As discussed in the market background section, demand for UK equities appears to remain relatively subdued. Against that backdrop, the board has stepped up the pace of share buybacks and may have helped keep the discount around the 10% level over the past couple of years.
At the AGM held on 21 May 2026, shareholders renewed the board’s powers to buy back up to 14.99% of MRC’s issued share capital (excluding shares held in treasury).
Figure 25: MRC share buybacks by month over the past year
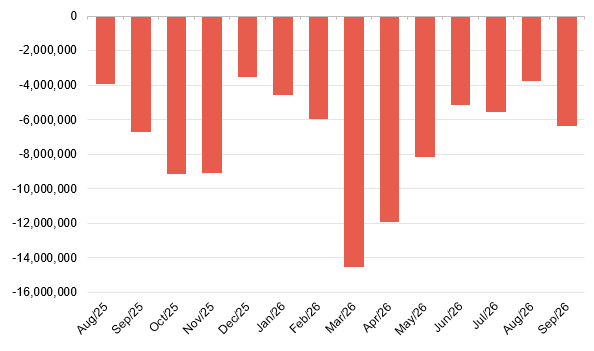
Figure 25 shows the pattern of share buybacks over the past 12 months. The higher levels of March and April may reflect investors’ concern about the impact of the Iran war on the UK economy. More recently, the pace of buybacks has seemingly slowed, which could indicate improving sentiment towards the UK.
Structure
Capital structure
As at 16 October 2026, MRC had 944,492,180 ordinary shares in issue of which 325,433,989 were held in treasury. That leaves 619,058,191 shares with voting rights.
The company’s year-end is 31 January. AGMs are usually held in May.
Gearing
The board’s gearing policy is to operate within a range of 10% net cash to 20% geared in normal market conditions. At 2 October 2026, MRC’s net gearing was 16.6%.
MRC has £175m of 6.125% debenture stock that is repayable on 25 February 2030, plus £1.08m of 4.25% perpetual debenture stock, and £150m of senior unsecured privately-placed loan notes. £55m of the loan notes have a fixed coupon of 1.98% and are repayable on 8 September 2041; £50m have a fixed coupon of 2.05% and are repayable on 8 September 2051; and the balance of £45m have a fixed coupon of 1.77% and are repayable on 8 September 2061.
The notes come with covenants that say net borrowings as a percentage of adjusted assets cannot exceed 35% and MRC should have minimum net assets of £725m.
Fees and costs
JPMorgan Funds Limited (JPMF) is MRC’s AIFM and company secretary. Its contract is terminable on six months’ notice, The management fee is charged at the rate of 0.45% of MRC’s market capitalisation, which may give the manager an incentive to help narrow the discount. There is no performance fee.
The company’s scale may help keep its average running costs low. For the financial year ended 31 January 2026, MRC’s ongoing charges ratio was 0.49% (up from 0.48% for the previous financial year).
Management team
Guy Anderson
Guy is the lead of the UK mid- and small-cap investment team at JPMAM and has additional responsibilities for UK growth mandates. An employee since 2012, Guy was previously an investment analyst at Breeden European Capital and at Pendragon Capital. He obtained an M.Eng (Hons) in Engineering from the University of Oxford and is a CFA charterholder..
Manasij (Manny) Hajra
Guy has worked alongside Anthony Lynch as co-manager of MRC for 14 years. However, on 15 October it was announced that Anthony would be stepping down at the end of the month to take up new responsibilities at JP Morgan, to be replaced as co-manager by Manny Hajra.
Manny is a portfolio manager within JPMAM’s International Equity Group, based in London, and a member of the UK mid- and small-cap investment team. He joined JPMAM in 2019 as a graduate trainee and has been involved in the management of MRC’s portfolio for seven years. He has co-managed the JPM UK Equity Growth Fund alongside Guy since February 2023. He holds a BA in Economics from the University of Cambridge and is a CFA charterholder.
Board
Following the recent appointment of Richard Wilson, MRC has six directors, all of whom are non-executive and who do not have any connection to the manager.
The chair Rachel Beagles took on the role in May 2025 on the retirement of her predecessor. Graham Kitchen became senior independent director at the same time.
At the AGM held on 21 May 2026, shareholders voted to lift the overall cap on directors’ fees to £450,000 (from £400,000).
Figure 26: Directors
| Role | Appointed | Length of service (years) | Fee | Shareholding | |
|---|---|---|---|---|---|
| Rachel Beagles | Chairman | 1 June 2021 | 5.2 | 78,000 | 115,743 |
| Graham Kitchen | Senior independent director, chair of the management engagement and remuneration committees | 1 July 2018 | 8.2 | 46,750 | 94,180 |
| Damian Maltarp | Chair of the audit and risk committee | 1 June 2021 | 5.2 | 56,000 | 28,000 |
| Heather Hopkins | Chair of the marketing and communications committee | 1 July 2018 | 8.2 | 46,750 | 25,406 |
| Julia Goh | Director | 1 January 2023 | 3.7 | 42,000 | 20,000 |
| Richard Wilson | Independent non-executive director | 3 August 2026 | 0.1 | 42,000 | 0 |
Rachel Beagles
Rachel has over 20 years of experience in the investment company sector, including six years as an AIC board member, of which three were served as chair. She was a managing director and co-head of the pan-European banks equity research and sales team at Deutsche Bank’s corporate and investment banking division. Since 2003, she has worked as a non-executive director for a range of businesses including those in the investment company, asset management and fintech sectors. Rachel is a non-executive director of Alliance Witan Plc.
Graham Kitchen
Graham has over 20 years’ experience managing UK equity funds, including OEICs, investment trusts and pension funds. He was global head of equities at Janus Henderson Investors from 2011 to 2018. Formerly head of UK equities at Threadneedle Investments, he held various positions at Invesco Asset Management. Graham is a non-executive chairman of AVI Global Trust Plc and a non-executive director of Places for People, a provider of affordable housing. He is a CFA Charterholder.
Damien Maltarp
Damien has more than 25 years’ experience across a range of financial disciplines. He is currently CFO at Gamma Communications plc. He was previously at London Stock Exchange Group plc, where he was Group Financial Controller, and BT Group Plc, where he was CFO of enterprise and, before that, CFO of wholesale & ventures and investor relations director. He spent 10 years as an equity analyst, including roles at JPMorgan Cazenove and Credit Suisse. Damien is a qualified chartered accountant and fellow of ICAEW.
Heather Hopkins
Heather has over two decades of experience in data analytics, research, financial services and international business, with a focus on retail distribution. She is founder and managing director of NextWealth Limited, which provides research and consultancy to platforms, asset managers and financial advice firms on the future of retail investment distribution. Heather is also a director of Orbis Investments (U.K.) Limited.
Julia Goh
Julia has financial services experience in London. She was a managing director at Barclays Investment Bank in various senior front-office roles in global markets and was previously global head of prime services risk at Credit Suisse. Julia started her markets career at Nomura International as a risk manager, having previously trained as an accountant at Coopers & Lybrand. A Singaporean, Julia came to London in 1987 and obtained her BSc from the London School of Economics and Political Science and a MSc from Bayes Business School. She is a fellow of the ICAEW and has a Certificate in Company Direction from the Institute of Directors.
Julia is an independent non-executive director and chair of the audit committee of ICBC Standard Bank Plc, non-executive director and chair of audit and risk committee of Schroder AsiaPacific Fund Plc. She is also a senior advisor at Phoenix Merchant Partners, and a director of the charity Children of the Mekong.
Richard Wilson
Richard has over 35 years’ experience in asset management. He began his career in 1988 as a UK equity manager at HSBC Asset Management (formerly Midland Montagu), before moving to Deutsche Asset Management (formerly Morgan Grenfell), where he became managing director of global equities. He subsequently joined Gartmore Investment Management as head of international equity investments in 2003, before moving to F&C Asset Management in 2004. He went on to become chief executive of F&C, overseeing its acquisition by BMO Financial Group, and subsequently served as chief executive of BMO Global Asset Management. Richard was previously a non-executive director of Insight Investment Management Limited and is currently a non-executive director of Albion Crown VCT Plc.
IMPORTANT INFORMATION
Marten & Co (which is authorised and regulated by the Financial Conduct Authority) was paid to produce this note on The Mercantile Investment Trust Plc.
This note is for information purposes only and is not intended to encourage the reader to deal in the security or securities mentioned within it. Marten & Co is not authorised to give advice to retail clients. The research does not have regard to the specific investment objectives financial situation and needs of any specific person who may receive it.
The analysts who prepared this note are not constrained from dealing ahead of it but, in practice, and in accordance with our internal code of good conduct, will refrain from doing so for the period from which they first obtained the information necessary to prepare the note until one month after the note’s publication. Nevertheless, they may have an interest in any of the securities mentioned within this note. This note has been compiled from publicly available information.
This note is not directed at any person in any jurisdiction where (by reason of that person’s nationality, residence or otherwise) the publication or availability of this note is prohibited.
Accuracy of Content: Whilst Marten & Co uses reasonable efforts to obtain information from sources which we believe to be reliable and to ensure that the information in this note is up to date and accurate, we make no representation or warranty that the information contained in this note is accurate, reliable or complete. The information contained in this note is provided by Marten & Co for personal use and information purposes generally. You are solely liable for any use you may make of this information. The information is inherently subject to change without notice and may become outdated. You, therefore, should verify any information obtained from this note before you use it.
No Advice: Nothing contained in this note constitutes or should be construed to constitute investment, legal, tax or other advice.
No Representation or Warranty: No representation, warranty or guarantee of any kind, express or implied is given by Marten & Co in respect of any information contained on this note.
Exclusion of Liability: To the fullest extent allowed by law, Marten & Co shall not be liable for any direct or indirect losses, damages, costs or expenses incurred or suffered by you arising out or in connection with the access to, use of or reliance on any information contained on this note. In no circumstance shall Marten & Co and its employees have any liability for consequential or special damages.
Governing Law and Jurisdiction: These terms and conditions and all matters connected with them, are governed by the laws of England and Wales and shall be subject to the exclusive jurisdiction of the English courts. If you access this note from outside the UK, you are responsible for ensuring compliance with any local laws relating to access.
No information contained in this note shall form the basis of, or be relied upon in connection with, any offer or commitment whatsoever in any jurisdiction.
Investment Performance Information: Please remember that past performance is not necessarily a guide to the future and that the value of shares and the income from them can go down as well as up. Exchange rates may also cause the value of underlying overseas investments to go down as well as up. Marten & Co may write on companies that use gearing in a number of forms that can increase volatility and, in some cases, to a complete loss of an investment.