Cautiously positioned in volatile markets
In times of market turmoil, it is only natural that investors would look closer at trusts such as Capital Gearing Trust (CGT), which seeks to avoid losing shareholders’ money. As we show on page 3, it has done a great job of achieving this over more than four decades, with just two, low-single-digit “down-years” since 1982. Management view CGT as the most defensive trust in the UK market, just along the risk curve from cash. The trust has delivered on its ambition of growing investors’ wealth in real terms, with returns to shareholders around 13 percentage points higher than UK inflation (as measured by CPI) over the 10-year period to end April 2025.
The managers have a core belief that long-term returns for investors are maximised by avoiding loss in down periods; the effect of this is evident in the standout return of 273x since Peter Spiller took over responsibility for the trust in 1982 (to end February 2025). Investors can also take comfort from the trust’s discount control policy, and the fact that at the end of February 2025, ahead of Trump’s tariff announcements, CGT had 32% of its portfolio in “dry powder” – cash, treasury bills, and short-duration corporate credit.
Preserve and grow shareholders’ real wealth
CGT aims to preserve and grow its shareholders’ real wealth over time. Whilst it has a long-term investment horizon, it has an aversion to short-term losses. That means that greater emphasis is placed on avoiding loss than on maximising returns. It targets returns in sterling that are ahead of inflation over the long term.

| Year ended | Share price total return (%) | NAV total return (%) | UK CPI(%) | MSCI UK IMI total return (%) |
|---|---|---|---|---|
| 30/06/2021 | 11.5 | 11.2 | 2.5 | 20.2 |
| 30/06/2022 | 2.9 | 2.6 | 9.4 | 3.7 |
| 30/06/2023 | (7.7) | (3.4) | 8.0 | 7.0 |
| 28/06/2024 | 5.6 | 5.2 | 2.0 | 13.2 |
| 30/06/2025 | 3.9 | 4.4 | 3.2 | 11.1 |
The investment philosophy and approach
You can access the trust’s website at: www.capitalgearingtrust.com
CGT is designed to suit investors with a long-term investment horizon, that have an aversion to significant short-term losses, and a desire to generate returns ahead of inflation. Over a very long period it has substantially outperformed inflation with a consistently low level of drawdowns.
Its manager is CG Asset Management (CGAM), which also acts as the company’s AIFM. CGAM was established in 2001 by Peter Spiller, who has been responsible for CGT’s portfolio since 1982. Since then, it has experienced only two down years – over the 12 months ended 31 March 2014 and the 12-month period that ended on 31 March 2023. In both cases, the period was marked by rising bond yields. More information on CGT’s performance is provided on pages 10-11.
Figure 1: CGT’s long-term returns compared to MSCI UK
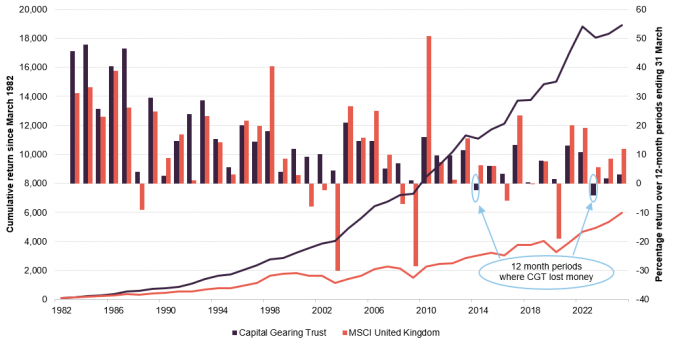
Source: Morningstar, Marten & Co
Achieving absolute real returns
CGT has a multi-asset portfolio. The managers allocate between three core asset allocation pillars – dry powder, risk assets, and index-linked bonds – with the aim of mitigating against the potential for capital losses, while adapting the portfolio to suit the macroeconomic environment and valuation opportunities. The managers are permitted to have a maximum equity exposure of 80% and a minimum of 20%. In practice, the proportion in risk assets is kept within a range of 25%–45%.
A distinctive feature of the approach is that CGT uses listed collective investment vehicles, including investment companies and ETFs, to gain exposure to equities, property, and alternative assets. It seeks to profit from discount narrowing on investment companies as a way of generating additional alpha.
The managers have spent a lot of time analysing how different asset classes perform in different parts of the economic cycle and the results of this inform CGAM’s asset allocation decisions. Figure 2 is a useful summary of their analysis.
Figure 2: The right asset at the right time
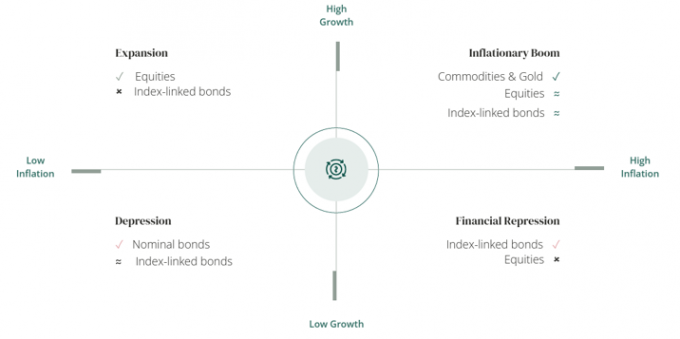
Source: CGAM
When applying this to portfolio construction, the managers establish where we sit at this point of the cycle by looking at where the last published growth and inflation figures sit relative to their two-year averages. They then use the results of this to tilt the asset allocation gradually over time towards the optimal position.
The managers run models that indicate prospective returns on different asset classes. These provide a sense check to their macroeconomic beliefs.
The team prefers to use index-linked bonds over nominal bonds. Although nominal bonds and equities are negatively correlated over the long-term (which is why a traditional 60:40 portfolio should do well) this relationship breaks down when inflation is rising, which is what the managers expect to occur in the medium and long-term. Inflation poses the greatest risk to investor wealth, against which equities are only a partial hedge, and CGT believe there to be a significant risk of higher inflation persisting. Buying index-linked bonds largely insures against this risk and they are therefore the only asset likely to deliver protection against financial repression. They have historically outperformed nominal bonds, and the team believe this will continue in the future.
In addition, because investors consistently underestimate inflation rates (as evidenced by a comparison of two-year break-even rates versus actual inflation, which suggests a persistent underestimation of inflation by about 1%) returns should be higher. The team notes that TIPS have outperformed Treasury Bills since 2000.
The team uses a suite of proprietary tools to monitor valuations of investment companies (including live NAV estimates), selected securities, currencies, and fixed income instruments.
CGT aims to conduct itself responsibly, ethically, and fairly and seeks to ensure that the investment decisions take account of ESG matters where appropriate.
Current thinking
At present, the team’s central case is that there is too much debt in the system, and this creates macroeconomic fragility and slows rates of growth. Resolution of this problem will require some form of financial repression. The managers believe that we are in a stagflationary environment and that this will persist for some time yet. They are increasingly convinced that the next decade will be characterised by higher inflation than the previous one.
In CGAM’s view, a number of big deflationary forces have petered out. China was exporting deflation to the rest of the world for a long time (possibly since it joined the WTO in 2001) and the effects of this were supported by increasing globalisation of trade. However, rising wage rates in China, tariffs, and a reversal of globalisation (with trends towards “reshoring”, and “friendshoring”) are undoing this.
CGAM believes that the drive to achieve net zero greenhouse gas emissions is inflationary, and so, too, is the rearmament of countries such as Germany and Japan. War is also having an adverse effect, examples include power price rises in the wake of the attack on Ukraine, and the disruption to traffic through the Red Sea.
CGAM feels that a reversal of globalisation, which is being given fresh impetus by President Trump’s tariff policies, means that the dynamic between labour and capital is swinging back towards labour. Workers are demanding a reversal of real-terms wage cuts experienced since the global financial crisis but brought into increased focus by the surge in inflation after COVID.
The team also remarks that goods deflation of about 1% per annum has flattered inflation figures for the past couple of decades. It feels that this could be coming to an end.
Figure 3: US and UK inflation
Figure 4: UK and US index-linked yields (10-year)
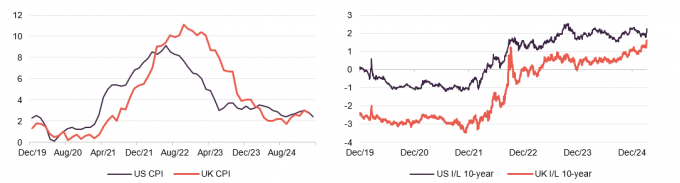
Source: Bloomberg
Source: Bloomberg
Technological leaps are usually deflationary. However, whilst there are individual examples of AI delivering cost savings, the vast amounts being invested into the area are not yet translating into matching cost savings. Instead, we see effects such as upward pressure on power prices.
Even before the tariff wars, economic growth rates were subdued in most parts of the world and the managers were concerned that the US economy was slowing. Now, the uncertainty created by the on-again/off-again tariffs and DOGE’s clumsy attempts at cost-cutting seem likely to stall investment decisions. Tax cuts are unlikely to stimulate consumer spending, especially if there are concerns about cuts to Medicare/Medicaid and falling stock markets. A recession in the US seems more likely. There has been a spike in credit spreads and default expectations.
There is a significant question mark over the Federal Reserve’s appetite for further rate cuts if inflation stays well above target. There also seems to be unease over the size of the US deficit and the degree to which countries such as Japan and China are happy to continue to fund it. That appears to be having an impact at the longer end of the yield curve. The managers are keeping levels of dry powder high, reducing the portfolio’s duration (see Figure 12 on page 9) to reflect the risk of a steepening yield curve as was seen in 2022 per Figure 5 below.
Figure 5: US 10-year minus two-year Treasury yields
Figure 6: US high yield minus investment grade yield
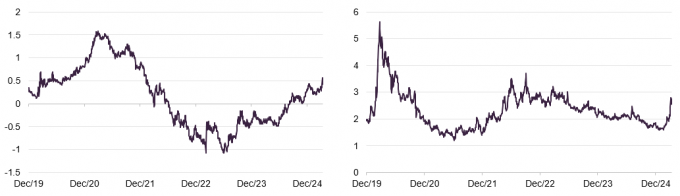
Source: Bloomberg
Source: Bloomberg
This backdrop of likely higher inflation offers significant opportunities to the managers. Real yields on index-linked bonds are currently very attractive, being above the medium-term growth rate and likely productivity growth, particularly in the UK. Historically this has been a very good entry point into the asset class. Conversely exposure to corporate credit is low, and duration short, due to a lack of opportunities.
As well as inflation-protected securities in the US and UK, the team feels that a weak Japanese yen is benefitting Japanese corporates, and this makes Japanese equities attractive, but tariffs need to be factored into this. The portfolio has exposure to JGBs, which the team has hedged back into sterling. When the investment was made, hedged JGBs offered a better return than US Treasuries.
The bias within the inflation-protected portfolio is to US TIPs, some of this position (equivalent to about 5% of the portfolio) is hedged back into sterling. The duration on the UK inflation-linked securities is longer than on the US ones.
Within the risk assets portion of the portfolio, there is a bias to the UK and Japan and away from the US, which still looks expensive even after the recent falls.
Figure 7: Median discount on all investment companies
Source: Morningstar, Marten & Co. Data to 27 May 2025
In recent years, a variety of factors have combined to drive discounts on London-listed investment companies wider. Rising interest rates triggered asset allocation changes as yields on cash and bonds became more attractive, and they also drove up discount rates used to calculate the net present value of forecast cashflows. Growth-focused trusts sold off; those holding loss-making and cash consumptive companies were particularly badly affected. Misleading cost disclosure rules and consolidation amongst wealth managers meant that this significant group of investors were net sellers.
For the most part, boards have been proactive in seeking to address the issue. However, CGT’s managers engage with boards and managers where necessary. CGT has also backed the launch of Achilles Investment Trust, which aims to act as a catalyst for a narrowing of discounts in trusts focused on alternative assets.
Asset allocation
Figure 8 shows how CGT’s monthly asset allocation has varied since March 2011. The managers have significantly reduced exposure to funds/equities from a peak close to 50% around the end of 2020. Over the period covered by the chart, the index-linked government bond exposure peaked at 48% in May 2012 and again at 51% in February 2024. More recently, the exposure to conventional bonds and corporate credit has grown as CGT’s managers increased its weighting to dry powder.
Figure 8: CGT asset allocation history
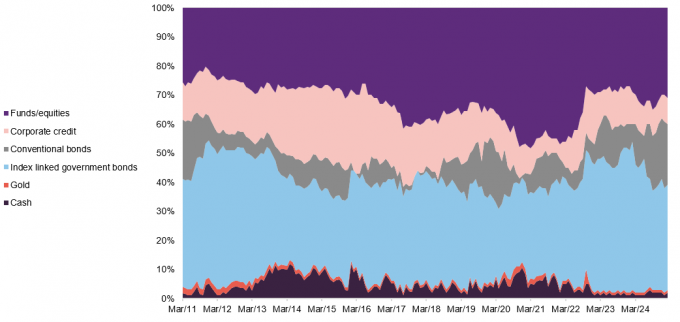
Source: Capital Gearing Trust
Figure 9: Asset allocation as at 30 June 2025
Figure 10: Split of funds/equities allocation as at 30 June 2025
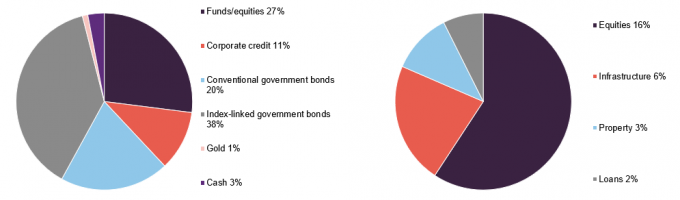
Source: Capital Gearing Trust
Source: Capital Gearing Trust
CGAM estimates that 81% of the portfolio could be liquidated within one day (assuming CGT accounts for 25% of the average daily volume) and 94% in less than 15 days.
Figure 11: CGT’s currency exposure as at 30 June 2025
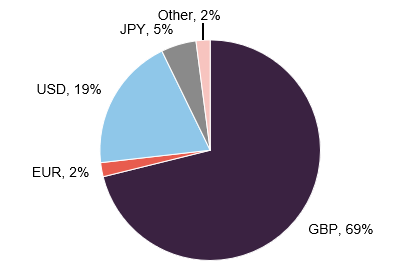
Source: Capital Gearing Trust, other includes AUD, CAD, CHF, and NOK
Largest underlying holdings
Figure 13: Largest equity and bond positions in the portfolio as at 31 March 2025
| Largest equity holdings | As at 31/03/25 (%) | Largest bond holdings | As at 31/03/25 (%) |
|---|---|---|---|
| JPMorgan Japan ETF | 2.6% | JGB 0.60% 01/01/27 | 5.2% |
| Vanguard FTSE 100 ETF | 1.9% | US Index-linked 0.125% 15/10/26 | 2.7% |
| North Atlantic Small Companies | 1.8% | UK Index-linked 0.125% 22/03/29 | 2.4% |
| PRS REIT | 1.1% | US Index-linked 0.125% 15/04/26 | 2.4% |
| Vanguard FTSE 250 UCITS ETF | 1.1% | JTDB 0.00% 20/06/25 | 2.3% |
| International Public Partnership | 1.0% | JTDB 0.00% 20/11/25 | 2.3% |
| HICL Infrastructure | 0.9% | US Index-linked 0.625% 15/01/26 | 2.3% |
| 3I Infrastructure | 0.8% | JTDB 0.00% 20/05/25 | 2.2% |
| Smithson Investment Trust | 0.7% | US Index-linked 0.375% 15/01/27 | 2.1% |
| Target Healthcare REIT | 0.7% | US Index-linked 0.625% 1507/32 | 1.8% |
Within the funds/equities portfolio, CGT backed last summer’s requisition of a meeting at PRS REIT which requested board changes at that company. New directors were appointed and, following a strategic review, the company put itself up for sale. We await the outcome of that process. In general, CGT’s managers readily engage with their investments, but have a strong preference for their activism to be behind closed doors, unless there is a specific rationale for going public.
The three infrastructure holdings shown in Figure 13 trade on discounts between 16.8% and 25.1%. February’s bid for BBGI Global Infrastructure at a 3.4% premium to NAV illustrates the potential upside from these positions. CGT made a decent profit buying Polar Capital Global Financials last year and holding it while the discount trended in ahead of this year’s 100% tender offer. The managers have been booking profits from this position. BH Macro’s discount widened last year for a variety of reasons, including a perceived overhang of stock as two large shareholders merged. CGT took advantage of weakness and bought in at discounts up to 18%. The discount has now closed to around 7% today, and BH Macro is well positioned to gain from macro volatility. Indeed, the share price has been trading higher in anticipation that the company was able to profit from recent market volatility.
CGT continues to exploit discounts in the investment trust market. It built a material position in Fidelity Japan Trust on a discount of 14%. The trust has since announced a strategic review, and whatever the outcome of that, the managers of CGT expect a liquidity event at or around NAV. Elsewhere, Mobius Investment Trust is a well-managed emerging market trust, albeit with an idiosyncratic and concentrated portfolio. The discount is around 6% and the trust will offer liquidity this autumn at close to NAV.
Finally, the managers added a large position of abrdn Asian Focus Trust through the conversion of convertible loan stock, at what amounted to a discount of 17% to NAV. CGT believes the chairman and the board are dissatisfied with the discount and will seek to bring it down to single digits.
Performance
Figure 14: CGT NAV total return and UK inflation (CPI) over five years to end June 2025
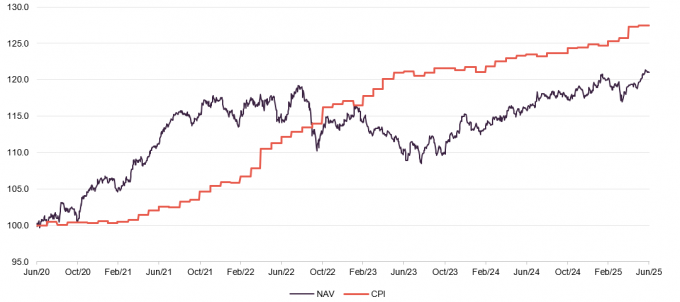
Source: Morningstar, Marten & Co
CGT’s underweight position to equities was a drag on performance as the US market in particular rallied. However, even after recent falls the managers believe the market to be overvalued. Nonetheless, the managers say that they have outperformed in six of the seven separate asset classes in which they invest.
A period of very strong absolute performance came to an end towards the end of 2021, coincident with a surge in inflation and rising interest rates as the portfolio had significant interest rate exposure. CGT then tracked sideways before giving back some of its earlier good performance between August 2022 and August 2023. Since then, CGT’s NAV total returns have been rising again, surpassing the previous peak in November 2024. CGT is very well positioned to benefit from any further falls in equities.
Figure 15: Cumulative total returns for periods ended 30 June 2025
| 1 month | 3 months | 6 months | 1 year | 3 years | 5 years | 10 years | |
|---|---|---|---|---|---|---|---|
| CGT price | 1.5 | 2.1 | 2.3 | 3.9 | 1.3 | 16.2 | 63.7 |
| CGT NAV | 1.2 | 1.3 | 2.5 | 4.4 | 6.1 | 21.1 | 68.9 |
| CPI | 0.0 | 1.8 | 2.1 | 3.2 | 13.6 | 27.5 | 38.2 |
| MSCI UK IMI | 0.2 | 3.9 | 9.2 | 11.1 | 34.6 | 67.7 | 89.0 |
As Figure 15 shows, over 10 years, CGT’s NAV and share price have both strongly outperformed inflation. Although the return on UK equities was higher, CGT’s returns have been much less volatile than those of the index with a standard deviation of 6.2% compared to the index’s 17.1%. Over the 10-year period ended 30 June 2025, CGT’s largest monthly drawdown was 4.9%, which compares to 13.4% for the MSCI UK Index and 10.6% for the MSCI World Index.
Dividend
Figure 16: CGT five-year dividend history, financial years ended 31 March

Source: Capital Gearing Trust
CGT is focused on delivering total returns rather than income. It declares a single annual dividend each year. For the financial year ended 31 March 2025, the dividend was fully covered by earnings. CGT also has substantial reserves. At the end of March 2025, the balance on the revenue reserve was £22.58m. It also had a special reserve of £842.9m at that date, which is distributable and can be used to support both dividends and share buybacks.
The significant 30.8% increase in the dividend for 2025 over 2024 reflects the higher amount of revenue earned and the designation of 66p of the total 102p dividend as an interest distribution, which decreases the company’s corporation tax liability.
Premium/(discount)
The board believe that the threat of an expanded discount is not one that shareholders should be expected to bear. Therefore, since 2015, CGT has operated a discount control policy whereby it aims to purchase or issue shares to ensure, in normal market conditions, that its shares trade consistently close to NAV. At each AGM, shareholders are asked to approve the issuance of up to one third of CGT’s issued share capital and buy back up to 14.99%. If necessary, the board seeks to renew these permissions between AGMs.
In bear markets discounts tend to get much wider across the investment trust sector. However, investors in CGT should be protected. There is also the potential for a mid-single digit share price gain were the trust to return to its historic premium and restart issuing shares.
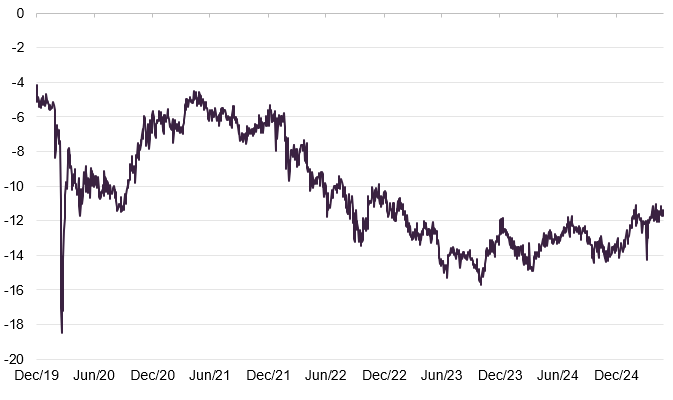
Figure 17: CGT premium/(discount) over five years to end June 2025
Source: Morningstar, Marten & Co
CGT was trading at a premium fairly consistently until the end of 2022, but moved to trading at a discount as CGT’s NAV returns lagged surging inflation. The company bought back stock to hold the discount around the 2% level, but share repurchases must be financed from distributable reserves, and towards the end of 2023, these had been fully used. A meeting was held on 5 December 2023 at which it secured permission to cancel the company’s share premium account, creating the special reserve described above, and it was able to recommence share buybacks. We do not envisage a repeat of this situation. This episode led CGT to dismiss its company secretary and administrator and appoint Frostrow LLP in its place (see page 13). The company last secured permission to buy back 14.99% of its share capital at a general meeting held on 26 March 2025.
Figure 18 shows CGT’s share buyback activity over the past year.
Figure 18: CGT share buybacks by month

Source: Capital Gearing Trust
Structure
Fees
CGT has the lowest ongoing charges ratio of its immediate peer group. CGAM charges an annual fee of 0.60% on the first £120m of net assets, 0.45% on the next £380m, and 0.30% on the balance. CGAM also receives an additional annual fee of £150,000 in relation to AIFM services (including investor relations and marketing). The notice period under the management agreement is six months.
Frostrow Capital LLP provides secretarial and administration services to the company. Frostrow is entitled to a fee of 0.11% on the first £150m of CGT’s market capitalisation and 0.05% of market capitalisation above £150m.The discount control mechanism is managed by JP Morgan Securities.
For the financial year ended 31 March 2024, CGT’s ongoing charges ratio was 0.47%.
Capital structure
CGT’s capital structure is straightforward, with ordinary shares and no other classes of share capital. As at 30 April 2025, the total number of ordinary shares in issue was 26,580,263, of which 8,782,849 shares were held in treasury. Therefore, the total number voting rights in the company was 17,797,414.
The company’s year-end is 31 March, and it usually holds its AGMs about three months after that.
The company has the authority to borrow up to 20% of net assets, subject to prior board approval. In practice, the manager does not use gearing or short selling.
Management team
CGAM was established with three founding principles:
- the client comes first;
- don’t be greedy; and
- have fun.
The business is majority-owned by an employee ownership trust, and intends to remain independent. A significant majority of the managers’ assets are invested in the funds managed, aligning their interests with clients directly.
There are 12 members of the CGAM team, six of whom are focused on investments. They are the three leads on the portfolio – Peter Spiller, Alastair Laing, and Chris Clothier – plus the more recent recruits, Hassan Raza, Emma Moriarty, and Jock Henderson.
Peter Spiller
Prior to founding CGAM in 2001, Peter was a partner and strategy director at Cazenove & Co Capital Management and a US equity investor at Capel Cure & Myers. Peter has managed CGT since 1982.
Chris Clothier
Chris joined CGAM in 2015 and has co-managed the funds since that date. Prior to that, he was a director at IPGL Limited, a private investment vehicle with a range of public and private interests predominantly in the financial services industry, where he worked for six years. Before that he worked at MMC Ventures, an early-stage venture capital firm. Chris studied Chemistry at New College, Oxford.
Alastair Laing
Alastair joined CGAM in 2011, and has co-managed the funds since that date. He joined CGAM from HgCapital LLP (a pan-European private equity fund) and had previously worked with the mergers and acquisitions team at Deloitte LLP. Alastair was educated at Edinburgh University and was an MBA Scholar at London Business School. He is a member of the Chartered Institute of Accountants of Scotland.
Hassan Raza
Hassan joined CGAM in 2020. Prior to that, he worked in M&A and Leveraged Finance at HSBC. He began his career at PwC in 2013 advising on corporate finance for infrastructure projects. Hassan read Mathematics & Economics at the London School of Economics and is a CFA Charterholder.
Emma Moriarty
Emma joined CGAM in 2022. Before joining, she worked as a macroeconomist at the Bank of England for eight years, focusing on risks in financial markets. She began her career in the capital markets practice at Bell Gully, a New Zealand-based corporate law firm. Emma holds an MSc in Economic History from the London School of Economics, and studied Economics, Finance and Law at the University of Auckland.
Jock Henderson
Jock joined CGAM in 2024. He graduated from Durham University with a Combined Honours (Hons) degree studying History and Geography. Jock previously spent the summer of 2023 on an internship with the investment team and is currently studying for his CFA level 1.
Board
The board comprises six directors, all of whom are non-executive and independent of the manager. The board has been refreshed in recent years. Jean Matterson stepped down as chairman and as a director following the AGM that was held on 3 July 2025. Her replacement as chairman was Karl Sternberg, who was appointed a director in September 2024.
Figure 19: The board
| Position | Appointed | Length of service (years) | Annual fee (GBP) | Shareholding | |
|---|---|---|---|---|---|
| Karl Sternberg | Chairman | 9/2024 | 0.5 | 32,500 | 418 |
| Ravi Anand | Chairman of the audit and risk committee | 8/2023 | 1.6 | 40,000 | 4,430 |
| Wendy Colquhoun | Senior independent director and chairman of the remuneration committee | 1/2021 | 4.2 | 35,000 | 400 |
| Paul Yates | Chairman of the management engagement committee | 12/2019 | 5.3 | 32,500 | 2,000 |
| Dr Theodora Zemek | Director | 11/2024 | 0.3 | 32,500 | – |
Karl Sternberg (chairman since 3 July 2025)
Karl is chairman of The Monks Investment Trust Plc, Clipstone Industrial REIT Plc, and Apax Global Alpha Limited, and a non-executive director of Jupiter Fund Management Plc and The Howard de Walden Estate. Prior to his non-executive career, he held a number of positions at Morgan Grenfell/Deutsche Asset Management between 1992 and 2004, including chief investment officer for London, Australia, Europe, and the Asia Pacific. He left that firm to establish institutional asset manager Oxford Investment Partners, which was acquired by Towers Watson in 2013.
Ravi Anand (chairman of the audit and risk committee)
Ravi is a highly experienced corporate financier and commercial business director. He is currently managing director at ThinCats Group Limited, a leading alternative lender focused on the funding needs of mid-sized UK SMEs. Ravi has a wide-ranging role at ThinCats from setting strategic direction to heading up the day-to-day funding activities for the group, as well as overseeing its analytics function, and as a member of its investment committee. Ravi has more than 33 years of financial services experience. He has created businesses and led numerous corporate transactions, including many in the investment companies sector. Prior to ThinCats, Ravi and was head of corporate finance at boutique investment bank Dexion Capital, head of corporate finance and alternatives at New Star Asset Management, and a director of equity capital markets at HSBC Investment Bank. He qualified as a chartered accountant at KPMG.
Wendy Colquhoun (senior independent director and chairman of the remuneration committee)
Until May 2020, Wendy was a senior corporate partner at international law firm CMS Cameron McKenna Nabarro Olswang LLP, where she specialised in financial services. She has over 25 years of experience in providing advice to investment trusts. After qualifying as a solicitor in 1987, Wendy held roles with Dickson Minto WS and Linklaters before heading up the UK corporate group at Dundas & Wilson (a leading Scottish law firm) prior to its merger with CMS Cameron McKenna in 2014. She is chairman of Henderson Opportunities Trust Plc and a non-executive director of Schroder UK Mid Cap Fund Plc and Murray International Trust Plc.
Paul Yates (chairman of the management engagement committee)
Paul is chairman of the advisory board of 33 St James’s Limited and is a non-executive director of Fidelity European Trust Plc, where is he also the senior independent director. His extensive career in investment management began at Samuel Montagu & Co in 1980. He joined Phillips and Drew in 1985, being the year that it was acquired by UBS. During his time at UBS, he held a number of positions covering management, portfolio management, pensions, strategy and client service. He was CEO of UBS Global Asset Management (UK) Limited between 2001 and 2005 and, after undertaking a number of global roles at UBS, he retired in 2007.
Dr Theodora (Theo) Zemek (director)
Theo is a non-executive director at BlackRock Fund Managers and EFG Asset Management (UK) Limited. She has over 30 years’ of experience within fixed income investment. Theo commenced her city career in bonds sales, moving into fund management in 1988. She spent nine years with M&G, rising to be chief investment officer of M&G International, before joining New Star Asset Management in November 2002. In March 2008, she joined AXA Investment Managers, where she was global head of fixed income and a member of AXA Investment Manager’s management board.
Previous publications
We published a number of notes on CGT between September 2018 and March 2020, which are available to view on the QuotedData website.
IMPORTANT INFORMATION
This marketing communication has been prepared for Capital Gearing Trust Plc by Marten & Co (which is authorised and regulated by the Financial Conduct Authority) and is non-independent research as defined under Article 36 of the Commission Delegated Regulation (EU) 2017/565 of 25 April 2016 supplementing the Markets in Financial Instruments Directive (MIFID). It is intended for use by investment professionals as defined in article 19 (5) of the Financial Services Act 2000 (Financial Promotion) Order 2005. Marten & Co is not authorised to give advice to retail clients and, if you are not a professional investor, or in any other way are prohibited or restricted from receiving this information, you should disregard it. The note does not have regard to the specific investment objectives, financial situation and needs of any specific person who may receive it.
The note has not been prepared in accordance with legal requirements designed to promote the independence of investment research and as such is considered to be a marketing communication. The analysts who prepared this note are not constrained from dealing ahead of it, but in practice, and in accordance with our internal code of good conduct, will refrain from doing so for the period from which they first obtained the information necessary to prepare the note until one month after the note’s publication. Nevertheless, they may have an interest in any of the securities mentioned within this note.
This note has been compiled from publicly available information. This note is not directed at any person in any jurisdiction where (by reason of that person’s nationality, residence or otherwise) the publication or availability of this note is prohibited.
Accuracy of Content: Whilst Marten & Co uses reasonable efforts to obtain information from sources which we believe to be reliable and to ensure that the information in this note is up to date and accurate, we make no representation or warranty that the information contained in this note is accurate, reliable or complete. The information contained in this note is provided by Marten & Co for personal use and information purposes generally. You are solely liable for any use you may make of this information. The information is inherently subject to change without notice and may become outdated. You, therefore, should verify any information obtained from this note before you use it.
No Advice: Nothing contained in this note constitutes or should be construed to constitute investment, legal, tax or other advice.
No Representation or Warranty: No representation, warranty or guarantee of any kind, express or implied is given by Marten & Co in respect of any information contained on this note.
Exclusion of Liability: To the fullest extent allowed by law, Marten & Co shall not be liable for any direct or indirect losses, damages, costs or expenses incurred or suffered by you arising out or in connection with the access to, use of or reliance on any information contained on this note. In no circumstance shall Marten & Co and its employees have any liability for consequential or special damages.
Governing Law and Jurisdiction: These terms and conditions and all matters connected with them, are governed by the laws of England and Wales and shall be subject to the exclusive jurisdiction of the English courts. If you access this note from outside the UK, you are responsible for ensuring compliance with any local laws relating to access.
No information contained in this note shall form the basis of, or be relied upon in connection with, any offer or commitment whatsoever in any jurisdiction.
Investment Performance Information: Please remember that past performance is not necessarily a guide to the future and that the value of shares and the income from them can go down as well as up. Exchange rates may also cause the value of underlying overseas investments to go down as well as up. Marten & Co may write on companies that use gearing in a number of forms that can increase volatility and, in some cases, to a complete loss of an investment.