European winners, global exposure
European Opportunities Trust (EOT) remains the most growth-focused fund in its peer group. This is at a time when there are increasing signs of this style of investing coming back into favour, as inflation remains under control and interest rates trend down. More widely, Europe seems to be coming back on to the radar of investors, not least because of the policy whiplash that has accompanied Donald Trump’s second presidency, and its impact on the US market. Nonetheless, the managers are not simply relying on a European renaissance, but are maintaining their focus on companies with global revenues.
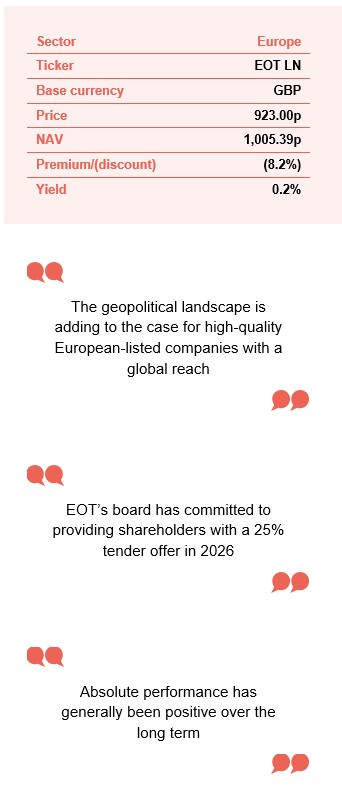
The board of EOT has been proactive in addressing the trust’s stubborn discount to net asset value (NAV), and periods of difficult performance, by consistently making NAV-accretive share repurchases, most notably the 25% tender offers completed in January 2024 and June 2025.
Capital growth from ‘special’ European companies
The objective of the company is to achieve long-term capital growth by investing in a portfolio of securities of European companies and in sectors or geographical areas which are considered by the investment manager to offer good prospects for capital growth, considering economic trends and business development. The manager looks for ‘special’ companies – these are niche winners in their respective fields that can flourish in a range of economic scenarios.
At a glance
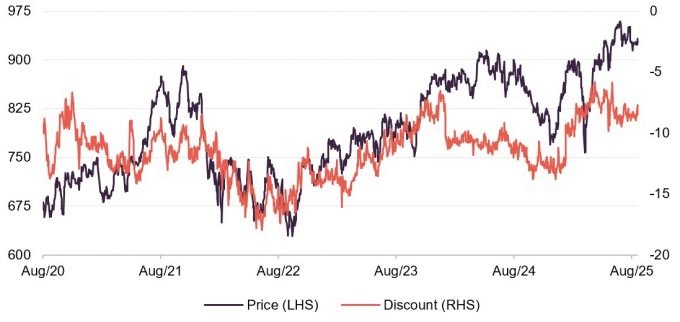
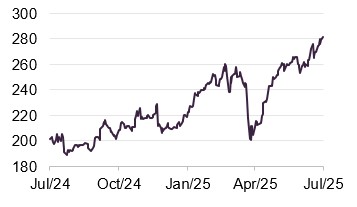
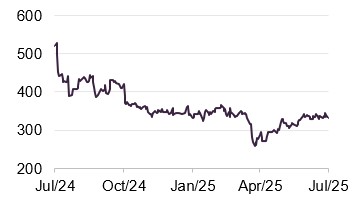
Share price and discount
Over the past five years, EOT has experienced a persistent discount. Historically, the trust had often traded at or near to par due to strong long-term returns and confidence in its stock-picking approach. However, this began to shift materially in 2020, first with the onset of COVID and then the collapse of Wirecard. As a result, the discount– which had typically been in the low single digits pre-2020– widened into double digits.
Time period 31 August 2020 to 18 September 2025
Source: Bloomberg, Marten & Co
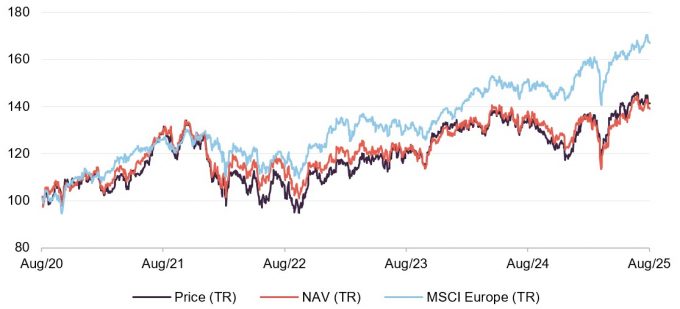
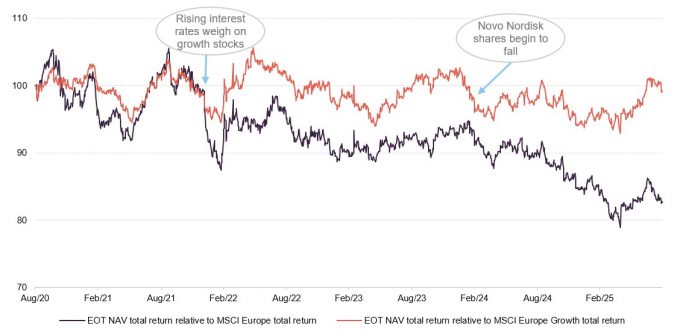
Performance over five years
Much of the five-year period was tough for growth-focused investors like EOT, due to rising inflation and interest rates from late 2021. Once the rate tightening cycle ended (ECB rates peaked in September 2023), EOT’s performance stabilised. The period of underperformance that began in mid-2024 coincided with a steep decline in the share price of Novo Nordisk.
Time period 31 August 2020 to 31 August 2025
Source: Bloomberg, Marten & Co
| 12 months ended | Share price total return (%) | NAV total return (%) | MSCI Europe total return (%) | MSCI Europe Growth total return (%) |
|---|---|---|---|---|
| 31/08/21 | 27.2 | 26.6 | 25.2 | 25.6 |
| 31/08/22 | (18.1) | (12.8) | (7.3) | (13.2) |
| 31/08/23 | 14.1 | 8.9 | 12.3 | 10.6 |
| 31/08/24 | 13.0 | 13.3 | 15.6 | 14.7 |
| 31/08/25 | 3.4 | 0.7 | 10.2 | 0.0 |
Purchase of Devon EM by River Global
Devon Equity Management is to be acquired by River Global.
EOT is managed by Devon Equity Management (Devon EM). Devon EM was established in November 2019 by three former Jupiter Asset Management colleagues – Alexander Darwall, Luca Emo, and Richard Pavry – after Alexander left Jupiter, where he had been managing what was then the Jupiter European Opportunities Trust since its launch in 2000.
In July, it was announced that Devon EM is to be acquired by River Global, at a value of up to £2.46m. River Global was formed by bringing together River and Mercantile Asset Management, SVM Asset Management and Saracen Fund Managers in 2023. It specialises in long-only equities and offers a range of UK, European, Indian, and global strategies.
As part of the deal, Alexander, Devon EM’s chief investment officer as well as EOT’s lead portfolio manager, will become co-head of European equities alongside Devon’s Charlie Southern. Luca will maintain a senior position within the enlarged organisation. Devon EM has highlighted the potential for increased marketing coverage for EOT and other funds in the newly enlarged group, and suggests that the managers from Devon EM are likely to take over the running of some of River Global’s existing funds in due course.
Market outlook
Europe has performed relatively well recently and is back on the radar of investors.
After a prolonged period of underperformance, Europe has begun to reappear on the radar of investors. The MSCI Europe Index delivered a robust 6.5% total return in the first half of 2025 (13.0% in sterling terms), better than it managed across the entirety of 2024. Despite persistent structural headwinds, including labour market rigidity, ageing demographics and uneven fiscal integration, the market has valuation support. The forward price-to-earnings ratio (a valuation measure that compares a company’s or index’s current share price to its forecast earnings per share) for the STOXX Europe 600 Index is c.12.8x, compared with c.19.3x for the S&P 500, while net positive flows into European equity funds in the second quarter of the year highlight renewed investor interest – particularly in industrials, clean energy and luxury goods, sectors where Europe maintains global leadership.
Challenges remain, however. Eurozone labour productivity rose just 0.2% in 2024, well behind the 1.2% gain in the US, according to Eurostat. Whilst France and Spain have introduced limited labour and fiscal reforms, progress elsewhere remains patchy. Without a meaningful economic catch-up, a pan-European re-rating (a revaluation of the market or sector that leads to higher price multiples) still looks a way off.
Trump is shifting Europe’s politics and economics
Germany has made dramatic moves to increase defence and infrastructure spending.
In a landmark move on 21 March 2025, Germany eased its constitutional “debt brake” (a fiscal rule limiting government structural deficits), exempting defence spending above 1% of gross domestic product (GDP) from borrowing limits and approving a €500bn offbudget infrastructure fund to be deployed over the next 12 years. The reform also allows federal states to run annual structural deficits of up to 0.35% of GDP – a first at the individual state level.
Germany’s shift is the clearest sign yet of Europe’s strategic rethink, triggered by Trump’s return to the White House. With US security guarantees under significant scrutiny – particularly Trump’s level of commitment to NATO and Europe – European policymakers are rethinking their approach to defence, industrial resilience, and strategic autonomy.
Beyond Germany, several member states are ramping up defence spending, while the European Commission is reviving efforts on energy security, supply chain re-shoring (relocating production and supply lines back to Europe), and capital markets integration. The tone is more pragmatic, with fiscal discipline increasingly balanced against the need for strategic autonomy. The shifts in Washington are pushing Europe towards a more interventionist, self-sufficient policy mix, with potentially long-term implications for investors.
A better inflation picture (in the eurozone at least)
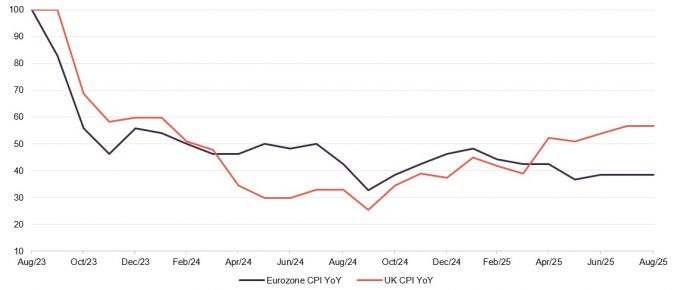
Figure 1: Inflation over 2 years to 31 August 2025, indices rebased to 100
Source: Bloomberg, Marten & Co
Inflation appears to be under control in the eurozone.
Inflation in the eurozone has crept slightly higher recently, but remains close to the European Central Bank’s (ECB’s) 2% target. Headline CPI (Consumer Price Index, a measure of overall inflation including all goods and services) rose to 2.0% in June, up from 1.9% the previous month, while core inflation (which excludes volatile items like energy and food) eased to 2.3% – its lowest reading in over two years. Pricing pressures remain concentrated in food and alcohol, with elevated energy costs being a contributory factor. In response, the ECB reduced its key policy rate by a further 25 basis points (one basis point = 0.01%) in June, bringing it to 2%. This marked the eighth cut in a year.
The ECB now expects inflation to dip below target in 2026 before stabilising at 2% over the medium term. While further easing has not been ruled out, markets expect a summer pause, with geopolitical risks and currency volatility likely to guide the next move.
In the UK, the picture is somewhat less benign. Headline inflation rose to 3.6% in June – well above the Bank of England’s 2% target, and the highest level since early 2024. The move was driven by rising transport costs, higher prices across food and clothing and the delayed impact of fiscal measures such as an increase in the minimum wage and increase in employers’ national insurance payments. Core inflation and services inflation remain sticky (slow to decline), with the latter running at close to 4.7%, underscoring the underlying pricing pressures.
At the same time, labour market indicators have started to soften. The unemployment rate rose to 4.7% in June – a post-pandemic high – and wage growth is beginning to moderate. The Bank of England cut rates from 4.25% to 4% in August. Further reductions are possible before the end of the year, but with four of nine Monetary Policy Committee (MPC) members voting to keep rates on hold, there are no guarantees.
EOT: a European portfolio, but with global exposure
EOT’s portfolio consists of European companies with globally diversified revenues.
EOT’s managers emphasise that, while clearly exposed to the continent, the revenues of the companies in their portfolio are global. This is demonstrated in Figures 2 and 3, showing the weighted average sales by region of the whole portfolio, and the sales by region of the top 10 holdings (the current top 10 is explored in more detail on page 10).
Figure 2: EOT weighted average sales by region as at 30 June 20251
Figure 3: Sales by region of Top 10 holdings as at 30 June 2025
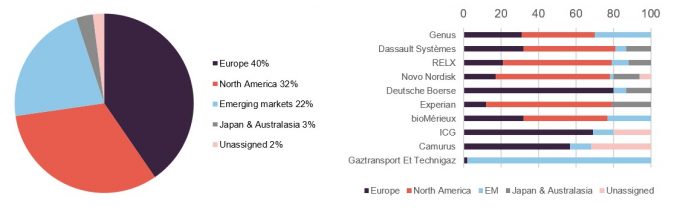
Source: European Opportunities Trust. Note: 1) Excluding cash.
Source: European Opportunities Trust
The geopolitical landscape is adding to the case for high-quality European-listed companies with a global reach. In a world of rising tariffs, trade shifts and heightened political risk, companies with diversified revenue streams and flexible supply chains are holding up well. Those with the scale, legal footing, and political clout to navigate trade frictions look especially well placed.
Asset allocation
Geographic allocation
Figure 4: EOT geographic allocation as at 31 August 20251
Figure 5: EOT geographic allocation as at 30 September 20241
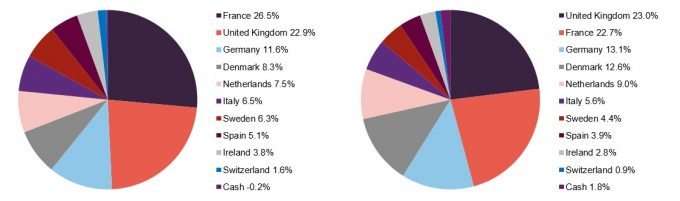
Source: European Opportunities Trust. Note: 1) as a proportion of total assets.
Source: European Opportunities Trust. Note: 1) as a proportion of total assets.
Figures 4 and 5 show the change in geographic allocation since our last note in October 2024 (which used figures as at 30 September 2024). The inclusion of the UK within its investable universe marks EOT out amongst its peer group, which is otherwise made up of Europe ex-UK funds. The UK allocation has fallen slightly, to be second behind France; French exposure has rebounded back close to where it was before the snap election in 2024. The big drop in the allocation to Denmark reflects the reduction in the holding of Novo Nordisk (see page 13), previously the largest single holding within the portfolio.
Sectoral allocation
Figure 6: EOT sectoral allocation as at 31 August 20251
Figure 7: EOT sectoral allocation as at 30 September 20241
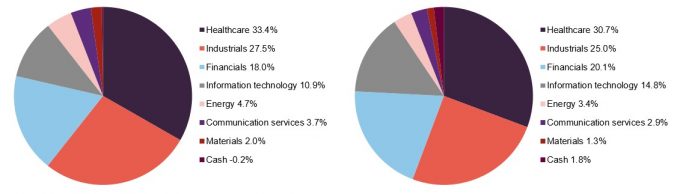
Source: European Opportunities Trust. Note: 1) as a proportion of total assets.
Source: European Opportunities Trust. Note: 1) as a proportion of total assets.
As shown in Figures 6 and 7, EOT’s sectoral allocation has remained broadly stable since our last note in October 2024. There has been no change in the respective position of the top seven sectors. The information technology allocation has fallen with the sale of Oxford Instruments (see page 9).
EOT’s financials exposure remains overwhelmingly to alternative finance – there is no exposure to mainstream banks or insurance companies. The managers believe that other funds with a materially higher allocation to banks are running a significant risk, as the sector will suffer if interest rates fall more quickly, or to a lower level, than expected.
New additions
The managers have initiated various new positions since our last note in October.
Safran
Figure 8: Safran (EUR)
Source: Bloomberg
Safran (safran-group.com) is a French multinational company that designs, develops, and manufactures high-end equipment and systems, primarily for the aerospace and defence industries, serving both civil and military markets. Widely regarded as one of Europe’s key industrial champions, Safran is a core player in the aviation supply chain, particularly known for its propulsion, landing gear, braking and avionics systems.
The company currently has a multi-year orderbook, focused on narrowbody single-aisle aircraft, to supply both Airbus and Boeing. Through a formal 50/50 joint venture with GE Aerospace, named CFM International – which was recently extended to 2050 – Safran Aircraft Engines designs, produces and maintains the LEAP engine. Specifically, it builds the fan, low-pressure turbine and gearbox. LEAP is a high-bypass turbofan engine (a type of jet engine with high fuel efficiency and quieter operation), the successor to the hugely successful CFM56 engine (the bestselling engine in aviation history), and is designed to power new-generation narrowbody aircraft with improved efficiency, lower emissions and reduced noise.
Competitors are struggling to match the LEAP engine, and EOT’s manager thinks it could be at least a decade before China’s COMAC catches up. In the meantime, Safran looks set to benefit from a cyclical upswing and strong earnings momentum.
VAT Group
Figure 9: VAT Group (CHF)
Source: Bloomberg
VAT Group (vatgroup.com) is a Swiss-based global leader in the design, manufacture and supply of high-performance vacuum valves and related systems. These components are critical in processes that require ultra-clean, high-precision vacuum environments, particularly in industries such as semiconductor manufacturing, flat panel display production, solar photovoltaics and advanced industrial coatings.
EOT sees VAT Group as a proxy (a company whose performance reflects that of another, related business or trend) for the extreme ultraviolet (EUV) lithography systems of ASML, the Dutch specialist in photolithography machines that is the largest supplier to the semiconductor industry. VAT supplies the valves used in these machines and looks set to benefit from the continued growth in cloud computing. By some estimates, cloud computing adds as much as 1% per annum to US GDP growth.
The shares have derated sharply over the past year. VAT’s fortunes are closely aligned with the semiconductor capital expenditure cycle, and a slump in memory chip spot prices led to capex delays. This allowed EOT’s manager to initiate the position in a long-term growth opportunity at an historically low valuation.
Wise
Figure 10: Wise (GBP)
Source: Bloomberg
Wise (wise.com) is a UK-based financial technology company that provides low-cost international money transfers, multi-currency accounts and borderless banking infrastructure. Founded in 2011 by Estonian entrepreneurs Taavet Hinrikus and Kristo Käärmann, Wise has grown into one of Europe’s leading fintech platforms, offering a transparent alternative to traditional banking for cross-border payments.
Wise is able to reduce prices for customers each year without diluting its margin, due to steadily increasing volumes. It continues to sign up new customers, most recently UniCredit, which chose the Wise Platform to integrate international money transfers directly into its mobile banking app. This makes UniCredit the first major bank in Europe to offer transfers that work like domestic payments, settling almost instantaneously, through an app.
The holding has performed strongly since EOT’s initial purchase in December. As a digital business, Wise is unlikely to be hit by Trump’s tariffs directly. However, remittance flows (cross-border transfers of money typically sent by migrant workers to family back home) could come under pressure as a result and there is a risk that the US administration could explicitly target remittances. The recently-passed One Big Beautiful Bill Act backs a 3.5-5% excise tax (levied on specific goods or transactions) on outbound transfers sent by non-citizens, although it remains unclear if – or how – it will be enforced.
Sales
The managers have sold several holdings since we last reported.
Oxford Instruments – EOT’s manager took the decision to exit the position following execution missteps and product recalls within the company’s high-end imaging systems division. This is a core product area that has been hit by write-offs and poor sales. Losses in its NanoScience unit, focused on quantum computing, saw that division sold to Quantum Design for £60m. The 12-month outlook for Oxford Instruments remains weak.
Genmab – this biotechnology company, which is focused on developing monoclonal antibodies (lab-engineered antibodies used to target specific diseases) for cancer and autoimmune diseases, has developed a number of successful products, including Darzalex and Tepezza. However, overall progress has lagged peers, with several partnered and in-house candidates falling short. Johnson & Johnson dropped a co-developed asset and with too many question marks, EOT’s manager decided to exit.
Besi – the Dutch specialist in advanced semiconductor packaging, has been hit by delays at Intel, notably in ramping advanced nodes (smaller transistor designs that improve speed and efficiency) and progressing its mega-fab builds in Germany and Arizona. It missed order expectations in the third quarter of 2024 as a result.
Worldline – this small position was sold at the end of 2024 after a third profit warning cut organic revenue growth guidance to just 1% and led to the CEO’s departure. The company had lost market share and was accused of facilitating fraud on its platform. The share price suffered a sharp decline subsequently.
Yubico – the Swedish company behind YubiKey (a security device used for phishing-resistant multi-factor authentication) was a small position. Recent results disappointed, with margin compression and weakening demand weighing heavily on the shares, leading to an exit from EOT’s manager.
Top 10 holdings
Figure 11 shows EOT’s top 10 holdings as at 31 August 2025, and how these have changed since 30 September 2024. Edenred and Infineon have dropped out of the top 10 (having been eighth and 10th previously). The two new entrants are bioMerieux and Camurus. These have both been discussed in our previous notes and readers may wish to refer to these (see page 22 of this note for links).
There has been a reduction in concentration within the portfolio, with the top 10 accounting for 60.1% of the total portfolio, down from 65.0% at the end of September 2024. This reflects a reduction in size of EOT’s largest holdings, most notably Novo Nordisk, which has reduced significantly due both to market movements and an active choice to sell down the position.
Figure 11: Top 10 holdings as at 31 August 2025
| Holding | Sector | Country | Allocation 31 August 2025 (%) | Allocation 30 September 2024 (%) | Percentage point change |
|---|---|---|---|---|---|
| Genus | Healthcare | UK | 7.3 | 5.5 | 1.8 |
| Novo Nordisk | Healthcare | UK | 6.9 | 11.3 | (4.4) |
| Camurus | Industrials | Italy | 6.3 | 3.9 | (2.4) |
| Dassault Systèmes | Information technology | France | 6.3 | 7.2 | (0.9) |
| Intermediate Capital Group | Financials | UK | 6.0 | 5.6 | 0.4 |
| Experian | Industrials | UK | 5.7 | 8.1 | (2.4) |
| RELX | Industrials | Netherlands | 5.6 | 7.0 | (1.4) |
| bioMerieux | Healthcare | France | 5.5 | 3.9 | 1.6 |
| Deutsche Boerse | Financials | Germany | 5.3 | 7.1 | (1.8) |
| Prysmian | Energy | Italy | 5.2 | 4.5 | 0.7 |
| Total of top 10 | 60.1 | 65.0 | (4.0) |
Performance
Figure 12: EOT NAV total return performance relative to MSCI Europe and MSCI Europe Growth over five years to 31 August 2025
Source: Bloomberg, Marten & Co
Much of the five-year period was tough for growth-focused investors like EOT, due to rising inflation and interest rates from late 2021. Once the rate tightening cycle ended (ECB rates peaked in September 2023), EOT’s performance stabilised. The period of underperformance that began in mid-2024 coincided with a steep decline in the share price of Novo Nordisk. This was comfortably the largest holding in the portfolio, reaching over 15% of the total. The allocation to Novo Nordisk in EOT’s portfolio has come down in recent months, due both to market falls and active trimming of the position. As shown in Figure 11 on page 10, the largest single stock exposure is now Genus, at 7.3% of the portfolio.
If global interest rates come down further, the environment should be relatively benign for growth investors, and there is the potential for EOT to outperform. Most recently there has been an uptick in EOT’s relative performance. However, further signs of a renewed rise in inflation, such as seen recently in the UK, would likely act as a brake on EOT.
Figure 13: Cumulative total return performance over periods ending 31 August 2025
| 3 months (%) | 6 months (%) | YTD (%) | 1 year (%) | 3 years (%) | 5 years (%) | 10 years (%) | |
|---|---|---|---|---|---|---|---|
| EOT NAV | 4.6 | 3.8 | 13.3 | 0.7 | 24.3 | 37.2 | 104.9 |
| EOT share price | 3.6 | 5.0 | 18.1 | 3.4 | 33.2 | 38.7 | 82.8 |
| MSCI Europe | 3.3 | 5.2 | 15.9 | 10.2 | 43.1 | 66.1 | 132.9 |
| MSCI Europe Growth | 0.6 | (0.5) | 7.8 | 0.0 | 26.9 | 38.4 | 131.4 |
| MSCI World | 8.1 | 3.4 | 5.8 | 12.8 | 45.2 | 85.0 | 257.7 |
| Peer group NAV1 median | 1.4 | 1.0 | 10.1 | 2.0 | 30.6 | 44.8 | 140.4 |
| Peer group share price1 median | 2.8 | 4.3 | 16.1 | 7.8 | 40.4 | 50.2 | 134.5 |
Top positive contributors to performance for the year ended 31 May 2025
Figure 14: Top positive contributors to return
| Stock | Total return (%)1 | Relative contribution (%)2 |
|---|---|---|
| Deutsche Boerse | 44.9 | 2.5 |
| Gaztransport et Technigaz | 38.0 | 1.3 |
| Genus | 23.9 | 1.1 |
Gaztransport et Technigaz
Figure 15: Gaztransport et Technigaz (EUR)
Source: Bloomberg
Gaztransport & Technigaz (GTT – gtt.fr) is a French engineering company specialising in cryogenic membrane technology for liquified natural gas (LNG) transport and storage. With a near-monopolistic presence in the LNG carrier sector, GTT plays a vital and expanding role within global energy infrastructure. EOT added to the existing holding on short-term share price weakness earlier in the year.
GTT is unusual amongst companies in the energy sector. While most face pressure from OPEC (Organisation of the Petroleum Exporting Countries) increasing supply, GTT benefits from higher shipping volumes rather than price levels. It operates as a capital-light intellectual property (IP) business, earning 90% of revenue from licence royalties before ships are built. Orders are slowing, but a healthy backlog supports earnings visibility.
Recent positive news flow has included the expected restart of the $20bn TotalEnergies Mozambique LNG project, which was halted in 2021 due to security concerns. The Mozambique government now says it has created a “conducive environment” for the resumption of construction. Any expansion in LNG infrastructure translates directly into demand for new vessels equipped with GTT technology. Shell’s industry forecasts are for a 60% increase in demand for LNG over the next 10 years, primarily driven by Asian countries.
One potential risk to GTT has been the proposal from the US Trade Representative to charge fees up to $1m per port call for vessels owned or operated by Chinese entities. Although GTT does not own or operate any ships, it could be indirectly impacted by any such move. However, after industry pushback, the plan was seemingly revised in June to remove penalties for LNG tankers.
Deutsche Boerse – Germany’s top exchange and clearing operator has benefitted from improved market sentiment driven by domestic stimulus. Higher trading volumes helped first quarter results beat expectations, with double-digit growth in both revenue and earnings.
Genus – a global leader in animal genetics, Genus breeds more efficient disease-resistant livestock using genomic science. In April, its gene-edited PRRS-resistant pig (PRP) became the first gene-edited animal to be approved by the US Food & Drug Administration for use in the US food supply chain – a milestone, given that PRRS (Porcine Reproductive and Respiratory Syndrome) costs US pork producers c.$1.2bn annually. The PRP uses a targeted CRISPR edit (a precise genome editing technology) to block the infection while maintaining animal health. Genus is expected to see a positive impact on revenues from 2026.
Top negative contributors to performance for the year ended 31 May 2025
Figure 16: Top negative contributors to return
| Stock | Total return (%)1 | Relative contribution (%)2 |
|---|---|---|
| Novo Nordisk | (56.3) | (6.3) |
| Edenred | (33.3) | (2.1) |
| Dassault Systèmes | (13.0) | (1.5) |
Novo Nordisk – this was the largest detractor from EOT’s performance by some margin, as a significant overweight position sold off sharply. Novo previously had first-mover advantage in the new technology of GLP-1 drugs to treat Type 2 diabetes and obesity, through its Wegovy and Ozempic products, enjoying a duopoly in this new market alongside Eli Lilly. However, competition from “compounded” versions of the drug, data showing its product was inferior to Eli Lilly’s, and a disappointing drug trial have weighed on the share price. In May, the company issued a profit warning and announced that CEO Lars Fruergaard Jørgensen would step down.
Despite the challenges, EOT remains confident in Novo Nordisk. The company has stepped up its research and development (R&D) efforts and acquired an obesity-focused start-up. EOT believes that Novo’s fundamentals remain intact, even as valuations and earnings expectations have eased. Nonetheless, the company’s position size is now 6.9% and it is no longer EOT’s top holding. This is clearly a significant change from the time of our last note (using data as at 30 September 2024), when Novo Nordisk was still comfortably the largest holding at 12.4%.
Edenred – this is a French company that provides a digital platform for employee benefits, mobility solutions and corporate payments. It serves over 60m users with products such as meal and gift vouchers, fuel and electric vehicle charging cards, virtual payments, and programmes for employee engagement. Edenred’s shares have been weak on fears that governments may cut back such schemes. However, as recently seen in Brazil, rolling back popular benefits is politically difficult. Edenred’s growth has slowed but remains positive despite programme cuts.
Dassault Systèmes – the French 3D design and simulation software firm, has experienced weakness as clients – particularly in the automotive industry – have been struggling and postponing contracts. This has prompted Dassault to cut revenue and earnings guidance several times. However, its broad sector exposure offers resilience. Aerospace, buoyed by Chinese demand, is a bright spot. The Commercial Aircraft Corporation of China (COMAC) is ramping aircraft production – from 50 to 200 a year by 2028 – and Dassault is expected to play a key role in fulfilling this.
Peer group
Please click here for an up-to-date peer group comparison of EOT versus its Europe sector peers.
EOT is a constituent of the AIC’s Europe sector, which comprises six members, all of which are illustrated in Figures 17 to 19. Members of the Europe sector will typically have:
- over 80% invested in quoted European shares;
- less than 80% in any single geographic area;
- an investment objective/policy to invest in European shares;
- a majority of investments in medium-to-giant-cap companies; and
- a European benchmark.
Henderson European is in the throes of merging with Fidelity European.
It should be noted that there are some notable differences in strategy within the peer group. For example, Fidelity European and BlackRock Greater Europe have more of a bias to value (focusing on stocks considered undervalued by the market), while JPMorgan European Growth and Income, and Baillie Gifford European Growth, operate fairly balanced strategies. However, the principal differentiating factor for EOT from peers is its pan-European – i.e. including the UK – remit.
Figure 17: Peer group cumulative NAV total return performance to 31 August 2025
| 3 months (%) | 6 months (%) | YTD (%) | 1 year (%) | 3 years (%) | 5 years (%) | 10 years (%) | |
|---|---|---|---|---|---|---|---|
| EOT | 4.6 | 3.8 | 13.3 | 0.7 | 24.3 | 37.2 | 104.9 |
| Baillie Gifford European Growth | 1.6 | 1.7 | 10.7 | 3.4 | 14.0 | (3.5) | 66.9 |
| BlackRock Greater Europe | (3.0) | (6.2) | 2.3 | (6.1) | 30.3 | 39.0 | 178.2 |
| Fidelity European | 0.2 | (0.2) | 10.4 | 1.3 | 39.7 | 64.1 | 190.5 |
| Henderson European | 2.2 | 1.9 | 11.4 | 4.3 | 44.4 | 68.2 | 167.5 |
| JPMorgan Eur. Growth & Inc. | 2.6 | 5.2 | 12.4 | 8.5 | 31.1 | 63.6 | 134.2 |
| EOT rank | 1/6 | 2/6 | 1/6 | 5/6 | 5/6 | 5/6 | 5/6 |
| Sector median | 1.4 | 1.0 | 10.1 | 2.0 | 30.6 | 44.8 | 140.4 |
Figure 17 illustrates that, thus far in 2025, EOT has posted good NAV numbers which, as well as delivering absolute returns (the total return generated without comparison to a benchmark), also compare favourably against the peer group. If this trend continues, due to good stock picking as well as a favourable investing backdrop for growth investors, the longer-term numbers will also improve. Although the three-, five- and 10-year figures are all strongly positive, they are towards the bottom of the peer group. This is due to growth stocks being out of favour, and (in the case of the 10-year number) the specific impact of the collapse of Wirecard.
Figure 18: Peer group cumulative share price total return performance to 31 August 2025
| 3 months (%) | 6 months (%) | YTD (%) | 1 year (%) | 3 years (%) | 5 years (%) | 10 years (%) | |
|---|---|---|---|---|---|---|---|
| EOT | 3.6 | 5.0 | 18.1 | 3.4 | 33.2 | 38.7 | 82.8 |
| Baillie Gifford European Growth | 3.1 | 1.9 | 18.8 | 10.1 | 22.6 | (10.1) | 63.6 |
| BlackRock Greater Europe | (1.6) | (4.1) | 4.9 | (3.9) | 29.9 | 35.6 | 171.4 |
| Fidelity European | (0.2) | 3.7 | 16.4 | 4.9 | 52.6 | 70.6 | 198.3 |
| Henderson European | 8.5 | 8.7 | 19.7 | 15.0 | 60.9 | 85.6 | 151.7 |
| JPMorgan Eur. Growth & Inc. | 3.6 | 10.2 | 18.6 | 17.4 | 43.5 | 80.5 | 139.3 |
| EOT rank | 2/6 | 3/6 | 4/6 | 5/6 | 4/6 | 4/6 | 5/6 |
| Sector median | 2.8 | 4.3 | 16.1 | 7.8 | 40.4 | 50.2 | 134.5 |
Per Figure 18, across the sector the share price returns over the past year have been stronger than NAV returns. This reflects a broad-based narrowing of discounts. EOT fares less well on a relative basis when looking at share price returns compared to NAV, as the discount narrowing has been more pronounced for some of the other trusts in the sector. Nonetheless, the recent 25% tender offer and the board’s track record of NAV accretive repurchases (buybacks that increase the NAV per share) provide potential support for a further rerating of EOT’s shares.
Figure 19: Peer group comparison – size, fees, discount, and yield as at 7 August 2025
| Market cap (£m) | St. dev. of daily NAV1 | Ongoing charges (%) | Perf. fee | Premium/ (discount) (%) | Dividend yield (%) | |
|---|---|---|---|---|---|---|
| EOT | 438 | 17.8 | 0.98 | No | (7.8) | 0.2 |
| Baillie Gifford Eur. Growth | 336 | 22.7 | 0.65 | No | (9.1) | 0.6 |
| BlackRock Greater Europe | 552 | 20.8 | 0.95 | No | (4.9) | 1.2 |
| Fidelity European | 1,616 | 16.0 | 0.76 | No | (3.4) | 2.1 |
| Henderson European | 632 | 16.2 | 0.70 | No | (4.8) | 2.1 |
| JPMorgan Eur. Growth & Inc. | 525 | 15.8 | 0.66 | No | (3.7) | 3.9 |
| EOT rank3 | 5/6 | 4/6 | 6/6 | 5/6 | 6/6 | |
| Sector median | 539 | 17.0 | 0.73 | (4.8) | 1.6 |
EOT’s ongoing charges ratio, at 0.98%, is very slightly higher than when we last published. Its ranking has changed from second highest to highest, reflecting a small drop in the charges figure for BlackRock Greater Europe. However, a reduction in management fees has been agreed with effect from 1 October 2025, being 0.65% on the first £400m of net assets, 0.60% on £400m to £600m and 0.55% above £600m (previously 0.80% on net assets up to £1bn, 0.70% on £1bn to £1.25bn and 0.60% above £1.25bn). None of the peer group pays a performance fee.
EOT’s volatility, as measured by its standard deviation (a statistical measure of the dispersion of returns, higher values indicate greater variability), has fallen since our last note, and it continues to have the lowest volatility of the growth-focused funds in the sector. Unsurprisingly, the yield is the lowest in the sector, given the unapologetic focus on growth over income.
With discounts having narrowed across the sector, EOT’s is around 5% lower than when we last published, albeit its rank relative to the sector has fallen.
Dividend
Capital growth-focused with one dividend annually, primarily to maintain investment trust status.
EOT remains primarily focused on generating capital growth, rather than income, and so dividend income makes up a relatively small part of its overall returns. The trust primarily pays a dividend to maintain its investment trust status and so the level can fluctuate. It makes this payment annually, as a final, usually towards the end of November each year, following its approval at the company’s annual general meeting (AGM).
The trust declared a dividend of 2.0p per share for the financial year ended 31 May 2025, which will be paid on 28 October 2025. This is unchanged from the payment of the previous year. On a market price of 923p on 16 September 2025, the yield equates to 0.22%. Historically, the dividend has been covered, although that is not the case with the forthcoming payment. EOT has gradually built its revenue reserves over time, which it is proposing to dip into for the second consecutive year. The trust is not permitted to pay dividends out of capital.
Premium/(discount)
Over the past five years, EOT has experienced a persistent discount. Historically, the trust had often traded at or near to par (where the share price is equal to the net asset value) due to strong long-term returns and confidence in its stock-picking approach. However, this began to shift materially in 2020, first with the onset of COVID and then the collapse of Wirecard. As a result, the discount – which had typically been in the low single digits pre-2020 – widened into double digits. This was followed by further pressure as growth stocks fell in the period of higher inflation and interest rate rises from late 2021. EOT’s discount saw some narrowing as inflation started to recede, and more recently the 25% tender offer that completed in January 2024 provided some short-term relief.
Figure 20: EOT discount over five years
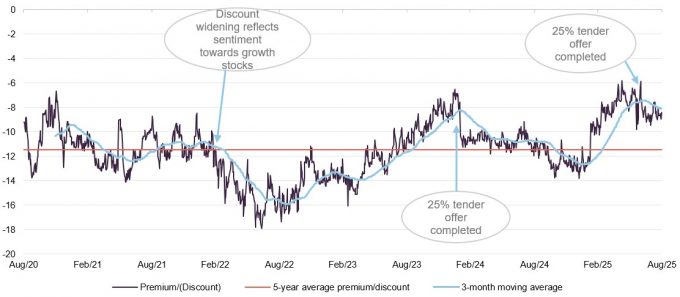
Source: Bloomberg, Marten & Co
Further tender offers in 2025 and 2026
EOT’s board has committed to providing shareholders with a 25% tender offer in 2026 if its NAV total return does not equal or exceed that of its benchmark, the MSCI Europe Index, over the three-year period from 1 June 2023 to 31 May 2026. This tender offer, which is subject to shareholders approving the trust’s continuation resolution (a vote on whether the investment trust should continue to operate) at the 2026 AGM, is to be held as soon as is practicable following the conclusion of that AGM. The tender would be priced at the prevailing NAV at the time of repurchase (adjusted for the costs associated with the tender offer) less 2%.
On top of this pre-existing commitment, the board proactively decided in February 2025 to launch an additional 25% tender offer, citing the persistent share price discount and disappointing portfolio returns. This was also set at a discount of 2% to the prevailing NAV, net of costs. There were total applications for 29.96m shares, making the offer 1.93x oversubscribed. Therefore, on top of the basic entitlements being accepted in full, around 28% of excess applications were also accepted. The tender offer completed on 27 June, with 15.55m shares being repurchased and subsequently cancelled.
As on the previous occasion in January 2024, the tender offer has provided some short-term discount relief. However, in 2024 this proved short-lived, with the discount widening again soon after it completed, and that may repeat.
Figure 21: EOT net monthly repurchases since January 2023
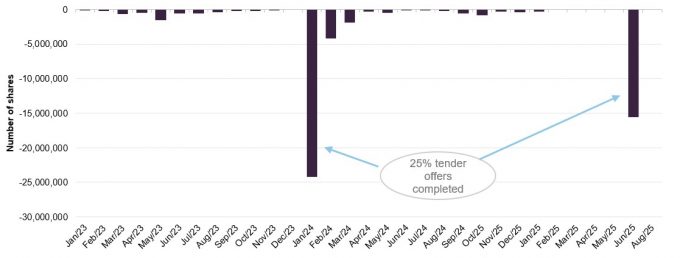
Source: European Opportunities Trust, Marten & Co
Aside from the two recent tenders offers, Figure 21 illustrates that the board of EOT makes regular share repurchases in an attempt to proactively address the discount. No buybacks were made ahead of the recent tender offer. Regular buybacks may resume, dependent on market conditions.
As of 31 August 2025, EOT had 73,248,154 shares in issue. 26,588,712 were held in treasury, leaving a free float of 46,659,442 shares.
Fund profile
More information can be found at the manager’s website:
EOT aims to achieve long-term capital growth by investing in a portfolio of European companies and in sectors or geographical areas which are considered by the investment manager to offer good prospects for capital growth, considering economic trends and business development. The manager looks for ‘special’ companies – these are niche winners in their respective fields that can flourish in a range of economic scenarios. Such companies will typically benefit from an advantageous industry structure, multiple protections and multiple avenues for growth.
The manager believes its special companies’ products will not be commodifiable (i.e. not easily replaced or reduced to low-margin, standardised goods) and that, over the long term, their results will outweigh growth versus value considerations, market fashions, geographic influences, political risks and the risk of unconstrained supply.
The approach is long-term in nature – EOT’s board considers five years as a reasonable holding period for investment in equities – and the portfolio is reasonably focused (typically 26-35 holdings). The concentration risk (the risk of poor diversification from large positions in a few stocks) within the portfolio is mitigated by a strong focus on company fundamentals to understand the risks involved, as well as high diversification by activity and geography across the holdings.
Management arrangements
The trust was launched in November 2000 and has had the same lead portfolio manager, Alexander Darwall, since launch. Originally, EOT (then called Jupiter European Opportunities) was part of the Jupiter stable of investment trusts, but EOT’s board took the decision to follow Alexander when he left that firm, moving the management contract to Devon Equity Management Limited in November 2019, after Alexander had founded that business. EOT’s investment manager also acts as its AIFM. The manager had a total assets under management (AUM) of £835m as at 30 June 2025.
As detailed on page 4, it has recently been announced that Devon is to be acquired by the UK-based asset and wealth manager River Global.
Benchmark
EOT’s benchmark is the MSCI Europe Index (total return in sterling). However, the composition of the index has no bearing on the manager’s choice of stocks or position sizes. As evidence of this, the active share at the end of June 2025 was over 90%. Indeed, EOT’s active share has consistently been above 90% for the past 15 years.
Reflecting EOT’s growth focus, we have also included performance numbers for the MSCI Europe Growth Index as we feel it offers a useful comparison, as well as numbers for the MSCI World Index to provide a comparison against global equities more generally. However, it should be noted that neither of these are indexes that the trust compares its own performance to. A peer group comparison is also included on pages 14 to 16.
SWOT analysis
Figure 22: SWOT analysis for EOT


| Good performance when market conditions are favourable and the portfolio’s companies come good, as was seen in the first half of 2025. | EOT has suffered from periods of significant underperformance, whether due to its investing style being out of favour or stock-specific issues, i.e. Novo Nordisk recently. |
| Exposure is not just to Europe, but to quality companies that have global revenue exposure. Therefore, Europe does not necessarily have to outperform for EOT to do well. | Very low income yield, although this should be well understood by shareholders. |


| There are increasing signs that growth investing is coming back into favour, against a backdrop of relatively subdued inflation and interest rate cuts. | The market could once again turn against growth investing, particularly if inflation re-emerges as a threat, as there are signs of in the UK. |
| Investors seem to be looking more favourably at Europe, not least due to the policy and fiscal uncertainty in the US caused by the Trump administration. | Single stock issues could hurt performance as they have in the past, particularly considering the relative concentration of the top 10 – although this has reduced recently. |
Bull vs bear case
Figure 23: Bull vs bear case for EOT


| Performance | Absolute performance has generally been positive over the long term, and year-to-date relative performance has improved. | EOT has had a difficult few years of relative underperformance. The failure of Wirecard in 2020, then a big overweight position, had a significant impact on performance despite the managers being quick to sell down the position as problems emerged. Over the past year, EOT’s large overweight position in Novo Nordisk has weighed on the trust’s performance. |
| Dividends | EOT focuses on capital growth rather than income. The annual dividend maintains its investment trust status, and it has built up a revenue reserve. | EOT’s very modest yield makes it unsuitable for income-seeking investors. The most recent annual payment was not covered, although that was unusual. |
| Outlook | There are signs that both Europe and growth investing are coming back into favour with investors, which should suit EOT. | If inflation returns, as there are signs of in the UK, the higher interest rates that could result would act as a brake on growth. |
| Discount | EOT trades at a discount, which could narrow or even move to a premium if the market environment is positive for EOT and its stock picks look like coming good. | The most recent narrowing of the discount was due to the 25% tender offer, and the experience of the previous tender offer suggests that the discount could quickly widen again, and then persist. |
Previous publications
Readers interested in further information about EOT may wish to read our previous notes.
| Title | Note type | Publication date |
|---|---|---|
| “Special growth companies” | Initiation | 1 November 2023 |
| Geared to growth, built in resilience | Update | 22 October 2024 |
IMPORTANT INFORMATION
Marten & Co (which is authorised and regulated by the Financial Conduct Authority) was paid to produce this note on European Opportunities Trust Plc.
This note is for information purposes only and is not intended to encourage the reader to deal in the security or securities mentioned within it. Marten & Co is not authorised to give advice to retail clients. The research does not have regard to the specific investment objectives financial situation and needs of any specific person who may receive it.
The analysts who prepared this note are not constrained from dealing ahead of it but, in practice, and in accordance with our internal code of good conduct, will refrain from doing so for the period from which they first obtained the information necessary to prepare the note until one month after the note’s publication. Nevertheless, they may have an interest in any of the securities mentioned within this note.
This note has been compiled from publicly available information. This note is not directed at any person in any jurisdiction where (by reason of that person’s nationality, residence or otherwise) the publication or availability of this note is prohibited.
Accuracy of Content: Whilst Marten & Co uses reasonable efforts to obtain information from sources which we believe to be reliable and to ensure that the information in this note is up to date and accurate, we make no representation or warranty that the information contained in this note is accurate, reliable or complete. The information contained in this note is provided by Marten & Co for personal use and information purposes generally. You are solely liable for any use you may make of this information. The information is inherently subject to change without notice and may become outdated. You, therefore, should verify any information obtained from this note before you use it.
No Advice: Nothing contained in this note constitutes or should be construed to constitute investment, legal, tax or other advice.
No Representation or Warranty: No representation, warranty or guarantee of any kind, express or implied is given by Marten & Co in respect of any information contained on this note.
Exclusion of Liability: To the fullest extent allowed by law, Marten & Co shall not be liable for any direct or indirect losses, damages, costs or expenses incurred or suffered by you arising out or in connection with the access to, use of or reliance on any information contained on this note. In no circumstance shall Marten & Co and its employees have any liability for consequential or special damages.
Governing Law and Jurisdiction: These terms and conditions and all matters connected with them, are governed by the laws of England and Wales and shall be subject to the exclusive jurisdiction of the English courts. If you access this note from outside the UK, you are responsible for ensuring compliance with any local laws relating to access.
No information contained in this note shall form the basis of, or be relied upon in connection with, any offer or commitment whatsoever in any jurisdiction.
Investment Performance Information: Please remember that past performance is not necessarily a guide to the future and that the value of shares and the income from them can go down as well as up. Exchange rates may also cause the value of underlying overseas investments to go down as well as up. Marten & Co may write on companies that use gearing in a number of forms that can increase volatility and, in some cases, to a complete loss of an investment.